Spatial Analysis for Mariculture Site Selection: A Case Study of Kukup Aquaculture Zones in the Peninsula of Malaysia
←
→
Page content transcription
If your browser does not render page correctly, please read the page content below
ORIGINAL RESEARCH
                                                                                                                                            published: 20 May 2022
                                                                                                                                   doi: 10.3389/fmars.2022.888662

                                           Spatial Analysis for Mariculture
                                           Site Selection: A Case Study
                                           of Kukup Aquaculture Zones in
                                           the Peninsula of Malaysia
                                           Wei-Kang Chor 1, Teng-Yun Lai 2, Melissa Mary Mathews 3, Tony Chiffings 3,
                                           Chi-Wei Cheng 3, Victor Charlie Andin 1, Kok-Song Lai 4 and Jiun-Yan Loh 2*
                                           1Marine Programme Conservation Department, World Wide Fund for Nature (WWF, Malaysia), Petaling Jaya, Malaysia,
                            Edited by:     2Centre of Research for Advanced Aquaculture (CORAA), UCSI University, Kuala Lumpur, Malaysia, 3 DHI Water &
                   Sebastian Villasante,   Environment (M) Sdn. Bhd, Kota Kinabalu, Malaysia, 4 Health Sciences Division, Abu Dhabi Women’s College, Higher College
University of Santiago de Compostela,      of Technology, Abu Dhabi, United Arab Emirates
                                  Spain

                       Reviewed by:
                   Nor Azman Kasan,
   University of Malaysia Terengganu,
                                           Marine aquaculture sites at Kukup Strait in the peninsula of Malaysia are experiencing a
                              Malaysia     decline in water quality in the last five years, resulting in high mortality rates (50 - 80%),
                 J.German Rodriguez,
                                           seasonal massive fish mortalities and poor profitability. Currently, Kukup farmers are
Technological Center Expert in Marine
   and Food Innovation (AZTI), Spain       involved in intensive aquaculture within the existing aquaculture zone. This study explores
                   *Correspondence:        the sustainability of a modern mariculture method, where fish farms are relocated to
                          Jiun-Yan Loh     deeper waters with higher flushing rates, and high-density polyethylene (HDPE) are used
              loh.jiun.yan@gmail.com;
          lohjy@ucsiuniversity.edu.my
                                           to improve water quality. Several site selection criteria are utilised in identifying the
                                           proposed aquaculture industrial zone: 1) bathymetry depth (operational requirement:
                                           10 m to 30 m), 2) located within the Kukup Port Limit, 3) does not interfere with the Kukup
                   Specialty section:
         This article was submitted to
                                           ferry navigation route, and 4) distance from Kukup mainland. Site feasibility analysis,
    Marine Fisheries, Aquaculture and      including hydrodynamics, meteorology, water quality, sediment quality and
                      Living Resources,    macrobenthos assessment, was conducted to compare the proposed and existing
               a section of the journal
          Frontiers in Marine Science      aquaculture sites. It was found that the water quality at the existing site contained
           Received: 03 March 2022         higher concentrations of fecal coliform and nutrients and salinity fluctuations. Tropical
            Accepted: 20 April 2022        finfish can survive under these conditions with poorer fish health and higher fish mortality.
            Published: 20 May 2022
                                           Apart from that, the flushing capacity is higher in the proposed site, indicating the capacity
                              Citation:
                                           to handle moderate-intensity aquaculture. Moderate-intensity aquaculture using HDPE
   Chor W-K, Lai T-Y, Mathews MM,
  Chiffings T, Cheng C-W, Andin VC,         cages could be profitable for the local fish farmers. Therefore, it is suggested that other
  Lai K-S and Loh J-Y (2022) Spatial       locations within Kukup Straits with deeper waters (> 25 m) with possibly improved water
Analysis for Mariculture Site Selection:
 A Case Study of Kukup Aquaculture         quality and the ability for intensive aquaculture production should be explored for a larger
  Zones in the Peninsula of Malaysia.      depth and economics of scale.
            Front. Mar. Sci. 9:888662.
    doi: 10.3389/fmars.2022.888662         Keywords: aquaculture, Kukup Island, macrobenthos diversity, site selection, water quality

Frontiers in Marine Science | www.frontiersin.org                                1                                          May 2022 | Volume 9 | Article 888662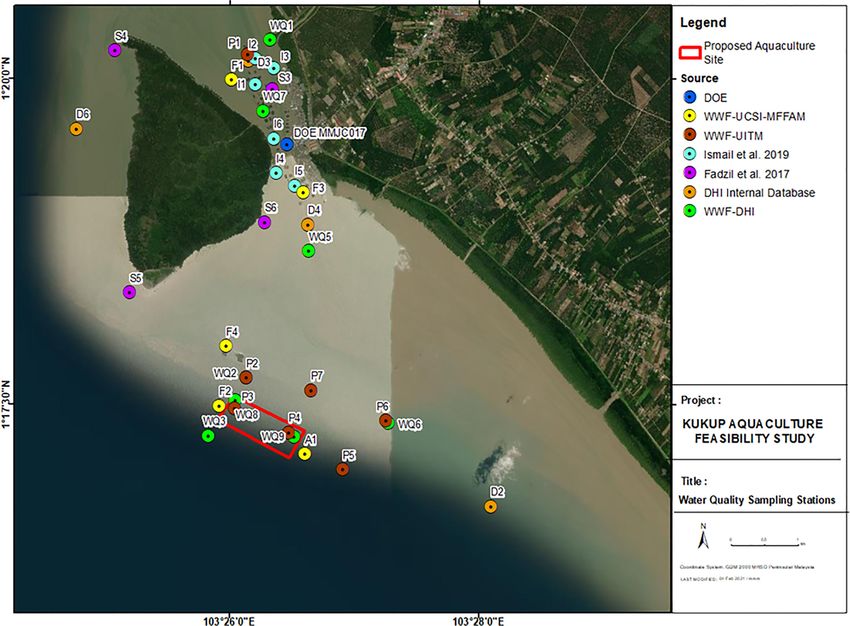
Chor et al.                                                                                                    Mariculture Spatial Analysis in Kukup

1 INTRODUCTION                                                            university and Iskandar Regional Development Authority
                                                                          (IRDA) recommended fish farmers explore other potential
Kukup is a small fish-farming community consisting of two                  farming sites south of Kukup Island (unpublished data). The
water villages (Kukup Laut and Ayer Masin) located at the start           newly proposed aquaculture development site is a 50 ha (500 m x
of Malacca Straits in Pontian District, Johor (Lai, 2014). The two        1 km) area, roughly 3.8 km from the Kukup Straits and 1.3 km
villages initially developed in the sheltered waters of Kukup             from the Kukup Port Limit (Figure 1). Originally, the proposed
Strait, approximately 500 m offshore at the close point between           aquaculture site was 200 ha, however, it was narrowed to 50 ha
the mainland and Kukup Island. However, urban growth has led              based on these selection criteria: (i) higher water depth (> 10m,
to the halving of these villages. Since the establishment of water        as shown in Figure 3) with better turnover, (ii) short travelling
villages in the 1860s, the locals have profited from fishing and            distance from Kukup town, and (iii) enclosed within the port
staked fish farms (kelong) in Kukup Strait. In the late 1970s, the         limit to avoid obstructing the shipping lane (Figure 1). WWF
fish farming activities were upgraded to the floating cage system,          and MFFAM’s proposed aquaculture development site is a
thus increasing production and contributing to the small-scale            preliminary assessment. The outcomes of this study will be
marine aquaculture (mariculture) industry in Malaysia (Hassan,            submitted and discussed with the Department of Fisheries and
2010; Barau and Stringer, 2015; Michel and Zahler, 2015).                 local government authorities to assist with the state and federal
    Fish farming at Kukup has grown in response to the rising             Aquaculture Industrial Zone (AIZ) planning. The recently
demand for fresh seafood from the rapidly expanding                       suggested aquaculture site sits on the edge of the main transit
neighbouring cities like Johor and Singapore. What began as a             lane for international shipping through the Singapore – Melaka
fishing village of only eight farms in 1984 (Lai, 2014) has grown          Straits and is immediate to the north of the Johor and Singapore
into a town with an estimated population of 1400, with                    outer port areas. Furthermore, the area is located within the
approximately 79 fish farmers and 8,000 cages. The                         Kukup Port Limit, Sector 6 of the Straits of Malacca and
aquaculture species found in Kukup Strait include groupers                Singapore (SOMS) Vessel Traffic Information System (VTIS)
(Epinephelus sp.), snappers (Lutjanus sp.), trevallies                    and the Traffic Separation Scheme and Deepwater Route.
(Gnathanodon sp.), pompano (Trachinotus sp.) and Asian sea                Malacca Straits Sector 6 is narrow and act as an entry point to
bass (Lates calcarifer), which are sold mainly fresh at the               the Port of Tanjung Pelepas (PTP) and Singapore Straits, thus,
Singaporean markets, about an hour by boat down the                       subjected to heavy international shipping pressures. The
Malacca Straits to the south (Ismail et al., 2018). Furthermore,          Malaysian Marine Department governs the Kukup Port.
the flourishing tourism industry in Kukup since the 1980s has                  When selecting a new aquaculture site, conducting a technical
attracted local and international tourists from countries like            assessment to ensure future business profitability is critical. One
Singapore. Nevertheless, the Kukup aquaculture community                  of the main criteria of the site evaluation is water quality.
continue to face challenges in profiting solely from farming               Therefore, this study aims to analyse the suitability of a new
activities; thus, most of them have diversified their portfolio by         aquaculture site for sea cage farming offshore of Kukup within
venturing into the tourism industry, such as operating homestays          the Magellan Strait by assessing several key criteria: 1)
and seafood restaurants (Hampton, 2010).                                  hydrodynamic and meteorological conditions, 2) marine water
    Throughout the years, Kukup fish farmers constantly                    quality, and 3) marine sediment quality of existing aquaculture
experienced economic losses due to the seasonal disease                   site and the proposed site. In addition, several key factors are
outbreak associated with microbial infections due to declining            evaluated in this study, including bathymetry, wind, currents,
water quality (Jaafar et al., 2014). Moreover, Manan et al. (2011)        waves, water temperature, pH, salinity, dissolved oxygen,
reported hydrocarbon pollution resulting from oil leakage by              turbidity, ammoniacal nitrogen, particles size distribution,
tourist boats and boat repair activities in Kukup waters. Apart           redox potential, total organic carbon, hydrocarbons, heavy
from that, the high density of fish cages is a potential source of         metals and benthic biodiversity (Szuster and Albasri, 2010;
“auto pollution” caused by the accumulation of effluent from the           Radiarta et al., 2011; Leung et al., 2015; De Novaes Vianna and
two water villages, adjacent agricultural development in the              Bonetti Filho, 2018; Divu et al., 2021). The hydrodynamics and
hinterland from constructed drains to avoid flooding, and                  meteorology conditions (bathymetry, wind, currents and waves)
natural drainage from rivers and streams. In addition, earlier            are crucial in selecting a new aquaculture location (Radiarta et al.,
studies suggested that oil and grease, fecal coliforms (Escherichia       2011; Gimpel et al., 2015; Mayerle et al., 2020). A better
coli), and heavy metals (As, Cu and Hg) levels have exceeded the          knowledge of the factors listed above can help in determining
recommended limit by Malaysia Marine Water Quality Criteria               the physical impacts on the new infrastructure, structural
and Standard (MMWQS) for mariculture activities (Mohamed                  integrity, cost, operating conditions and the associated costs
et al., 2015; Fadzil et al., 2017).                                       for supporting infrastructure (vessel size, capital and
    Several solutions can be considered to improve the                    operational costs). Additionally, higher energy environments
deteriorating water quality and the consequent disease impacts            like those anticipated further offshore offer potentially
on fish farm productivity. The World Wildlife Fund (WWF), in               improved water quality due to high flushing rates enhanced
partnership with Kukup Fish Farmer Association, Malaysian                 operational conditions, and, most importantly, greater distances
Fish Farmers Association of Malaysia (MFFAM), UCSI                        from land-based pollution sources.

Frontiers in Marine Science | www.frontiersin.org                     2                                      May 2022 | Volume 9 | Article 888662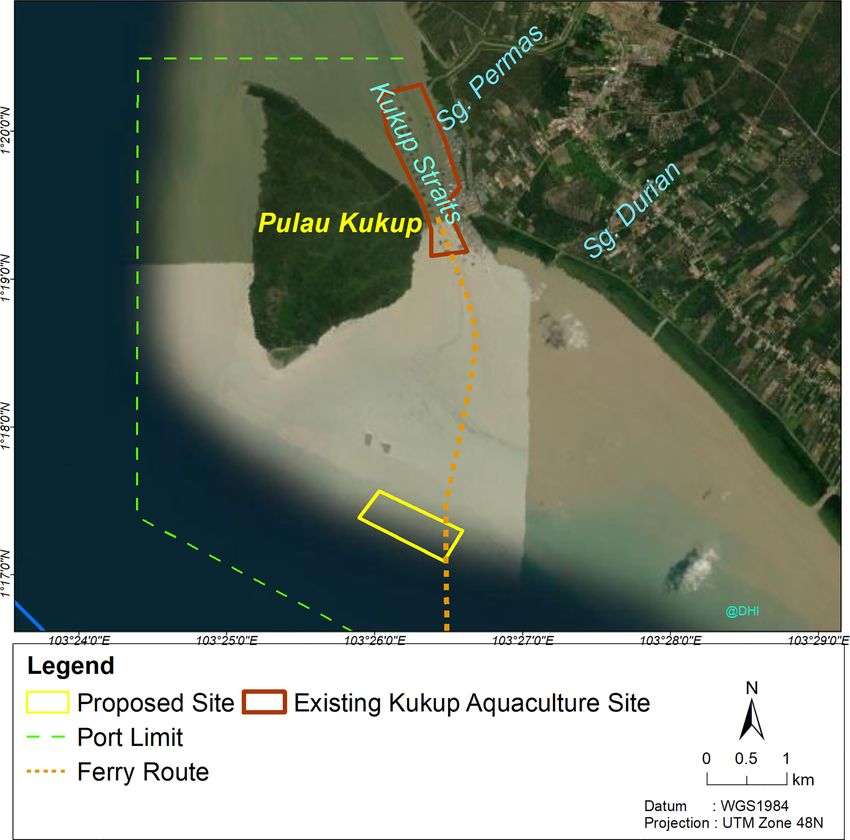
Chor et al.                                                                                                                   Mariculture Spatial Analysis in Kukup

 FIGURE 1 | Satellite image of existing Kukup aquaculture site and new proposed site.

 FIGURE 2 | Water quality and marine sediments sampling stations from the respective sources within the existing Kukup aquaculture site, new proposed
 aquaculture site and surrounding waters.

Frontiers in Marine Science | www.frontiersin.org                               3                                          May 2022 | Volume 9 | Article 888662
Chor et al.                                                                                                                      Mariculture Spatial Analysis in Kukup

                                                                             A                                                    B

 FIGURE 3 | Hydrodynamic, meteorological conditions and ship density plot of the study area: (A) extraction point of wind time series, and (B) wind speed.

2 MATERIALS AND METHODS                                                              collected at seven sites from the 17th to 18th August 2020 at
                                                                                     the locations shown in Figure 2. Ammoniacal nitrogen and
2.1 Hydrodynamics and Meteorological                                                 nitrate were measured at seven sampling sites in 2013 and 2019.
Conditions                                                                           The coordinates of the water quality (WQ, D & F) sampling
Bathymetry or seabed contour levels of the study areas were                          stations and marine sediment sampling site (P) are presented
sourced from the navigation chart MAL5129 published in April                         in Table 1.
2008. Bathymetry levels were referenced to Chart Datum (CD),
and areas with positive values or higher than 0 m CD were                            2.3 Water Quality Assessment
interpreted as the inter-tidal areas within a certain distance from                  In situ parameters were measured using an Aqua TROLL® 600
the coastline. Wind data were obtained from a global high-                           multiparameter sonde (In-situ Inc., USA) at each water quality
resolution weather model along with meteorological and                               sampling station (WQ1 - WQ9), and a YSI in situ
oceanographic information, sourced from the National Center                          multiparameter (ProQuatro, USA) was used in seven water
for Environmental Prediction, USA (NCEP) (Saha et al., 2014).                        sampling sites (P1 – P7) to quantify the water mass properties
The spatial and temporal extent of currents and waves at the                         including temperature, salinity, pH, turbidity, dissolved oxygen
proposed site were derived using results from two-dimensional                        (DO). Meanwhile, the physicochemical parameters such as the
(2D) numerical models, namely, the MIKE 21 Hydrodynamic                              redox potential (Eh) were measured using Oxidation Reduction
(HD) and Spectral Wave (SW) model (Uddin et al., 2014).                              Potential (ORP) meter (HM Digital ORP-200, Culver City, USA)
    The Climate Forecast System Reanalysis (CFSR) wind forcing                       following methods of Praveena and Aris (2013). Turbidity was
is applied in this assessment. It is a third-generation reanalysis                   not sampled in WQ1, -5, -6, and -7, due to equipment error. pH
product from a global, high resolution, coupled atmosphere-                          was not sampled at WQ6, and dissolved oxygen (DO) was not
ocean-land surface-sea ice modelling system, sourced from the                        sampled at WQ2 due to the unstable sea conditions.
National Centers for Environmental Prediction (NCEP), USA.                           Ammoniacal nitrogen and nitrate at D-2, -3 and -4 were
The data from 2010 to 2019 are supplied in one-hour intervals,                       sourced from DHI’s internal database (unpublished data),
at the height of 10 m above mean sea level. The spatial resolution                   while F-1, -2 and -3 were measured using Horiba compact
of the CFSR was set in the order of 0.20° by 0.20°. Typical                          meters (LAQUAtwin, Japan).
northeast (NE) monsoon, southwest (SW) monsoon and inter-
monsoon current flow conditions of the study area were                                2.4 Extraction of Seabed Sediment
predicted using the MIKE 21 HD FM (flexible mesh)                                     Macrobenthos sampling was conducted at seven sites (P-1, -2, -3,
hydrodynamic model. Simulation periods were selected as                              -4, -5, -6, and -7) from 17th to 18th August 2020 by Universiti
February (NE monsoon), April (inter-monsoon) and July (SW                            Teknologi MARA (UiTM) A&A Laboratory. Before the sampling
monsoon) 2017 and each simulation includes 28 days for spring-                       process was conducted, the site coordinates were obtained using
neap tidal cycle. The model applied boundary conditions driven                       a Global Positioning System (GPS) application, while the water
by a large regional domain, including seasonal variations and                        depth was recorded using a portable echo sounder (SM5, Laylin
CFSR spatial wind maps as the key wind forcing. The ship wakes                       Associates, Unionville, VA). Then, samples for the quantitative
analysis and simulations for various vessels, sailing routes, and                    determination of the chemical composition and macrobenthos
potential ship wakes generated are sourced from DHI in-house                         were initiated using the sampling device known as a Petite Ponar
assessments (unpublished data).                                                      Grabber (Wildco®, Yulee, FL), with a sampling area of 152 x 152
                                                                                     mm (6 x 6”) (Wang et al., 2013). The water depth of sampling
2.2 Sampling Site Description                                                        sites ranged from 2.3 m to 24.6 m. One sub-sample was extracted
A field expedition was conducted on 9th August 2020 to sample                         for chemical composition analysis, while sampling was done in
ambient water at eight stations, while marine sediment was                           triplicates (P1 - P7) to estimate the macrobenthos diversity. The

Frontiers in Marine Science | www.frontiersin.org                                4                                            May 2022 | Volume 9 | Article 888662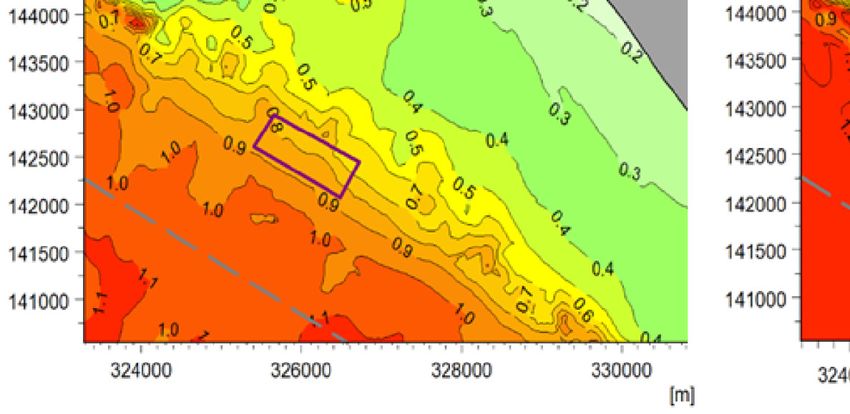
Chor et al.                                                                                                                     Mariculture Spatial Analysis in Kukup

TABLE 1 | Coordinates of 16 sampling sites for water quality and marine sediments assessment in degrees-minutes-seconds (DMS).

Sampling sites                           Descriptions                                                                     Coordinates

WQ1                              Existing site (straits of Kukup)                                              N 1°20’17.934’’ E 103°26’19.5144’’
WQ2                              At the edge of proposed site                                                  N 1°17’42.4716’’ E 103°26’8.034’’
WQ3                              Within proposed site                                                          N 1°17’15.7632’’ E 103°25’49.7676’’
WQ5                              Existing site (straits of Kukup)                                              N 1°18’40.8024’’ E 103°26’38.166’’
WQ6                              At the edge of proposed site                                                  N 1°17’21.462’’ E 103°27’16.3836’’
WQ7                              Existing site (straits of Kukup)                                              N 1°19’45.2568’’ E 103°26’16.098’’
WQ8                              Within proposed site                                                          N 1°17’32.0136’’ E 103°26’2.6952’’
WQ9                              Within proposed site                                                          N 1°17’15.4248’’ E 103°26’31.1244’’
P1                               Existing site (straits of Kukup)                                              N 1°20’11.4” E 103°26’08.6”
P2                               At the edge of proposed site                                                  N 1°17’42.5” E 103°26’08.0”
P3                               Within proposed site                                                          N 1°17’28.4” E 103°26’02.3”
P4                               Within proposed site                                                          N 1°17’17.3” E 103°26’28.5”
P5                               At the edge of proposed site                                                  N 1°16’57.0” E 103°26’54.4”
P6                               At the edge of proposed site                                                  N 1°17’22.6” E 103°27’15.4”
P7                               At the edge of proposed site                                                  N 1°17’36.6” E 103°26’39.1”
D2                               At the east of proposed site                                                  N 1°16’46.7” E 103°28’05.3”
D3                               Existing site (straits of Kukup)                                              N 1°20’10.8” E 103°26’09.1”
D4                               Existing site (straits of Kukup)                                              N 1°19’06.7” E 103°26’31.2”
F1                               Existing site (straits of Kukup)                                              N 1˚19’59.7” E 103˚26’0.95”
F2                               At the edge of proposed site                                                  N 1°17’29.45” E 103°25’54.93”
F3                               Existing site (straits of Kukup)                                              N 1°19’07.9” E 103°26’35.3”
F4                               At the edge of proposed site                                                  N 1°17’57.05” E 103°25’58.47”

weight of each sample is around 1 kg, and the extracted                                   for the second pipetting procedure was determined using the soil
sediments were deposited in resealable plastic bags and                                   settling chart. After that, the empty beaker was weighed (W3),
preserved with 500 ml of 8% formalin. Then, the samples were                              and the pipetted clay was placed in the beaker. The beaker was
transported to the laboratory in a sealed cooling box with ice                            oven-dried overnight at 105°C and weighed (W4). A total of 200
packs for further analysis.                                                               ml of sample was kept while the remaining sample was
                                                                                          discarded. Then, the collected sample was transferred into a
2.5 Marine Sediment Evaluation                                                            weighed 1 L beaker (W5) and added with distilled water. The
2.5.1 Particle Size Distribution (PSD)                                                    settling process was repeated several times until the sample
The particle size distribution was analyzed following the United                          solution became clear. Next, the sample solution was poured
States Department of Agriculture-Natural Resources                                        into the sink until 50-mL of the sample was left. The collected
Conservation Service (USDA-NRCS) Soil Taxonomy (United                                    sample was oven-dried overnight at 105°C and weighed (W6).
States Department of Agriculture-Natural Resources                                        Lastly, the final percentage of silt, clay and sand were calculated,
C o n s e r v a t i o n S e r v i c e ( U S D A - N R C S ) , 20 1 8) . F i r s t ,       and the types of sediments were determined using the USDA soil
approximately 20 g of air-dried sediment sample was filtered                               texture pyramid and the following formulas (United States
using a 2.0 mm sieve, weighed and recorded. Next, 30%                                     Department of Agriculture-Natural Resources Conservation
hydrogen peroxide (H2O2) was added to the sample to remove                                Service (USDA-NRCS), 2018).
organic matter and dispersing reagent. After that, 4% sodium
hexametaphosphate was added to prevent the flocculation of                                                                 ðW2Þ − ðW1Þ
                                                                                                        % silt clay =                   100
sediment particles. The treated sample was then transferred to a                                                         sample weight
1 L measuring cylinder, and distilled water was added to make a
total volume of 1 L.                                                                                                     ðW4Þ − ðW3Þ
   The sample in the measuring cylinder was mixed vigorously                                              % clay =                     100
                                                                                                                        sample weight
with a plunger for 30 s. Then, clay and silt pipetted out after 46 s
at a depth of 20 cm. A soil sedimentation chart was used to
                                                                                                                         ðW6Þ − ðW5Þ
determine the time required to pipette out the clay and silt                                              % sand =                     100
samples. Later, the weight of an empty beaker was recorded (W1)                                                         sample weight
before pipetting the sample to be oven-dried overnight at 105°C.
The sample was weighed and recorded (W2) the next day. In                                                % silt = 100 − ð% sand + % clayÞ
addition, the sample temperature was measured, and the depth

Frontiers in Marine Science | www.frontiersin.org                                     5                                      May 2022 | Volume 9 | Article 888662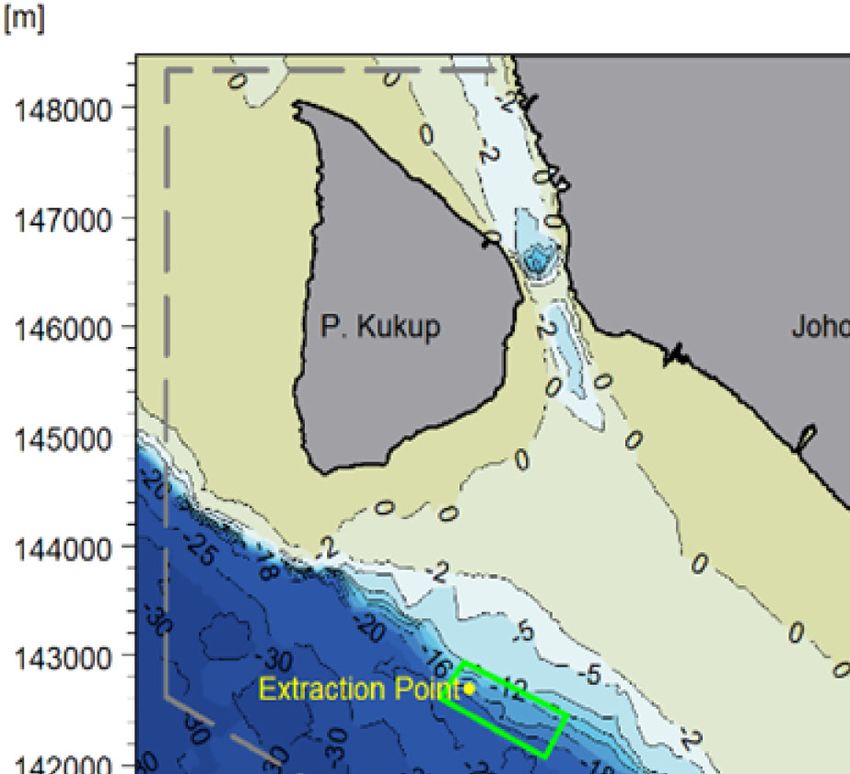
Chor et al.                                                                                                   Mariculture Spatial Analysis in Kukup

2.5.2 Total Organic Carbon (TOC)                                          the United States Environmental Protection Agency Soxhlet
The total organic carbon (TOC) measures the organic matter                Extraction (USEPA) method 3540 (Solid) (Guerin, 1999).
content via the Walkley and Black Titration method (Walkley               Before the drying process, the water layer in the sediment
and Black, 1934). First, the sample was dried at 35°C and filtered         sample was decanted and discarded. In addition, foreign
using a 0.15 mm mesh sieve. A total of 0.5 g sample was weighed           objects such as sticks, leaves, and rocks were removed, and the
and transferred to a 500 mL conical flask, and 10 mL of 0.1667 M           sample was mixed thoroughly. A total of 10 g sample was
potassium dichromate solution (K2Cr2O7) was added to the                  weighed and placed into a tared crucible and subjected to
sample. Then, 20 mL of concentrated sulphuric acid was                    drying overnight at 105°C. The dried sample was weighed after
cautiously added to the sample and swirled for 30 s, followed             cooling to room temperature. The dry weight (%) was calculated
by 200 mL deionised water after the sample had cooled to room             using the following formula (Guerin, 1999):
temperature. The sample was allowed to sit for 30 min before the
suspension was filtered. Next, three to four drops of ferroin                                                 dry sample ð g Þ
                                                                                % dry weigh samples =                          100
indicator were added to the filtrate. Finally, the excess                                                   sample weight ð g Þ
dichromate was titrated using 0.5 M standard ferrous
ammonium sulphate solution (FAS). The colour change at the                A total of 10 g of solid sample with 10 g of anhydrous sodium
endpoint was observed from blue-green to a reddish hue. Total             sulphate were blended and placed in an extraction thimble. Then,
organic carbon is calculated using the following formula                  1 ml of surrogate standard spiking solution and matrix spiking
(Walkley and Black, 1934):                                                standard were added to the selected samples. Next, a 300 mL
                                                                          extraction solvent (Acetone/Hexane at 1:1) was added to a 500
                                   ðB − AÞð0:3ÞðMaÞ                       ml round bottom flask containing two cleaning chips. The flask
                  TOC ð%Þ =
                                 weight of dry sample                     was attached to the Soxhlet extractor, and the samples were
                                                                          extracted for 16 h at 4 - 6 cycles/h. Then, the extracted samples
Where, B = blank titre (mL), A = sample titre (mL) and Ma =               were allowed to cool. A Kuderna-Danish (K-D) concentrator was
concentration of FAS                                                      assembled by attaching a 10 mL concentrator tube to a 500 ml
                                                                          evaporation flask. The solvent vapour-recovery glassware
2.5.3 Oil and Grease                                                      (condenser and collection device) was attached to the Snyder
The oil and grease (OG) content in sediment was analysed                  column of the K-D apparatus following the manufacturer’s
according to the American Public Health Association (APHA                 instructions. The extract was dried by passing it through a
et al., 1912) -5520B (partition gravimetric) method (Baird et al.,        drying column containing about 10 cm of anhydrous sodium
2017). First, a wet sludge sample was taken from a 1 L wide               sulphate, and the dried extract was later collected. The
mouth glass bottle, and 1 mL concentrated hydrochloric acid (1:1          concentrator flask and sodium sulphate column were washed
HCL) per 80 g sample was added and acidified to pH 2.0 or                  with 100 to 125 ml extraction solvent to complete the
lower. Approximately 20 ± 0.5 g of the acidified sample was                quantitative transfer. Subsequently, two clean boiling chips
weighed (W1) and placed into a beaker. Then, 25 g of                      were added to the flask, and a three-ball Synder column was
magnesium sulphate monohydrate (MgSO4.H2O) was added to                   attached. Methylene chloride (1 ml) was added to the top of the
dry the sample. After the sample had solidified (15 to 30 min),            Synder column. The K-D apparatus was placed on a hot water
the sample was ground into powder form using a porcelain                  bath, and the temperature was set to 15 – 20°C above the solvent
mortar. A total of 100 mL n-hexane was added, and the sample              boiling point. The concentrator tube was partially immersed in
was transferred to a separator funnel. The sample was shaken              hot water, and the entire lower rounded surface of the flask was
vigorously for 2 min to achieve layer separation. Next, the solvent       bathed with hot vapour. The vertical position was adjusted to
layer was drained through a funnel containing a filter paper               complete the concentration within 10 - 20 min. In the end, the K-
(Whatman No 40). Then, the extracts were filtered and                      D apparatus was removed from the water bath when the clear
combined into the same distilling flask. Later, the solvent from           liquid reached 1 and later drained and cooled for at least 10 min.
the flask was distilled in a water bath at 85°C for 15 min, cooled             The PAH determination was done according to the USEPA
in a desiccator for at least 30 min and weighed (W2). Finally, the        8100 method using the gas chromatography (GC) solvent flush
extracted oil and grease were calculated using the following              technique. At the same time, compounds in the GC effluents
formula (APHA et al., 1912):                                              were detected by the Flame Ionisation Detector (FID) (Agilent
                                                                          7890A gas chromatography, Agilent Technologies, USA)
                                     ðW2 − W1Þx1000000                    (Adeniji et al., 2018). The column used for the analysis was a
                O Gðmg=kg Þ =
                                      Sample weight ð g Þ                 30 m x 0.32 mm I.D. (inner diameter) SE-54 fused silica capillary
                                                                          column. The PAH separation via gas chromatography was as
Where W2 = final weight and W1 = initial weight.                           follows: oven temperature program was 40 °C held for 1 min,
                                                                          then increased at 15 °C min-1 and 150 °C for 10 min. Meanwhile,
2.5.4 Polynuclear Aromatic Hydrocarbon and Total                          the injector and detector temperature were 250 °C. The injection
Petroleum Hydrocarbon                                                     volume was 1 μL in the splitless mode, keeping the split valve
Polynuclear aromatic hydrocarbon (PAH) and total petroleum                closed for 1 min. Finally, the PAH was quantified using Agilent
hydrocarbon (TPH) of the marine sediment were extracted using             ChemStation software (HPLADD01.EXE ver. 4.03.016).

Frontiers in Marine Science | www.frontiersin.org                     6                                    May 2022 | Volume 9 | Article 888662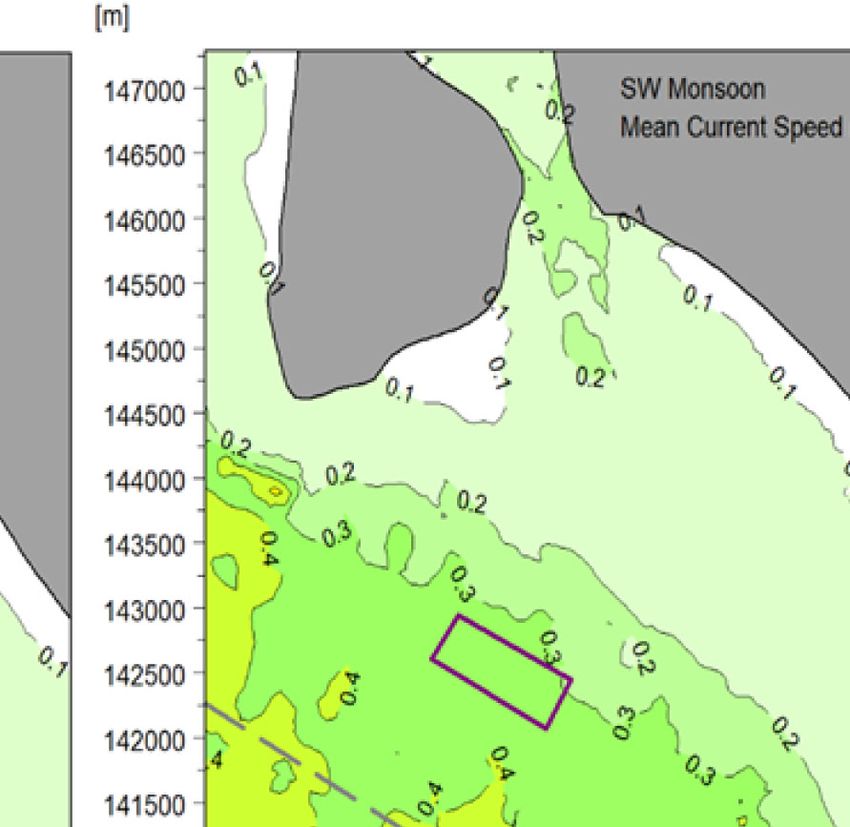
Chor et al. Mariculture Spatial Analysis in Kukup
The determination of sample TPH via the separation method light pink and preserved in formalin for more than 24 h to
was conducted using the total petroleum hydrocarbon USEPA facilitate detritus sorting (Schönfeld et al., 2013). Finally, the
8015D since the technique provides gas chromatographic number of taxa (S), total number of individuals (N), diversity
conditions for detecting certain non-halogenated volatile and index (H’), dominance index (D), richness index (DMg) and
semi-volatile organic compounds (Cortes et al., 2012). The evenness index (J’) were calculated using the following formula:
column was a 30 m x 0.32 mm I.D. SE-54 fused silica capillary Shannon-wiener index (H’) (Shannon and Weaver, 1949),
column. Gas chromatographic conditions used for separating Dominance index (D) (Simpson, 1949), Margalef’s richness
TPH was set at 40 °C for 2 min, then increased to 10 °C for 1 min index (DMg) (Margalef, 1958), and Pielou’s evenness index (J’)
and 300 °C for 10 min. The injector and detector temperature (Pielou, 1966).
were set at 250 °C. The injection volume was 1 μL in the splitless
ni ni
mode, keeping the split valve closed for 1 min. Lastly, the TPH Shannon − Wiener index H 0 : H0 = os ½( )ln( )
was quantified using the Agilent ChemStation software. n n
2.5.5 Heavy Metals Dominance index ðD = 1 − Simpson indexÞ : D
Heavy metals composition was measured using the USEPA
= ½1 − o
method 1311 toxicity characteristic leaching procedure (TCLP) nð n − 1 Þ
(US Environmental Protection Agency, 1992). Two different N ðN − 1Þ
buffered acidic leaching extraction fluids were utilised for this
procedure depending on the pH value of the sediment samples. ðS − 1 Þ
As described in TCLP, extraction fluid 1 (± pH 4.93) was used for Margalef 0 s richness index : DMg =
lnðnÞ
sediment samples with a pH < 5, while extraction fluid 2 (± pH
2.88) was used for sediment samples with a pH of > 5. First,
extraction fluid 1 was prepared by adding 5.7 mL glacial acetic H0
Pielou0 s evenness index : J 0 = , H 0 max = ln ðSÞ
acid (CH3CH2OOH) to 500 mL reagent water. Then, 64.3 mL 1 H}max
N sodium hydroxide (NaOH) was added to the mixture and
diluted with reagent water to a volume of 1 L. Meanwhile, 2.7 Statistical Analysis
extraction fluid 2 was prepared by diluting 5.7 mL of glacial Water quality data at different sampling sites were subjected to
acetic acid was diluted with reagent water to a volume of 1 L. The normality and homogeneity-of-variance tests, and analysed
final pH of Solution 1 and 2 were 4.93 and 2.88, respectively. All using the Kruskal Wallis non-parametric one-way ANOVA to
reagents used in the TCLP test were made from ACS (American compare each sample, while a difference in means was
Chemical Society) reagent grade. determined using Dunn’s multiple comparisons post hoc test
Extracts or portions of extracts for metallic analysis were with Bonferroni adjustment to obtain significance difference of
acidified with nitric acid to a pH of < 2. An aliquot of 2 g of each water quality parameters among sampling sites. In all cases, the
sample and 40 mL extraction reagent was transferred into 100 significant difference is denoted when p < 0.05. The statistical
mL plastic vessels and rotated for 18 h in a horizontal shaking analyses were conducted using the IBM Statistical Package for
mixer with a speed of 30 ± 2 rpm. The room temperature was the Social Sciences (SPSS) software version 20.
maintained at 23 ± 2°C throughout the extraction process. After
18 h, the fluid in each vessel was separated from the solid phase
by vacuum-filtration through 0.8 μm borosilicate glass fibre filter
paper. Both primary and secondary extract fluids were used. The 3 RESULTS
concentrations of heavy metals in extracts produced by TCLP
were determined using flame atomic absorption spectrometry 3.1 Hydrodynamics and Meteorology
(FAAS) (Sun et al., 2006). Conditions
The bathymetry map shows that the proposed site has a depth
2.6 Benthic Biodiversity Analysis between -10 and -20 m CD, with deeper contours toward the
Benthic biodiversity analysis was conducted according to Musale offshore. The proposed aquaculture site (in green) is located
and Desai (2011). First, the sediment samples were sieved (mesh within the Kukup Port Limit (grey dash) (Figure 1). The data
size: 0.25 mm) to separate the benthic organisms from the obtained from the navigation chart is useful to provide a
sediment and organisms before they were identified under the preliminary estimate of the proposed area. The Kukup Strait is
microscope (OMAX™ stereomicroscope, USA) at 10 – 40 × a narrow channel between Kukup Island and the mainland,
magnification. Next, the organisms were classified into where the existing aquaculture site is located. The depth of the
taxonomic categories to the family level using six identification approaching entrances of the strait is around -2 m CD with a
keys (Day, 1968; Sterrer, 1986; Blake, 1994; Miner, 2006; particularly deep spot about -23 m CD at the narrowest part of
Eleftheriou and Moore, 2013; Gill, 2019). Then, these the strait, resulting from the high-speed current that led
organisms were filtered from the sediment and placed on a to scouring.
white tray filled with water for the sorting process. Next, the A wind speed and direction time series from 2010 to 2019 (10
organisms were stained with 200 mg/L rose bengal to achieve a years) at a location within the proposed aquaculture study area were
Frontiers in Marine Science | www.frontiersin.org 7 May 2022 | Volume 9 | Article 888662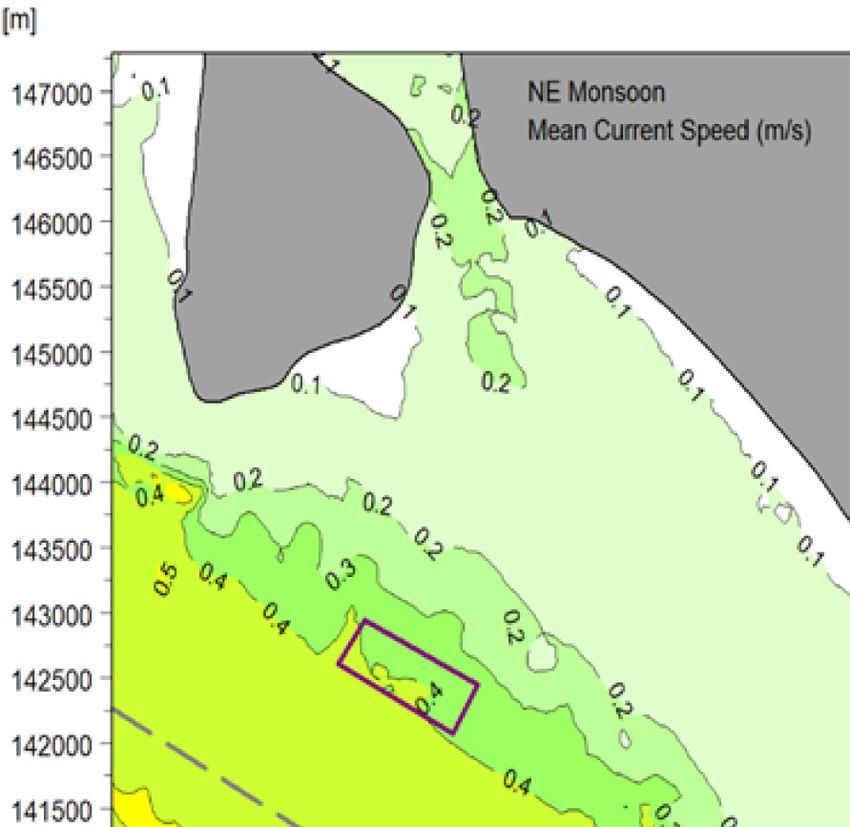
Chor et al. Mariculture Spatial Analysis in Kukup
obtained from the CFSR database (103°26’3.52”E, 1°17’26.03”N) The significant wave heights and peak wave periods at the study
(Figure 3A). Meanwhile, the wind rose generated from the 10-year area are less than 0.6 m and 4 s, respectively. Meanwhile, the
time series is presented in Figure 3B. The predominant wind highest significant wave heights are expected to be < 3.0 m.
directions were from the northeast (NE) and southeast (SE), and
the highest predicted wind speed during the extraction period is 9.5
m/s. The ship density plot, Kukup Port Limit and the marine traffic 3.2 Water Quality
separation scheme are shown in Figure 1. The water temperature of the existing aquaculture site ranged from
The current flow at the proposed site is predominantly toward 29.3 to 30.2°C. This narrow range is considered typical of coastal
the northwest (NW) and SE, which are aligned with the waters, reflecting the tropical climate in Malaysia. Furthermore, the
mainland coastline. Generally, the current flows towards 300°N pH value ranged between 6.7 and 7.8, while the salinity ranged
during ebb tide and 120°N during flood tide. The current speed from 23.6 to 29.9 psu. The recorded DO values were between 5.5
increases as the tide move onshore to offshore into deeper waters. and 6.0 mg/L (Table 2). The data collected between 2013 and 2019
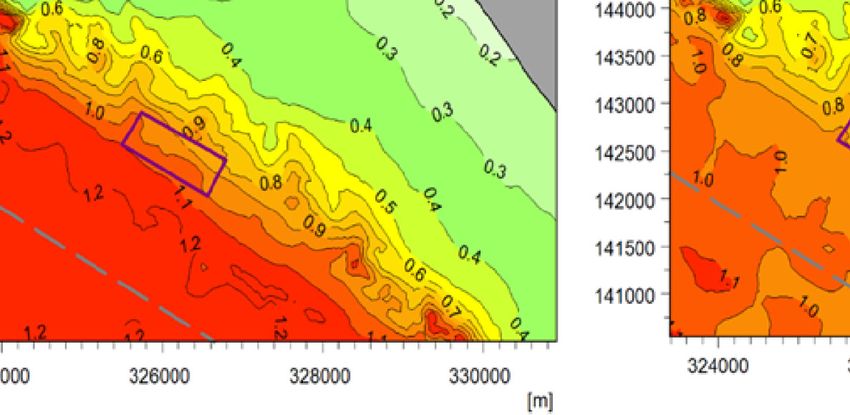
The mean and maximum currents calculated throughout the 28 demonstrated that ammoniacal nitrogen concentrations ranged
days for each monsoon are shown in Figure 4A and Figure 4B, between 3 and 179 μg/L, exceeding the MMWQS Class 2 limit of 50
respectively. The predicted mean current speed at the new site μg/L. Similarly, nitrate concentrations were also high, with a
are between 0.3 - 0.4 m/s (in deeper waters), while the maximum maximum concentration of 383 μg/L.
current speed ranges between 0.7 - 1.1 m/s. Nevertheless, it was The water temperature at the proposed site ranged between
noted that the values represent typical conditions and do not 29.4 and 30.2°C. The pH value ranged between 6.3 and 8.0,
include extreme conditions that the latter will be required whereas the salinity was between 27.0 and 30.2 psu. The recorded
forinfrastructure design purposes. DO ranged from 5.1 to 6.5 mg/L, while the turbidity ranged
The wave conditions at the new site are primarily wind- between 2.5 and 7.3 NTU (Table 2). Meanwhile, the ammoniacal
generated waves. Wind waves, also known as wind sea, is nitrogen ranged between 2 - 79 μg/L, slightly exceeding
induced by immediate local wind blowing on the water surface. MMWQS Class 2. Apart from that, ammoniacal nitrogen
These waves are of a high frequency (2 – 7 s) and can present as concentrations were much lower compared to the existing
short steep seas that rise quickly with increased wind speed. In Kukup aquaculture site. However, the maximum nitrate
contrast, swell waves are generated from remote weather systems concentration (330 μg/L) was approximately five times higher
with a longer frequency and are hardly affected by local winds. than the MMWQS Class 2 limit of 60 μg/L.
A
B
FIGURE 4 | Mean (A) and maximum (B) current speeds calculated from 28-day simulation results of a typical NE monsoon (left), SW monsoon (middle), and inter-
monsoon (right).
Frontiers in Marine Science | www.frontiersin.org 8 May 2022 | Volume 9 | Article 888662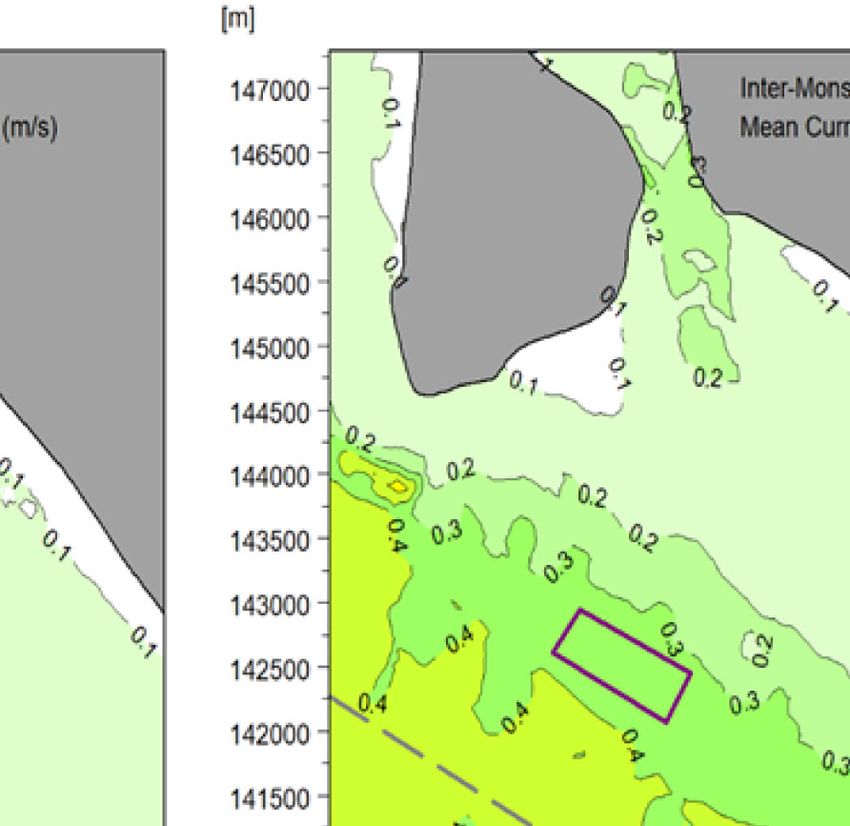
Chor et al.                                                                                                                                                        Mariculture Spatial Analysis in Kukup

TABLE 2 | Physio-chemical properties of water sampling sites (existing and proposed site) at Kukup Strait, Johor, Malaysia.

Parameters                                                                                                 Sampling points

                                      WQ1                WQ2                     WQ3                     WQ5                     WQ6                    WQ7               WQ8              WQ9

Temperature (°C)                  30.2± 0.01a         30.2± 0.01a             29.7± 0.06c             29.6± 0.09c             30.2± 0.24c         29.3± 0.05d         29.8± 0.04b       29.8± 0.07b
                                                de                 d                       b                       e                                           e                    c
pH                                  7.8± 0.00          7.9± 0.01               8.0± 0.02               7.8± 0.08                  NA               7.8± 0.01            7.9± 0.02        8.0± 0.01a
                                                d                  b                       b                       d                       a                   d                    c
Salinity (psu)                    29.9± 0.01          30.1± 0.02              30.1± 0.02              28.4± 1.95              30.2± 0.03          28.5± 0.04          30.1± 0.01        30.2± 0.01a
                                                d                                          b                       d                       c                   d                    a
Dissolved oxygen (mg/L)             6.0± 0.01              NA                  6.5± 0.04               5.7± 0.38               6.2± 0.26           5.5± 0.05            6.5± 0.08        6.5± 0.46b
                                                                   a                       d                                                                                        b
Turbidity (NTU)                         NA             7.3± 3.12               2.5± 0.30                  NA                      NA                    NA              3.1± 0.65        2.7± 0.56c
                                             P1                        P2                      P3                      P4                         P5                       P6               P7
Temperature (°C)                             29.4                      29.4                    29.5                    29.5                      29.6                     29.5             29.5
pH                                           6.7                       6.5                     6.4                     6.4                        6.5                      6.3              6.4
Salinity (psu)                               23.6                      27.0                    27.1                    27.3                      27.7                     27.6             27.3
Dissolved oxygen (mg/L)                      NA                        5.4                     5.1                     5.6                        5.7                      5.7              5.7
                                           D2                       D3                      D4                    F1                              F2                      F3                  F4
Ammoniacal Nitrogen (µg/L)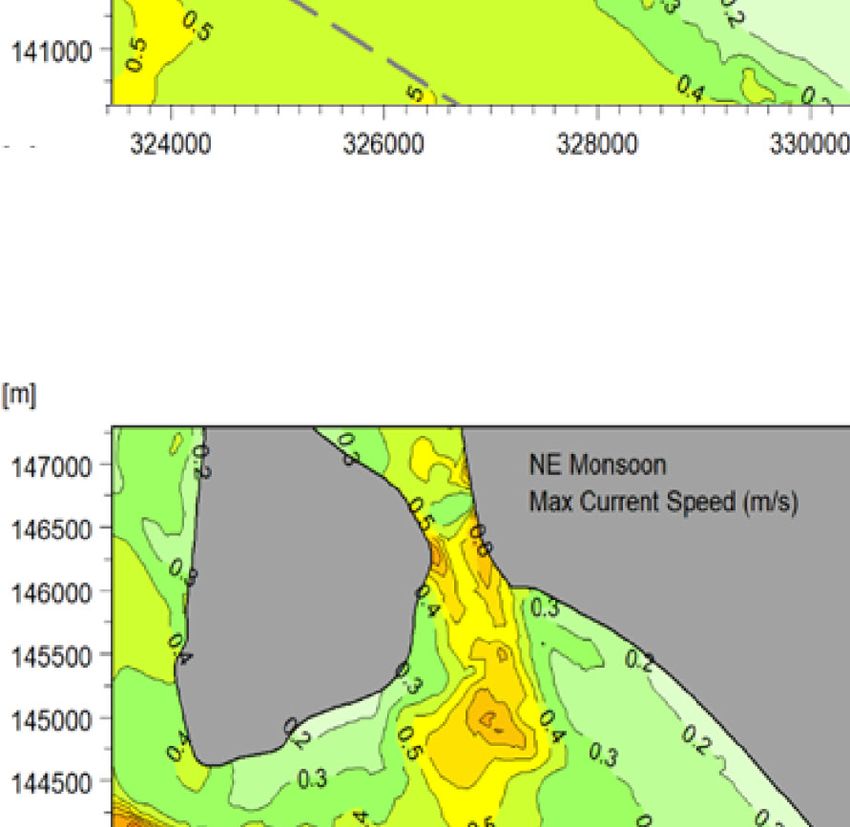
Chor et al.                                                                                                                  Mariculture Spatial Analysis in Kukup

                                     A

                                      B

 FIGURE 5 | Composition of (A) particle size distribution, (B) polychaetae, mollusk and crustacean (P1-P7).

   During the NE monsoon (usually in November to March), the                          increased abrasion between the net and its supporting structures. In
average wind speed of the west coast of Peninsular Malaysia is                        addition, the wind may also damage the bird net protection and
around 2.57 – 5.14 m/s, reaching up to 12.86 m/sfor short periods.                    affect the stability of their supports.
Conversely, the southwest (SW) monsoon (May-September) bring                              Furthermore, operators are susceptible to accidents in rough
about intense solar heating, leading to high temperature over the                     weather conditions while moving on the vessel deck or net cage.
Asian landmass as hot air expands and rises upward, creating a                        Moreover, strong wind and high waves will increase the likelihood of
semi-permanent low-pressure area. Typically, the wind speed is                        fish escaping through structural damage or holes in the net (Yang
5.14 m/s but could reach up to 7.72 – 10.28 m/s in northern parts of                  et al., 2020). On the other hand, swell waves around the proposed site
the west coast (Binti Sa’adin et al., 2016). In the transition period                 are expected to be minimal due to the relatively short fetch because of
between the monsoons, commonly known as the inter-monsoon                             wind direction and low wind strengths (Abankwa et al., 2015). The
(April and October), the winds are often mild and omnidirectional.                    ships reported in Sector 6 are government vessels, tug, ferry, fishing
However, the CFSR data are unlikely to fully resolve the Sumatra                      vessels, general cargo, tanker vessels, VLCC, bulk carrier, container
squalls (a phenomenon for high intensity, short duration winds in                     vessel, and RoRo. A plot of ship density is shown in Figure 3C that
the region) with wind speeds reaching up to 30 m/s. The Sumatra                       reflects the movement of some 100 000 ship passages annually. Based
Squall is characterised by intense, local, gusty surface winds, usually               on the previous assessment, the predicted maximum wake waves
accompanied by heavy rain over Peninsular Malaysia that lasts for                     height generated by high-speed ferry transit at an average speed of
1 to 2 h, occurring in June, July and August. In this study,                          10.28 m/s from and to Kukup will generate wakes of up to 0.6 m and
meteorological results indicate that the average wind speed in the                    induce large waves of up to 1.0 m at the proposed site. Ship wakes are
study area is maintained at the Beaufort wind scale of ≤ 5, where                     formed downstream of a moving object such as ships or vessels and
the is wind speed = 8 – 11 m/s, maximum wave height = 2.5 m/s.                        can contribute to the small period waves at the proposed aquaculture
The exposed farming equipment is influenced by wind due to the                         site, although this needs further documentation.

Frontiers in Marine Science | www.frontiersin.org                                10                                       May 2022 | Volume 9 | Article 888662
Chor et al. Mariculture Spatial Analysis in Kukup
TABLE 3 | Physical properties of marine sediment sampling sites (existing site and proposed site) at straits of Kukup Straits, Johor, Malaysia.
Parameters Marine sediment
P1 P2 P3 P4 P5 P6 P7
Depth (m) 2.3 10.9 17.9 24.6 21.2 17.6 7.5
Redox potential (mV) -196 -136 -137 -136 -138 -135 -138
Particle Size Distribution (Type of Sediment) Silt Silt Silt Silt Silt Silt Silt
Silt (%) 95.13 95.07 95.84 95.46 95.23 96.48 96.39
Clay (%) 0.49 0.62 0.53 0.52 0.61 0.32 0.31
Sand (%) 4.38 4.31 3.63 4.02 4.16 3.21 3.30
Total Organic Carbon (%) 1.9 1.0 5.2 1.2 4.4 2.2 9.6
Hydrocarbons
Oil & Grease (mg/kg)Chor et al. Mariculture Spatial Analysis in Kukup TABLE 5 | Summary of the biological parameters of the macrobenthos communities: mean number of taxa, individuals and Shannon Diversity Index Macrobenthos P1 P2 P3 P4 P5 P6 P7 Polychaetae Cirratulidae (S) 0 6 0 0 0 0 0 Ampharetidae (S) 0 0 0 0 1 0 0 Terebellidae (S) 0 2 0 0 1 1 1 Trichobranchidae (S) 0 1 0 0 4 3 0 Spionidae (S) 0 3 0 0 1 2 4 Poecilochaetidae (S) 0 2 0 0 0 0 0 Aphroditidae (E) 0 0 0 0 1 0 0 Glyceridae (E) 0 0 0 0 2 0 0 Goniadidae (E) 0 3 2 1 0 0 0 Nephtyidae (E) 2 5 0 1 0 1 0 Nereididae (E) 0 8 1 0 2 2 1 Hesionidae (E) 0 4 0 0 0 1 1 Pilargidae (E) 0 3 0 0 0 0 0 Lumbrineridae (E) 8 0 1 0 3 1 1 Onuphidae (E) 0 0 0 0 2 0 0 Capitellidae (S) 2 11 0 15 7 9 7 Ophellidae (S) 0 0 0 0 2 4 1 Scalibregmatidae (S) 1 0 0 1 0 0 1 Orbiniidae (S) 0 2 0 0 0 1 1 Paraonidae (S) 0 4 1 0 0 2 1 Cossuridae (S) 1 0 0 0 0 0 1 Sub-total 14 54 5 18 26 27 20 Mollusk Gastropodes 8 2 3 3 2 0 0 Bivalves 3 7 5 1 5 0 4 Sub-total 11 9 8 4 7 0 4 Crustacea Amphipods 0 7 1 0 1 6 11 Tanaidacae 6 3 0 0 2 11 80 Decapods 0 2 1 1 0 2 0 Isopoda 0 0 0 0 0 1 2 Euphasia/krill 1 0 0 0 0 0 0 Roundworm 4 17 2 2 0 3 5 Peanutworm 0 11 0 1 0 1 1 Ophiuroidae (Brittle star) 0 8 5 4 3 1 2 Unknown 0 0 0 0 1 1 2 Sub-total 11 48 9 8 7 26 10 Total no of individual 36 111 22 30 40 53 127 Grand total 419 Diversity index P1 P2 P3 P4 P5 P6 P7 Taxa (S) 6.33 ± 0.94 14.00 ± 4.24 5.00 ± 1.63 5.33 ± 2.49 9.67 ± 3.09 10.00 ± 2.94 11.33 ± 2.49 Individuals 12.67 ± 3.09 37.33 ± 19.69 7.33 ± 1.70 10.00 ± 2.16 13.33 ± 3.30 17.67 ± 3.85 43.33 ± 28.05 Density (ind/m2) 550 ± 134 1623 ± 856 318 ± 74 434 ± 94 580 ± 143 768 ± 168 1884 ± 1220 Shannon-Wiener (H) 1.75 ± 0.15 2.36 ± 0.39 1.44 ± 0.34 1.35 ± 0.58 2.15 ± 0.31 2.08 ± 0.31 1.67 ± 0.57 Evenness Index (J) 0.92 ± 0.03 0.80 ± 0.02 0.90 ± 0.07 0.84 ± 0.04 0.93 ± 0.02 0.84 ± 0.03 0.54 ± 0.23 Richness index (DMg) 2.13 ± 0.38 3.69 ± 0.64 1.97 ± 0.61 1.86 ± 1.00 3.31 ± 0.86 3.11 ± 0.81 2.94 ± 0.82 For the polychaetes (E), errantia and (S), sedentaria groups. Currents act as additional drag force on the mooring system 4.2 Water Quality and simultaneously apply wave force on the anchor The existing aquaculture site in Kukup Straits showed the lowest components. High current speeds will wash out the feed salinity recorded in this study (P1) at 23.6 psu. Sampling sites from the cages before fully- consumed, thus, increasing feed (WQ7 and P1) are located adjacent to the mouth of the Permas use and lowering the feed conversion ratio (FCR). The current river; thus, lower salinity is expected at these sites. Even though force could be reduced by increasing the mooring lines at the the turbidity at the existing site was not measured in the present cage centre and positioning the short side of the grid against study, the National Coastal Erosion Study in 2015 reported a the incoming current (Purnawanti et al., 2018). Overall, the high coastal erosion rate (18.32 m/year) at the western and degree of wind exposures, current speeds, water depths, wave southern shores of Kukup Island (DID, 2015). In addition, heights and wave periods of the new proposed site is within the Philipose et al. (2012) reported that weight gain of sea bass HDPE cages limit with a life span of around 15 – 20 years. (Lates calcarifer) - one of the fish species cultured in Kukup Frontiers in Marine Science | www.frontiersin.org 12 May 2022 | Volume 9 | Article 888662
Chor et al.                                                                                                    Mariculture Spatial Analysis in Kukup

Straits, is optimal when the ambient water temperature is 32.5°C.           the seafloor around Kukup Island consists mainly of quartz and
The low DO values in this site indicated the high biochemical               kaolinite in sediments, while the highest oxide element in
oxygen demand (BOD) of cultured fish in the aquaculture farms                sediments is silicon dioxide (SiO2). The redox potential of
and the bacterial nitrification processes of fish faeces. Healthy             marine systems is a measure of electrochemical potential or
fish require high DO, and the recommended threshold is > 5 mg/               electron availability within the systems. Electrons are essential
L as per MMWQS Class 2 Fisheries in mariculture. Factors                    to all inorganic and organic chemical reactions. Redox potential
contributing to ammoniacal nitrogen and nitrate peaks are                   measurements allow rapid characterisation of the degree of
nutrient runoffs from agriculture activities upstream of the                reduction and predict various compound stability that regulates
rivers, nutrient waste from aquaculture faeces and feed, and                nutrients and metal availability in soil and sediment (Eggleton
sewage and resuspension of surface sediments into the water                 and Thomas, 2004; Pereira et al., 2004). Wong and Yang (1997)
column that increases the decomposition rate. These factors                 found that high redox potential and low pH are associated with
increase the risk of phytoplankton blooms and potentially                   chemical equilibrium disruption and the release of heavy metals
ammonia poisoning of the fish.                                               from marine sediments. Negative Eh values are characteristic of
    The temperature at the existing aquaculture site does not vary          bottom deposits rich in organic matter and consist mainly of
significantly compared to the study by Isa et al. (2020), where the          fine sediments. Reimers et al. (2013) suggested that the
temperature of the Malacca Straits ranged between 28 and 30°C.              reducing condition is generally caused by decomposable
Isa et al. (2020) suggested that the temperature is lowest during           organic matter, bacteria and allied microorganisms. The
NE monsoon and highest during SW monsoon. Besides,                          lowest redox potential value was recorded at the existing
Bermudes et al. (2010) reported that the ideal temperature for              aquaculture site, indicating that such conditions are
rearing seabass (L. calcarifer) for the maximum growth and feed             maintained by certain organic compounds, ferrous iron,
intake is within the range of 29.1 - 34.9°C, while the optimal feed         reduced manganese, hydrogen sulphide, and other inorganic
efficiency is achieved between 26.2 - 34.9°C. At station WQ5, DO             constituents of sediments.
fluctuations were found between 3.5 - 4.0 m. Similarly, salinity                 TOC was remarkably high (9.63%) at P7, which may be
fluctuation was evident at 3.5 - 4.0 m compared to the surface               contributed by the proximity to the shipping lane and estuarine
water, contributed by the influx of river water and resulting                area prone to anthropogenic pollution from the mainland
turbulence during the water mixing activity.                                (sewage, surface runoff, heavy sedimentation). Generally,
    The DO concentrations recorded at the proposed site                     organic carbon represents < 5% of marine sediment even when
exceeded the 5 mg/L MMWQS Class 2 limits. The positive                      the PSD findings of fine silt/clay particles are high. Martinez-
finding might result from the increased exposure to the ocean,               Garcia et al. (2015) suggested that the organic carbon found in
higher current velocities and distance from aquaculture site                muddy sediment with polychaete and fecal pellets could account
(Johansson et al., 2007). However, abiotic factors such as high             for ≥ 30% of the sediment dry weight. Organically enriched
water temperature and salinity also affect the liberation of an             sediment is an aerobic environment that does not facilitate
oxygen molecule from water; hence, the reduced DO                           nitrification and phosphate release from the iron-bound pool.
concentration (Jack et al., 2009). Asian seabass is a hardy fish             Unfortunately, phosphate concentration in the water column
that can tolerate 0 to 56 ppt salinity (Food and Agriculture                was not measured. The anaerobic environment of benthic
Organization (FAO), 2017), and thus, highly suitable to be reared           sediment promotes the sulphate reduction process, which leads
at the proposed site. Additionally, pompano can tolerate a wide             to a high concentration of dissolved sulphide in the sediment
range of salinity (10 ppt to 15 ppt salinity) (Pathak et al., 2019),        (Holmer et al., 2003). Sulphate depletion is the main factor
and is suitable for culture at the proposed site. The overall test          contributing to microbial methanogenesis. The accumulation of
temperatures applied across the different life stages of the                sulphides and methane are harmful to benthic macrofauna.
aquaculture groupers (Serranidae) ranged from 13°C to 35°C,                 Naturally, muddy sediment has higher organic matter and
with a mean optimum rearing temperature of 26°C (Das et al.,                sulphate reduction rates than sandy sediment (Martinez-Garcia
2021), thus, ideal to be cultured at the proposed site.                     et al., 2015). In this study, decomposable organic matter content
Ammoniacal nitrogen concentrations were much lower                          may result from debris and waste from existing aquaculture sites
compared to the existing Kukup aquaculture site. However, the               adjacent to sampling stations. Organic matter characteristics
F2 station located close to the boundary of the proposed site               may be seasonal in quantity and quality (Gremare et al., 1997).
recorded high ammoniacal nitrogen concentration, exceeding                  No hydrocarbons were detected (< 0.01 mg/kg) at all sampling
the MMWQS Class 2 limits. Meanwhile, the nitrate                            points, although the new proposed site is in the vicinity of the
concentrations were high at stations F2 and F4. The high                    shipping lane. Hydrocarbons are introduced into the surface
nutrient load could lead to eutrophication and, subsequently,               water of the marine environment from surface runoff and
phytoplankton blooms.                                                       erosion, effluent discharge, debris of virgin polystyrene, and
                                                                            biological sources. Despite the association of hydrophobic
4.3 Marine Sediments and Macrobenthos                                       compounds with particles, the deposition in the underlying
Diversity                                                                   sediments is variable (Liu et al., 2012; Rochman et al., 2013).
Silt sediment is categorised as lithogenous sediment derived                At the global scale, the storage of organic matter as TOC mirrors
from continental rock erosion. Shaari et al. (2017) reported that           the distribution pattern of phytoplankton biomass (Seiter et al.,

Frontiers in Marine Science | www.frontiersin.org                      13                                    May 2022 | Volume 9 | Article 888662
Chor et al. Mariculture Spatial Analysis in Kukup
2004). However, diverse biogeochemical and sediment processes ind./m2 during the SW monsoon (DHI Water and Environment,
can modify such patterns at the regional level (Zabel et al., 1998). 2013). Capitellids are regular inhabitants of the soft marine
The quantity and nature of the deposited organic matter are sediments found in all sampling sites except P3. They are
intimately related to the environmental conditions of deposition, among the many keystone species essential in the energy
depending on multiple factors, many of which are budgets due to their feeding habits and abundance (Garcı́a-
interdependent. The three main factors include 1) supply of Garza and De Leó n-Gonzá lez, 2011). In addition, they are
organic matter in the overlying water, 2) the rate of benthic burrowers and feed on organic matter adhering to
decomposition of the organic substances in water or after sediments and are regarded as non-selective deposit feeders
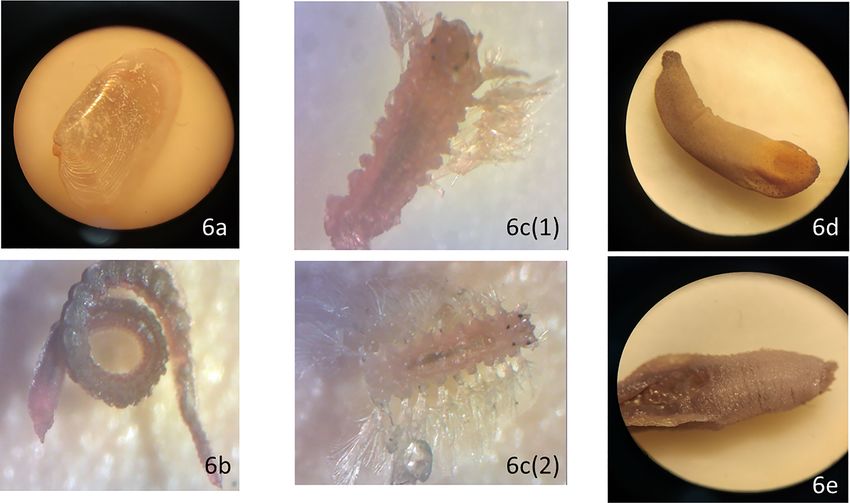
accumulation in the sediments, and 3) water movement where (Dean, 2001). Microscopic images of bivalve, capitellid,
the materials are deposited (Wakeham and Canuel, 2006). The hesionid, peanut worm, scalibregmatid are shown in Figure 6.
supply of organic matter in typical marine deposits is primarily Capitellids are distributed from the intertidal zone to the deep
influenced by the growth of the phytoplankton in the water, sea and are often dominant components of the infaunal
sunlight exposure and mineral nutrients. Water movement or community, especially in organically enriched sediments.
circulation influences the supply of nutrients, while organic Therefore, they act as pollution indicators of man-induced,
matter decomposition is regulated by several factors, mainly organically enriched areas such as organic-rich sediments and
oxygen supply. The oxygen supply is determined by the benthic habitats defaunated by artificial disasters such as oil
decomposition of organic matter and water circulation. In spills, red tide blooms and tropical storms (Sivadas et al., 2010;
addition, horizontal advection and compound selective Washburn et al., 2016; Hilliard, 2020). However, polychaete
degradation can affect the distribution and composition of the under the Lumbrineridae family is commonly found within the
settling particles. Therefore, the material deposited at the organically enriched sediment and sediment with a low degree of
sediment-water interface is not a good representation of metal contamination (D'Alessandro et al., 2014). Similarly,
hydrocarbon transported through the water column. Spionids are opportunistic surface deposit feeders and thrive in
Copper, nickel, lead, zinc, iron and manganese are detected at organically enriched sediments. Water with a heavy suspended
all sampling points. The trace elements potentially originated sediment load could be significantly filtered when it passes over
from wastewater discharge or soil erosion (Hosono et al., 2011). dense populations of spionid polychaetes. Spionids accumulate
Furthermore, studies have suggested that heavy metals could be particles from water column and sediment as part of their tubes
derived from fish food at existing aquaculture sites (Liang et al., or in interstices between the tubes (Taghon et al., 1980). Studies
2016). Moreover, earlier studies found that the source of heavy have suggested that smaller particles collected by spionids are
metals could leach from the fish food at existing aquaculture sites consumed while bigger particles are utilised as building materials
(Kundu et al., 2017; Sabbir et al., 2018). Meanwhile, Hayat et al. for their tubes (Frithsen and Doering, 1986). The ecological role
(2017) suggested that 10 mg/kg of heavy metals such as lead, of spionids is to remove particles from the water during the high
silver, chromium, copper, cobalt, nickel and zinc can particle flux, which is an active sedimentation process in coastal
significantly affect L. calcarifer’s kidney by inhibiting ecosystems (Blake et al., 2020). Gillet et al. (2012) suggested that
cholinesterases (ChE) activity at various percentages. Apart Nereididae is a significant link in benthic food webs and through
from that, heavy metals weaken their immune system and sediment reworking by bioturbation activity. Nereidae also
induce pathological changes. The consumption of finfish enhances the oxygen transport into sediments through
polluted by heavy metals can adversely affect human health irrigation and increases the surface area of oxygenated
(Kumar et al., 2021). As the heavy metals become more sediments through the burrow construction. Overall, the water
concentrated in the environment, these elements enter the quality data of all sampling sites are within the MMWQS Class 2
biogeochemical cycle, leading to toxicity. Fisheries and mariculture threshold limits. Similarly, the
The polychaete fauna of the study area is dominated by sediment hydrocarbons and heavy metals composition values
sedentaria and errantia orders commonly found in the tropical are within the intervention value compared to the Dutch
Indo-Malayan sub-region of the Indo-West-Pacific province Intervention values for aquatic sediment (Dutch Ministry of
(Shin, 1982). The Shannon diversity index (H’) values of the Housing, Spatial Planning and Environment, VROM, 2010).
study site were relatively high, indicating well distribution of
macrobenthos fauna. Nonetheless, these values were higher than
those reported by Quek and Chua (1990) for Sungei Buloh and 5 CONCLUSION
Chung and Goh (1990) in Tekong Island. A high variation in the
evenness index (J’) value was evident, ranging from 0.54 ± 0.23 at Water quality at the existing aquaculture site is subjected to higher
P7 to 0.93 ± 0.02 at P5. A good distribution of organisms in a concentrations of nutrient loading and salinity fluctuations.
pristine environment would typically have a score of ≥ 0.9 Aquaculture tropical finfish will still grow in these conditions
(Sokołowski et al., 2012). The evenness index (J’) values were but with poorer fish health and higher mortality. Due to lower
relatively high, stipulating that the macrobenthos were equally flushing rates and high nutrient measurements, the existing site
distributed throughout the habitats except for P7. Meanwhile, should move toward moderate to low-intensity farming instead of
studies in Tg. Pulai has reported the abundance of macrobenthos the current high-intensity farming to maintain optimal fish health.
mean density, ranging between 320 ± 114 (range: 126 - 535) ind./ The spatial analysis indicates that the water quality during the
m2 during the NE monsoon and 267 ± 247 (range: 56-1,343) normal hydrodynamic and meteorological conditions at the
Frontiers in Marine Science | www.frontiersin.org 14 May 2022 | Volume 9 | Article 888662You can also read