Socioeconomic Benefits of the Shinkansen Network - MDPI
←
→
Page content transcription
If your browser does not render page correctly, please read the page content below
infrastructures
Article
Socioeconomic Benefits of the Shinkansen Network
Panrawee Rungskunroch, Anson Jack                       and Sakdirat Kaewunruen *

                                          School of Engineering, University of Birmingham, Birmingham B15 2TT, UK; PXR615@student.bham.ac.uk (P.R.);
                                          A.C.R.Jack@bham.ac.uk (A.J.)
                                          * Correspondence: s.kaewunruen@bham.ac.uk

                                          Abstract: High speed rail (HSR) networks have been an essential catalyst in stimulating and balancing
                                          regional economic growth that ultimately benefits the society as a whole. Previous studies have
                                          revealed that HSR services sustainably yield superior social values for people, especially for adults
                                          and those of working age. This has become an advantage of HSR networks over other forms of public
                                          transportation. The Shinkansen network in Japan is one of most successful HSR models. Its services
                                          bring significant social advantages to the communities it serves, such as shorter travel times and
                                          increased job opportunities. Nevertheless, the societal impact of HSR networks depends on many
                                          factors, and the benefits of HSR could also be overrated. The goal of this research is to measure the
                                          socioeconomic impacts of HSR on people of all genders and age groups. The outcomes could lead
                                          to more suitable development of HSR projects and policies. This study investigates data sets for
                                          Japanese social factors over 55 years in order to determine the impacts of HSR. The assessment model
                                          has been established using Python. It applies Pearson’s correlation (PCC) technique as its main
                                          methodology. This study broadly assesses social impacts on population dynamics, education, age

                                   dependency, job opportunities, and mortality rate using an unparalleled dataset spanning 55 years of
                                          social factors. The results exhibit that younger generations have the most benefits in terms of equal
Citation: Rungskunroch, P.; Jack, A.;
Kaewunruen, S. Socioeconomic
                                          educational accessibility. However, the growth of the HSR network does not influence an increase in
Benefits of the Shinkansen Network.       the employment rate or labour force numbers, resulting in little benefit to the workforce.
Infrastructures 2021, 6, 68.
https://doi.org/10.3390/                  Keywords: socioeconomic impacts; population dynamic; high-speed rail (HSR); sustainability;
infrastructures6050068                    transport and policy

Academic Editors:
Gabriella Mazzulla and
Giuseppe Cantisani                        1. Introduction
                                                Railway transport is the safest and the most environment-friendly mode of transport.
Received: 13 March 2021
                                          However, the socioeconomic impacts of high-speed rail (HSR) have become a global debate
Accepted: 28 April 2021
                                          in various political arenas. Many experts have claimed that HSR services generate benefits
Published: 30 April 2021
                                          to a society, but it has not been possible to evaluate the extent of the HSR’s impacts. Many
                                          researchers have attempted to adopt various statistical methods to assess HSR’s actual
Publisher’s Note: MDPI stays neutral
with regard to jurisdictional claims in
                                          social impacts. However, the scope of research outcome is inadequate since HSR networks
published maps and institutional affil-
                                          can be affected by various conglomerate factors, such as geography, station locations, and
iations.
                                          population incomes.
                                                HSR networks have been considered to be a new and smart alternative form of
                                          public transportation, and have become highly competitive compared with other modes of
                                          transportation for medium-distance journeys. Japan’s HSR network, the Shinkansen, is
                                          considered as one of the greatest HSR networks. The operation of Japanese HSR services
Copyright: © 2021 by the authors.
                                          has influenced the lives of residents and has ultimately offered various social benefits in
Licensee MDPI, Basel, Switzerland.
                                          terms of population dynamics and the country’s workforce (especially to adults). The
This article is an open access article
distributed under the terms and
                                          Shinkansen network shares the market with four other modes of transportation (i.e., buses,
conditions of the Creative Commons
                                          ferries, cars, and airplanes) and has become the most competitive service for distances
Attribution (CC BY) license (https://     between 500 and 700 km, gaining 69.1% of the total market share [1]. Similarly, other
creativecommons.org/licenses/by/          studies showed that HSRs gain the greatest market share when implemented for the
4.0/).

Infrastructures 2021, 6, 68. https://doi.org/10.3390/infrastructures6050068                         https://www.mdpi.com/journal/infrastructures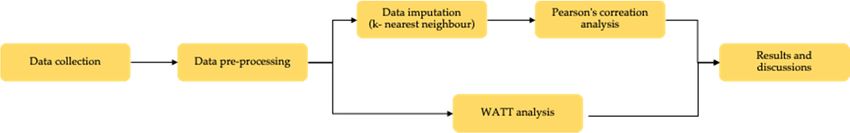
Infrastructures 2021, 6, 68                                                                                         2 of 11

                              distance between 483 and 692 km [2–5]. HSR has brought the advantage of greater mobility
                              to local communities across the service area, widening the opportunities for the society.
                                   HSR acts as a catalyst to connect urban and suburban areas, and its service enables
                              economic growth. The vast and seamless connections of the network are of great interest to
                              HSR passengers. As an illustration, China’s HSR network has become the most extensive
                              network in the world, containing over 15,000 km of HSR tracks [6]. The HSR system
                              enables Chinese people to travel across the country and links China with its borders,
                              directly enlarging its markets. The HSR network is expected to enhance China’s GDP by
                              approximately 1–3%. Additionally, significant extension of HSR networks has also occurred
                              in Europe, showing a growth in networks from 643 km in 1985 to 7343 km in 2013 [6],
                              and raising the market share in most of the European countries [7]. These European
                              HSR networks enable passengers to travel across borders and stimulate the economy by
                              increasing productivity, growing the workforce, and enlarging markets [8,9]. The HSR
                              services undoubtedly reflect advantages for adult commuters in terms of business and jobs.
                              On the other hand, no study has examined the impact of HSR networks on young and
                              elderly groups of passengers. Therefore, this research aims to fill these gaps by analysing
                              the effects of HSR and relevant social factors on every passenger of all generations.
                                   This research considers Japan’s HSR network as a case study for evaluating the socio-
                              economic impacts stemming from the growth of the Shinkansen network. One way to
                              overcome issues of uncertainties within the study is to use the long-term datasets of social
                              factors to derive a correlation with the growth of the Shinkansen network. In addition,
                              correlation and PCC models have been established using Python. The research focuses on
                              12 critical factors related to socioeconomic impacts in Japan. The outcomes of this study
                              can represent exactly how HSR networks will benefit society. Additionally, the models can
                              be applied to HSR systems in other countries in order to measure the actual impacts of the
                              HSR networks, which can lead to good decision-making for any future HSR development.

                              2. Methodology
                                   To evaluate the social impacts of HSR services in Japan, long-term data on social
                              factors has been collected from the World Bank [10], which is considered a reliable data
                              source. Twelve social factors to be considered in this study have been identified, involving
                              population dynamics, educational, local economic, and workforce issues. All 12 data sets
                              were compiled for 55 years between 1964 and 2019. Data preprocessing has been conducted
                              to validate the information. After identifying missing data for some of the selected social
                              factors, a k-nearest neighbor (kNN) model was created through Python to predict missing
                              values. A correlation analysis was then undertaken to measure the impacts of the HSR
                              network growth on these social factors, as shown in Figure 1.
source. Twelve social factors to be considered in this study have been identified, involving
population dynamics, educational, local economic, and workforce issues. All 12 data sets
were compiled for 55 years between 1964 and 2019. Data preprocessing has been con-
ducted to validate the information. After identifying missing data for some of the selected
Infrastructures 2021, 6, 68 social factors, a k-nearest neighbor (kNN) model was created through Python to predict 3 of 11
missing values. A correlation analysis was then undertaken to measure the impacts of the
HSR network growth on these social factors, as shown in Figure 1.
Figure
Figure 1. 1.
An An overviewofofresearch’s
overview research’smethodology
methodology to
to measure
measuresocioeconomic
socioeconomicimpacts
impactsofof
anan
HSR system.
HSR system.
2.1. K-Nearest Neighbour (kNN)
2.1. K-Nearest
The kNNNeighbour
algorithm(kNN)
is used to replace missing values in the data sets. The concept of
kNN Theis to
kNNsubstitute missing
algorithm values
is used with the
to replace most similar
missing values complete values.
in the data sets. The concept
k value of
can vary
kNN dependingmissing
is to substitute on the amount of complete
values with data
the most in thecomplete
similar data sets.values.
For example, whencan
The k value
vary depending on the amount of complete data in the data sets. For example, when k is
selected as 3 (k = 3), the three nearest data points are calculated using the selected functions
(i.e., Euclidean, Manhattan, Pearson) to create and insert a new value for the missing one.
However, the selection of the k value must be carefully considered because inappropriate
selection can result in poor model performance in terms of estimation. A lower k-value
may indicate the lack of conformity to the trend in the data set, whereas a higher k value
may be included with other disturbance values [11]. The best solution for finding a k value
is to test different k values in the data sets to reduce arbitrary error [12]. This study uses
the standard Euclidian distance form, as shown in Equation (1).
In this study, the kNN is used to predict missing values in the World Bank’s official report.
q
d( p, q) = ( p1 − q1 )2 + ( p2 − q2 )2 + · · · + ( p n − q n )2 (1)
where: d = Euclidean distance between the point p and q, p = {p1 , p2 , . . . , pn }, q = {q1 , q2 , . . . , qn },
and n = number point p and q from 0 to n.
2.2. Pearson’s Correlation Analysis
Pearson’s correlation coefficient has been successfully applied in various statistical
studies [13–16]. It is commonly used to measure the relationship between two variables,
and the results range from −1 to 1. There are multiple aspects of the data analysis of the
correlation between two factors depending on the area of study; for example, the range of
strong relationships is 0.7–0.9 in psychology, 0.4–0.6 in politics, and 0.8–0.9 in medicine [17].
In this research, a value in the range ±0.1 to ±0.3 means a weak relationship, ±0.3 to ±0.5
means a moderate relationship, and ±0.5 to ±1.0 means a strong relationship. A positive
value means that both factors are in direct variation, whereas a negative value means both
factors are in inverse variation.
In this study, the Pearson’s correlation is taken to measure the correlation between
social factors and the growth of the Shinkansen network, as shown in Equation (2):
∑( Xi − X )(Ya − Y )
P= q (2)
2 2
∑( Xi − X ) ∑(Ya − Y )
where P = correlation coefficient; Xi = values for social factor i; X = mean of the values for
social factor i; Ya = the length of Shinkansen network in year a; Y = mean length of the
Shinkansen network.Infrastructures 2021, 6, 68 4 of 11
2.3. Weighted Average Travel Time (WATT)
This study uses WATT to measure accessibility in Japan. In addition, it can be used to
compare conventional rail and HSR services.
∑bB=1 Mb ∗ tt ab
WATT a = (3)
∑bB=1 Mb
where: WATTa = Weight average travel time, Mb = population density of station, ttab =
travel time from origin a to b.
3. Result and Discussions
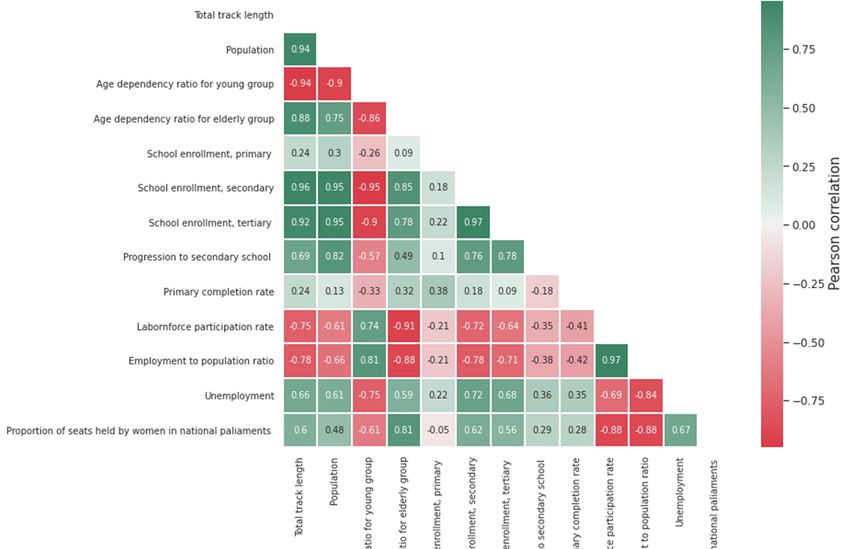
From the Pearson’s correlation analysis among 12 social factors and the growth of the
Shinkansen network, the outcomes represent values between −1 and 1, as described in
Table 1 and Figure 2.
The benefits of HSR networks can be classified as either direct and indirect effects on a
society. The core concept of HSR is to build on the improved train performance in terms of
speed. The first era of rail transportation was characterized by lower train velocities. One
obvious benefit of trains is the increased accessibility. Table 2 shows the WATT analysis
results for the Shinkansen network of Honshu area. The results for the Shinkansen network
represent time saving of at least 25% compared with conventional trains on the same routes.
Table 1. The summary of PCC results of Japan’s socioeconomic factors.
Socioeconomic Factors PCC Result
Population 0.9428
Age dependency ratio for young group −0.9419
Age dependency ratio for elderly group 0.8751
School enrolment, primary 0.2425
School enrolment, secondary 0.9641
School enrolment, tertiary 0.9217
Progression to secondary school 0.6935
Primary completion rate 0.2378
Labour force participation rate −0.7483
Employment to population ratio −0.7775
Unemployment 0.6577
Proportion of seats held by women in national parliaments 0.5958
Table 2. The summary of Shinkansen services in the Honshu area and WATT analysis.
WATT Analysis (mins) a
Train Distance Number of
Lines Route Conventional
Operators (km) Stations HSR
Rail
Hokuriku Tokyo–Kanazawa 345.4 18 240 148
JR West
Sanyo Shin Osaka–Hakata 553.7 19 224 137
142 (Nozomi),
JR Central Tokkaido Tokyo–Osaka 552.6 17 587 180 (Hikari),
240 (Kodama)
Tohoku Tokyo–Shin Aomori 713.7 26 242 143
Joetsu Tokyo–Niigata 333.9 13 Inaccessible 120
JR East
Yamagata Tokyo–Shinjo 421.4 16 203 149
Akita Tokyo–Akita 670.2 16 306 229
a The WATT analysis used the data from official report of Shinkansen’s operators [18–20].School enrolment, tertiary 0.9217
Progression to secondary school 0.6935
Primary completion rate 0.2378
Labour force participation rate −0.7483
Infrastructures 2021, 6, 68 Employment to population ratio −0.7775 5 of 11
Unemployment 0.6577
Proportion of seats held by women in national parliaments 0.5958
Figure 2. The PCC result of the Japanese rail network and social impacts in
in Japan.
Japan.
Withbenefits
The respectof toHSR
JR West, the maximum
networks reduction
can be classified in travel
as either time
direct from
and that ofeffects
indirect conven-
on
tional rail is 38.83% for the Sanyo Shinkansen. The Tokkaido Shinkansen,
a society. The core concept of HSR is to build on the improved train performance in termsthe most popular
Shinkansen
of speed. The service, hasof
first era three
raildifferent train classes
transportation in services, namely
was characterized Nozomi,
by lower trainHikari and
velocities.
Kodama.
One obviousThebenefit
fastest of
train has is
trains a travel time saving
the increased of 76.15%Table
accessibility. compared
2 showsto the
theconventional
WATT anal-
line. results
ysis Overall,forShinkansen servicesnetwork
the Shinkansen reduce travel time by
of Honshu between
area. 25.16%for
The results (Akita
the Shinkansen)
Shinkansen
and 40.90% (Tohoku Shinkansen) compared with JR East’s conventional
network represent time saving of at least 25% compared with conventional trains lines. As a onresult,
the
remarkably
same routes. shortened service times and increased station accessibility provide a potential
impact on Japanese society.
Socioeconomic benefits are recognized as indirect effects of HSR services. With grow-
ing demand for services, an increased demand for tourists in areas with HSR services can
also be expected. Figure 3 illustrates the coverage of the Shinkansen network with the total
operating distance of 3066.2 km. The transportation system is one of the critical factors
that induces passengers to travel [21–24]. The volume of traffic has been found to have
increased by 10% in the short-term, reducing 20% of the travel time in HSR corridors [22].
Therefore, social and economic conditions can be improved as a side effect (or secondary
benefit) of HSR (i.e., population growth and educational benefits).Infrastructures 2021, 6, 68 6 of 11
Infrastructures 2021, 6, x FOR PEER REVIEW 6 of 11
Figure3.3.An
Figure Anoverview
overviewof
ofthe
theShinkansen’s
Shinkansen’sinfrastructure.
infrastructure.
Throughthe
Through thePCC
PCCanalysis,
analysis,12
12social
socialfactors
factorshave
havebeen
beenevaluated,
evaluated,and
andcan
canbe
besplit
splitinto
into
threegroups:
three groups:population
populationdynamics,
dynamics,educational,
educational,and
andlocal
localeconomics/workforce.
economics/workforce.
3.1.
3.1. Population
Population Dynamics
Dynamics
The
The dynamics
dynamics of of population
population relate
relateto
toaccessibility
accessibilityof ofurbanization,
urbanization,relocation,
relocation,andand
other relevant factors such as accommodation and workplaces. It is found
other relevant factors such as accommodation and workplaces. It is found that the trend that the trend
in
in population
population growth
growth hashas been
been marginally
marginally higher
higher along
along HSR
HSR lines
lines after
after the
the Tokkaido
Tokkaido
Shinkansen
Shinkansen came into service [24,25], and those cities with HSR stations have22%
came into service [24,25], and those cities with HSR stations have 22%higher
higher
growth
growth than cities without
than cities withoutHSRHSR[23,26].
[23,26].Moreover,
Moreover, half
half of those
of those prefectures
prefectures contain
contain at
at least
least one HSR station, and had a population growth higher than the national
one HSR station, and had a population growth higher than the national average. The average. The
Tohoku
TohokuHSR HSRline’s
line’seffects
effectsare
areshown
shownto torepresent
representaapopulation
populationgrowth
growthof of32%
32%inincities
cities
close to HSR stations, whereas the remaining areas have shown no significant
close to HSR stations, whereas the remaining areas have shown no significant population population
growth
growth[27].
[27].
The benefits of increasing regional accessibility are revealed from the time-space
The benefits of increasing regional accessibility are revealed from the time-space con-
convergence effect [28]. Also, HSR services increase spatial disparity in a region, with
vergence effect [28]. Also, HSR services increase spatial disparity in a region, with long-
long-term connectivity benefits to people who live in areas close to HSR stations [29,30].
term connectivity benefits to people who live in areas close to HSR stations [29,30]. More-
Moreover, the provision of HSR services increases the quality of affected residential areas,
over, the provision of HSR services increases the quality of affected residential areas, be-
because they serve people’s need for accessible travel, which enhances visits or work
cause they serve people’s need for accessible travel, which enhances visits or work travel
travel between places. This has been evidenced by the increased in property prices aroundInfrastructures 2021, 6, 68 7 of 11
stations. Buildings can therefore gain a positive connectivity impact from their locations
close to stations. It is noted that commercial properties within 0.25 miles of stations are
12.2% more expensive than other residential properties. Also, there is a variation of 4.2%
in prices shown between areas close to railway stations and other business zones [31]. In
addition, the areas close to railway stations connected to central business districts (CBD)
have received the most significant impacts on property prices [32]. The statements above
precisely show that HSR services have positive effects on quality of life.
A strong positive relationship (R = 0.924) has been found between the development
of Shinkansen networks and the benefits to Japanese residents. Similarly, the potential
impact on population dynamics due to Shinkansen services is shown in some areas [33]. In
terms of age dependency, the younger and older generations have been investigated. The
outcome for the younger generation is −0.9419, and for the older generation is 0.8751. It is
interesting to note that the advent of the Shinkansen network has offered more benefits to
the elderly than to younger age groups.
3.2. Educational Factors
Access to proper education is one of the crucial factors that have driven society
forward. This research measures the opportunities for children to attend three school levels
(primary, secondary, and tertiary). These factors demonstrate how HSR services can impact
the younger generation. In fact, children in developing countries have faced problems
because of the lack of educational opportunities [34]. Some studies have revealed that
many children must walk to/from school for up to six hours daily because their homes are
so far from the nearest school. Additionally, this issue still prevails in the suburban areas
of developed countries, since children require a higher standard of education equivalent
to that of city children. Therefore, the development of the HSR networks can remove the
barriers to a standard education system.
Hence, the benefits of HSR services for the young generation should be measured by
the school attendance rate that reflects educational opportunities. This research has col-
lected information from the school enrolment data for the primary, secondary, and tertiary
levels in Japan, demonstrating the positive relationships with the growth of Shinkansen
networks. It is worth discussing these promising outcomes revealed by the enrollment rate
results for secondary and tertiary school, which are 0.9641 and 0.9217, respectively. More-
over, the result of the progression to secondary school is 0.6935. This can be interpreted to
mean that the Shinkansen networks provide benefits to the younger generation in order to
enhance their educational opportunities.
3.3. Local Economic Benefit and the Workforce
With respect to the economy in Japan, Shinkansen services seem to have only affected
the labor market at the beginning of their operational periods. Many researchers had
evaluated the Shinkansen network’s impacts on population dynamics as including the
effects on employment and the labor force. Cities with HSR stations have gained 16–34%
higher employment growth. Growth rates are found to be 1.8% in areas connected to HSR
stations, but they are only 1.3% in those areas without HSR stations [35]. Reportedly, the
employment rate has decreased through the following years. While the result has showed
an overall fall of only 2.8% in 1989, it has reduced by 3.6% in the areas without HSR. In
comparison, the information technology (IT) sector has risen to 22% [36]. These comparison
imply that the Shinkansen network’s impact is associated with a very limited part of the
labor market. The businesses involved, such as food retailing and the accommodation
sector, need a higher degree of accessibility to stations [26,36,37]. On the other hand,
the HSR network has increased job opportunities for women [37,38]. This study has
investigated the proportion of seats held by women in the national parliament as a factor
in this study. The outcome is 0.5958, which illustrates a strong positive relationship with
the HSR network. However, job opportunities for women can also be measured in other
sectors. This assumption might be addressed in future studies.frastructures 2021, 6, x FOR PEER REVIEW 8 of 11
Infrastructures 2021, 6, 68 8 of 11
network. However, job opportunities for women can also be measured in other sectors.
This assumption might be addressed in future studies.
However, the outcomes of this study in terms of the labor force and employment rate
are −0.7483 andHowever, the outcomes
−0.7775, respectively. of this study
Moreover, in terms
the result of the
for the labor force and
unemployment rateemployment
is
rate are − 0.7483 and − 0.7775, respectively. Moreover, the result for
0.6577. This reveals that the overall advantage of the Shinkansen network for the Japanesethe unemployment
labor marketratehas
is 0.6577. This reveals
decreased, as shownthatinthe overallsectors
specific advantage
and of the Shinkansen
locations. network
Similarly, the for the
Japanese labor market has decreased, as shown in specific sectors and
study’s PCC result for employment is 0.1375, indicating a low positive correlation with locations. Similarly,
the growththe of study’s PCC result
the Shinkansen for employment is 0.1375, indicating a low positive correlation with
network.
the growth of the Shinkansen network.
In Figure 4, the PCC results exhibit that the quality of living, the educational and local
In Figure 4, the PCC results exhibit that the quality of living, the educational and local
economics, and the workforce pillars are 0.0800, 0.4120 and 0.1375, respectively. The re-
economics, and the workforce pillars are 0.0800, 0.4120 and 0.1375, respectively. The results
sults raise the average PCC of all factors to 0.2098, which implies that the Shinkansen net-
raise the average PCC of all factors to 0.2098, which implies that the Shinkansen network
work has relatively small socioeconomic benefits.
has relatively small socioeconomic benefits.
Quality of living
0.5000
0.0800
0.0000
-0.5000
-1.0000
0.1375
Employment Education
0.4120
Figure
Figure 4. The 4. The on
comparison comparison on theofradar
the radar charts charts
quality of quality
of living, of living,
education, education, and
and employment in employment
Japan. in Japan.
4. Policy Implications
4. Policy Implications
This study suggests that the government can increase opportunities for adults and
This study suggests through
the workforce that the agovernment
suitable andcan increase
robust opportunities
design of sustainable fordevelopment
adults and policies
the workforce
relatedthrough
to the aShinkansen
suitable and robust design of sustainable development policies
network.
related to the Shinkansen network.
First, the development of business areas and office space close and connected to
First, HSR
the development
stations canof business
increase jobareas and office space
opportunities. HSR close andclose
stations connected to HSR
to central business dis-
stations can increase job opportunities. HSR stations close to central business
tricts are able to increase job rates because secured and convenient services are districts are offered to
able to increase
workers job[21,38–40].
rates because secured
Also, and convenient
workplaces services
within walking are offered
distance of HSRtostations
workers can become
[21,38–40].an Also, workplaces
essential within
criterion walking
for job seekersdistance
and new of HSR stationsfor
businesses can become
greener an es-innovation
urban
sential criterion
towards fornet
job zero
seekers and new
or even businesses
negative for greener
emissions [41,42]. urban innovation towards
net zero or evenNext, negative emissions [41,42].
special weekday tickets for workers should be considered. Most rail authorities
Next, offer
special weekday
specially tickets
priced for workers
tickets should
for children andbethe
considered. Most railthe
elderly. However, authorities
authorities should
offer specially priced tickets for children and the elderly. However,
also offer weekday access to workers who regularly travel between their the authorities should workplaces
also offer weekday
and homes. access
Thistostudy
workers who regularly
underpins that thetravel between
affordable their workplaces
connectivity strategyand
can generate
homes. This study
better underpins
long-term that the
benefits foraffordable connectivity
the workforce and thestrategy
country’scaneconomy.
generate HSRbetterstation can
long-term act
benefits for the
as a hub forworkforce
services and andcanthebuild
country’s economy.that
on synergies HSRattract
station can act asand
secondary a tertiary
hub for services and can
revenues [43,44]. build on synergies that attract secondary and tertiary revenues
[43,44]. Lastly, the HSR timetable should be rescheduled to support workers’ demands, espe-
Lastly, the HSR
cially in thetimetable
suburbanshould be rescheduled
areas. This would be anto support workers’
extraordinary benefitdemands,
for peoplees-
who require
pecially inon-demand
the suburban areas.
access This and
to early wouldlatebe an extraordinary
services benefit for people who
to be timetabled.
require on-demand access to early and late services to be timetabled.
5. Conclusions
This study determines the social impacts of the Shinkansen network on Japan’s res-
idents and the economy. The research aims to evaluate social benefits that can lead to
sustainable development policies for future HSR networks. This study is the world’s first
study to provide quantitative evidence underpinning the socioeconomic benefits stemming
from an HSR network. Some scholars have highlighted the social impacts of HSR services,
but most previous studies had focused only on adults. Such studies cannot truly reflect aInfrastructures 2021, 6, 68 9 of 11
society in its entirety. This study has produced unparalleled long-term datasets collected
for 12 social factors in Japan since 1964. Although the collected data sets have some missing
information, the data imputation method (kNN) has been used to predict those missing
values. This study has also established a new evaluation model based on Pearson’s analysis
as a critical methodology.
Our new findings indicate that Japanese HSR services contribute to the social im-
pact differently, especially when considering different generations. Previous studies had
suggested that HSRs can benefit workers and stimulate the Japanese economy. However,
this study is the first to illustrate that the younger and adult generations enjoy greater
opportunities than the adult or worker groups. The social impacts are evidenced by school
enrolments. The primary, secondary, and tertiary enrolment rates demonstrate a strong
relationship with the growth of the HSR network. This can be confirmed by an increase in
the average PCC value for educational factors of 0.4120.
On the other hand, the impact on the adult workforce and the availability of job
opportunities has not been significant. The results illustrate that the average value of
employment opportunities for all genders is −0.7278, which denotes a strong negative
relationship. However, this study also reveals that HSR generates clear benefits in terms of
women’s job opportunities; for instance, in the national parliament.
6. Study Limitations and Future Works
This research assesses the socioeconomic benefits of the Shinkansen network in Japan
by cross-investigating 12 socioeconomic factors. The results are presented with reference to
Pearson’s correlations. However, some limitations of this research should be noted.
First, the socioeconomic factors were recorded between 1964 and 2019, enabling a
comprehensive data set. Nevertheless, any adjustment of the dataset (e.g., evaluation
period, variables) will in turn change these socioeconomic impacts. Second, the study
focuses only on the impact of HSR on Japanese society. The findings and policy implications
are related only to Japan. Therefore, an analysis using local data sets is necessary to develop
a suitable framework for other countries.
For future works, the review of the socioeconomic benefits can be implemented for
other countries such as China, France, South Korea, and Spain. The results could be
compared to indicate cultural differences between Asian and European countries. Lastly,
an in-depth analysis of job opportunities in each sector could be conducted with respect
to the expansion of HSR networks. The outcomes could lead to sustainable development
suitable for each particular network.
Author Contributions: Conceptualization, P.R. and S.K.; methodology, P.R.; Coding, P.R. and A.J.;
validation, P.R. and S.K.; formal analysis, P.R.; investigation, P.R., A.J. and S.K.; resources, S.K.;
writing—original draft preparation, A.J.; writing—review and editing, P.R. and S.K.; visualization,
P.R.; supervision, S.K.; project administration, S.K.; funding acquisition, S.K. All authors have read
and agreed to the published version of the manuscript.
Funding: European Commission for the financial sponsorship of the H2020-RISEN Project No. 691135,
and Japan Society for the Promotion of Sciences (JSPS), for the JSPS Invitation Fellowship for Research
(Long-term), Grant No. JSPS-L15701.
Institutional Review Board Statement: Not applicable.
Informed Consent Statement: Not applicable.
Data Availability Statement: Data can be made available upon reasonable request.
Acknowledgments: The first author gratefully acknowledges the Royal Thai Government for the
PhD scholarship at the University of Birmingham, United Kingdom and the RISEN funding for one
year at University of California, Berkeley. The corresponding author acknowledges the Australian
Academy of Science (AAS) and the Japan Society for the Promotion of Sciences (JSPS), for the JSPS
Invitation Fellowship for Research (Long-term), Grant No. JSPS-L15701, at the Railway Technical
Research Institute (RTRI) and the University of Tokyo, Japan. The authors are sincerely grateful toInfrastructures 2021, 6, 68 10 of 11
the European Commission for the financial sponsorship of the H2020-RISEN Project No. 691135
“RISEN: Rail Infrastructure Systems Engineering Network”, which enables a global research network
that tackles the grand challenge of railway infrastructure resilience and advanced sensing in extreme
environments (www.risen2rail.eu, accessed on 13 March 2021).
Conflicts of Interest: The authors declare no conflict of interest.
References
1. Kojima, Y.; Matsunaga, T.; Yamaguchi, S. The impact of new Shinkansen lines (Tohoku Shinkansen (Hachinohe—Shin-Aomori)
and Kyusyu Shinkansen (Hakata—Shin-Yatsushiro)). Transp. Res. Procedia 2017, 25, 344–357. [CrossRef]
2. Albalate, D.; Bel, G. High-Speed Rail: Lesson for Policy Maker from Experiences Aboard. Public Adm. Rev. 2012, 72, 336–349.
[CrossRef]
3. MLIT (Ministry of Land, Infrastructure, Transport and Tourism Government of Japan). Inter-Regional Travel Survey in Japan.
Available online: http://www.mlit.go.jp/common/001005633.pdf (accessed on 4 March 2021).
4. Chen, Z.; Wang, K.; Ai, Y.W.; Gao, H.; Fang, C. The effects of railway transportation on the enrichment of heavy metals in the
artificial soil on railway cut slopes. Environ. Monit. Assess. 2010, 186, 1039–1049. [CrossRef]
5. Gundelfinger, C.; Coto-Millán, P. Intermodal competition between high-speed rail and air transport in Spain. Util. Policy 2016, 47,
12–17. [CrossRef]
6. European Paliament. High-Speed Rail in the EU. Available online: http://www.europarl.europa.eu/RegData/etudes/BRIE/20
15/568350/EPRS_BRI(2015)568350_EN.pdf (accessed on 12 March 2018).
7. E.U. Transport in Figure Statistic Pocketbook 2014. Available online: https://ec.europa.eu/transport/sites/transport/files/facts-
fundings/statistics/doc/2014/pocketbook2014.pdf (accessed on 12 March 2018).
8. Chen, C.L.; Vickerman, R.W. Quantifying the Economic and Social Impacts of High-Speed Rail: Some Evidence from Europe and the
People’s Republic of China, Working Paper Nr 962; Asian Development Bank Institute: Tokyo, Japan, 2021; Available online: https:
//www.adb.org/publications/quantifying-economic-and-social-impacts-hsr-evidence-europe-prc (accessed on 5 March 2021).
9. Chen, H.; Sun, D.; Zhu, Z.; Zeng, J. The Impact of High-Speed Rail on Residents’ Travel Behavior and Household Mobility:
A Case Study of the Beijing-Shanghai Line, China. Sustainability 2016, 8, 1187. [CrossRef]
10. World Bank. World Bank Open Data. 2020. Available online: https://databank.worldbank.org/home.aspx (accessed on 31
December 2020).
11. Secondary Analysis of Electronic Health Records; Springer: Basingstoke, UK, 2016. [CrossRef]
12. Beretta, L.; Santaniello, A. Nearest neighbor imputation algorithms: A critical evaluation. BMC Med Inform. Decis. Mak. 2016, 16,
197–208. [CrossRef] [PubMed]
13. Hwang, S.H.; Yoon, C.S.; Ryu, K.N.; Paik, S.Y.; Cho, J.H. Assessment of airborne environmental bacteria and related factors in 25
underground railway stations in Seoul, Korea. Atmos. Environ. 2011, 44, 1658–1662. [CrossRef]
14. Huang, Y.; Lu, S.; Yang, X.; Zhao, Z. Exploring Railway Network Dynamics in China from 2008 to 2017. ISPRS Int. J. Geo-Inf. 2018,
7, 320. [CrossRef]
15. Zemp, S.; Stauffacher, M.; Lang, D.J.; Scholz, R.W. Classifying railway stations for strategic transport and land use planning:
Context matters! J. Transp. Geogr. 2011, 19, 670–679. [CrossRef]
16. Akoglu, H. User’s guide to correlation coefficients. Turk. J. Emerg. Med. 2018, 18, 91–93. [CrossRef] [PubMed]
17. Yao, E.; Morikawa, T. A study of an integrated intercity travel demand model. Transp. Res. Part A Policy Pract. 2005, 39, 367–381.
[CrossRef]
18. Central Japan Railway Company. Available online: https://global.jr-central.co.jp/en/company/ir/annualreport/ (accessed on
3 April 2021).
19. EAST Japan Railway Company. Available online: https://www.jreast.co.jp/e/investor/ar/2019/ (accessed on 3 April 2021).
20. WEST Japan Railway Company. Available online: https://www.westjr.co.jp/global/en/ir/library/annual-report/ (accessed on
3 April 2021).
21. Litman, T. Evaluating Transport Economic Development Impacts: Understanding How Transport Policy and Planning Decisions
Affect Employment, Incomes, Productivity, Competitiveness, Property Value and Tax Revenue. Vic. Transp. Policy Inst. 2010.
Available online: http://www.dphu.org/uploads/attachements/books/books_3286_0.pdf (accessed on 4 March 2021).
22. Amano, K.; Nakagawa, D. Study on Urbanization Impacts by New Stations of High-Speed Railway; Korean Transportation Association:
Dejeon City, Korea, 1990.
23. Sinha, K.C.; Labi, S. Social Impacts of Transportation Projects. In Transportation Decision-Making: Principles of Project Evaluation and
Programming; Wiley: Hoboken, NJ, USA, 2007.
24. Okada, H. Features and Economic and Social Effects of The Shinkansen, 30 Years of High-Speed Railways. Jpn. Railw. Transp. Rev.
1994, 3, 9–16.
25. Hirota, R. Present situation and effects of the Shinkansen. Transp. Policy Decis. Mak. 1985, 3, 255-27.
26. Obermauer, J.B. Indirect impacts of high-speed tail: The case of Japan. Transp. Eng. Aust. 2000, 6, 19–31.
27. Spiekermann, K.; Wegener, M. The Shrinking Continent: New Time—Space Maps of Europe. Environ. Plan. B Plan. Des. 1994, 21,
653–673. [CrossRef]Infrastructures 2021, 6, 68 11 of 11
28. Monzon, A.; Hernandez, S.; Cascajo, R. Quality of Bus Services Performance: Benefits of Real Time Passenger Information
Systems. J. Transp. Telecommun. 2013, 14, 155–166. [CrossRef]
29. Jin, F. Infrastructure System and Socio-Economic Spatial Organization; Science Press: Beijing, China, 2013.
30. Debrezion, G.; Pels, E.; Rietveld, P. The impact of railway stations on residential and commercial property value: A meta-analysis.
J. Real Estate Financ. Econ. 2007, 35, 161–180. [CrossRef]
31. Bowes, D.; Ihlanfeldt, K. Identifying the impacts of rail transit stations on residential property values. J. Urban Econ. 2001, 50,
1–25. [CrossRef]
32. Garmendia, M.; Ureña, J.M.; Ribalaygua, C.; Leal, J.; Coronado, J.M. Urban residential development in isolated small cities that
are partially integrated in metropolitan areas by high-speed train. Eur. Urban Reg. Stud. 2008, 3, 265–280. [CrossRef]
33. The United Nations Educational, Scientific and Cultural Organization. One in Every Five Children, Adolescents and Youth Is
Out of School Worldwide. Available online: https://en.unesco.org/news/one-every-five-children-adolescents-and-youth-out-
school-worldwide (accessed on 4 March 2021).
34. Nakamura, H.; Ueda, T. The impacts of the Shinkansen on regional development. In Proceedings of the Fifth World Conference
on Transport Research, Yokohama, Japan, 10 July 1989; Volume 3.
35. Brotchie, J. Fast rail networks and socio-economic impacts. In Cities of the 21st Century: New Technologies and Spatial Systems;
Brotchie, J.F., Batty, M., Hall, P., Newton, P., Eds.; Longman Cheshire: Melbourne, VIC, Australia, 1991; pp. 25–37.
36. Okabe, S. Impact of the Sanyo Shinkansen on local communities. In The Shinkansen High-Speed Rail Network of Japan; Straszak, A.,
Tuch, R., Eds.; Pergamon Press: Oxford, UK, 1980; pp. 11–20.
37. MacDonald, H.; Peters, A.H. Distance and labour force participation: Implications for urban and rural women. In Proceedings of
the Women’s Travel Issues Second National Conference, Baltimore, MD, USA, 23 October 1996.
38. Rungskunroch, P.; Yang, Y.; Kaewunruen, S. Does high-speed rail influence urban dynamics and land pricing? Sustainability 2020,
12, 3012. [CrossRef]
39. Rungskunroch, P.; Jack, A.; Kaewunruen, S. Benchmarking on railway safety performance using Bayesian inference, decision tree
and petri-net techniques based on long-term accidental data sets. Reliab. Eng. Syst. Saf. 2021, 213, 107684. [CrossRef]
40. Dindar, D.; Kaewunruen, S.; An, M. Rail accident analysis using large-scale investigations of train derailments on switches and
crossings: Comparing the performances of a novel stochastic mathematical prediction and various assumptions. Eng. Fail. Anal.
2019, 103, 203–216. [CrossRef]
41. Rungskunroch, P.; Shen, Z.-J.; Kaewunruen, S. Getting it right on the policy prioritisation for rail decarbonisation: Evidence from
whole-life CO2e emissions of railway systems. Front. Built Environ. 2021, 7, 638507. [CrossRef]
42. Kaewunruen, S.; Sussman, J.M.; Matsumoto, A. Grand challenges in transportation and transit systems. Front. Built Environ. 2016,
2, 4. [CrossRef]
43. Sresakoolchai, J.; Kaewunruen, S. Comparative studies into public private partnership and traditional investment approaches on
The High-Speed Rail Project Linking 3 Airports in Thailand. Transp. Res. Interdiscip. Perspect. 2020, 5, 100116. [CrossRef]
44. Liu, R.; Li, D.; Kaewunruen, S. Role of railway transportation in the spread of the coronavirus: Evidence from Wuhan-Beijing
railway corridor. Front. Built Environ. 2020, 6, 590146. [CrossRef]You can also read