Social Media Network Analysis of Academic Urologists' Interaction Within Twitter Microblogging Environment
←
→
Page content transcription
If your browser does not render page correctly, please read the page content below
ORIGINAL RESEARCH
Social Media Network Analysis of Academic
Urologists’ Interaction Within Twitter
Microblogging Environment
Spencer H. Bell,1 Clara Sun,2 Emma Helstrom,1 Justin M. Dubin, 3 Ilaha Isali,4 Kirtishri Mishra,4
Andrew Gianakopoulos,2 Seyed Behzad Jazayeri,6 Mohit Sindhani,7 Lee Ponsky,4 Alexander Kutikov,1
Casey Seideman,8 Andres Correa,1 Diana Magee,1 Laura Bukavina1,3
1
Department of Urologic Oncology, Fox Chase Cancer Center, Philadelphia, United States 2 Case Western Reserve University School of Medicine, Cleveland,
United States 3 Loyola University, Chicago, United States 4 Department of Urology, University Hospitals Cleveland Medical Center, Cleveland, United States
5
Department of Urology, Northwestern University Feinberg School of Medicine, Chicago, United States 6 Department of Urology, University of Florida, Jacksonville,
United States 7 Indian Institute of Technology, Delhi, India 8 Oregon Health and Science University, Portland, United States
Abstract
Objective To characterize academic urology Twitter presence and interaction by subspecialty designation.
Methods Using Twitter application programming interface of available data, 94 000 specific tweets were extracted
for the analysis through the Twitter Developer Program. Academic urologists were defined based on American
Urological Association (AUA) residency program registration of 143 residency programs, with a total of 2377
faculty. Two of 3-factor verification (name, location, specialty) of faculty Twitter account was used. Additional
faculty information including sex, program location, and subspecialty were manually recorded. All elements of
microblogging were captured through Anaconda Navigator. Analyzed tweets were further evaluated using natural
language processing for sentiment association, mentions, and quote tweeted and retweeted. Network analysis based
on interactions of academic urologist within specialty for given topic were analyzed using D3 in JavaScript. Analysis
was performed in Python and R.
Results We identified 143 residency programs with a total of 2377 faculty (1975 men and 402 women). Among all
faculty, 945 (39.7%) had registered Twitter accounts, with the majority being men (759 [80.40%] versus 185 [19.60%]).
Although there were more male academic urologists across programs, women within academic urology were more
likely to have a registered Twitter account overall (46% versus 38.5%) compared with men. When assessing registered
accounts by sex, there was a peak for male faculty in 2014 (10.05% of all accounts registered) and peak for female
faculty in 2015 (2.65%). There was no notable change in faculty account registration during COVID-19 (2019–2020). In
2022, oncology represented the highest total number of registered Twitter users (225), with the highest number of total
tweets (24 622), followers (138 541), and tweets per user per day (0.32). However, andrology (50%) and reconstruction
(51.3%) were 2 of the highest proportionally represented subspecialties within academic urology. Within the context
of conversation surrounding a specified topic (#aua21), female pelvic medicine and reconstructive surgery (FPMRS)
and endourology demonstrated the total highest number of intersubspecialty conversations.
Conclusions There is a steady increase in Twitter representation among academic urologists, largely unaffected by
COVID-19. While urologic oncology represents the largest group, andrology and reconstructive urology represent
the highest proportion of their respective subspecialties. Interaction analysis highlights the variant interaction among
subspecialties based on topic, with strong direct ties between endourology, FPMRS, and oncology.
Key Words Competing Interests Article Information
Twitter, social media, sex, specialty, None declared. Received on October 15, 2022
technology, urology Accepted on January 18, 2023
This article has been peer reviewed.
Soc Int Urol J. 2023;4(2):96–104
DOI: 10.48083/TKEK6928
This is an open access article under the terms of a license that permits non-commercial use, provided the original work is properly cited.
© 2023 The Authors. Société Internationale d'Urologie Journal, published by the Société Internationale d'Urologie, Canada.
96 SIUJ • Volume 4, Number 2 • March 2023 SIUJ.ORG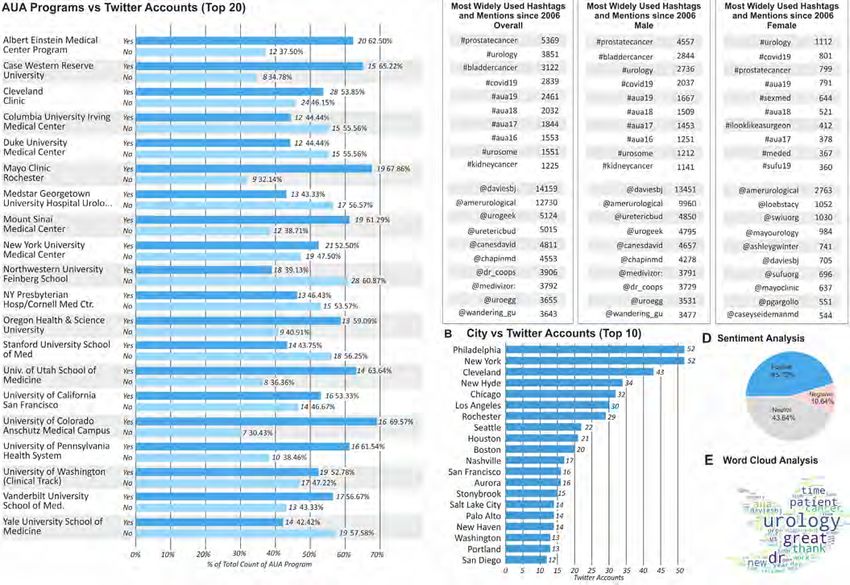
Social Media Network Analysis of Academic Urologists’ Interaction Within Twitter Microblogging Environment

                                                                     recorded from their respective websites. Faculty Twitter
   Abbreviations                                                     account was verified via a 2-factor verification process
   API application programming interface
                                                                     (name plus location) in addition to automated Twitter
                                                                     match. Transplant was not included in some analyses
   AUA American Urological Association
                                                                     because of the low number of participating faculty
   FPMRS female pelvic medicine and reconstructive surgery
                                                                     on Twitter, while fellowship-trained sexual medicine
   SoMe social media                                                 faculty was included in the andrology group.
                                                                     Collection of Twitter information
Introduction                                                         Collection of relevant tweets from 2006 until March
The use of social media (SoMe), specifically Twitter, as             2022 was performed. The Twitter streaming application
a professional platform is increasingly common among                 programming interface (API) dataset creation has
healthcare workers, including urologists[1]. Urology                 previously been described[1]. Brief ly, tweets were
residents, medical students, programs, journals, and                 collected using Twitter Streaming API using Python
faculty have used Twitter to advertise virtual events, gain          (v3.10.8). All tweets from predesignated academic faculty
information for the match process, form mentorships,                 were used for analysis. In addition, all accounts followed
promote publications, and share clinical information.                by the user (following), accounts following the user
The circumstances imposed by the COVID-19 pandemic                   (followers), timelines, and geographic location (when
catalyzed the increasing use of Twitter among the                    available from Twitter privacy setting) were collected
urological community[2]. The geographical and physical               using rtweet (R version 4.2.2). Further information and
limitations spurred by the pandemic resulted in both                 code regarding extraction of user-specific data can be
academic programs and students alike having to adopt                 found here (https://github.com/ropensci/rtweet/)[3].
new approaches for communication with a focus on                     After data preprocessing, relevant tweets were selected
SoMe.                                                                and analyzed. Tableau Desktop was fed into CSV and
                                                                     Excel files for data visualization.
   The dramatic reduction of clinical and research
activities within the medical and surgical departments               Natural language processing (NLP) pipeline
during COVID-19, coupled with virtual electives and                  All elements of microblogging, including retweets, likes,
conferences, have all posed important implications                   followers, following, sentiment, hashtags, and mentions
within academics. Furthermore, the current land-                     were captured through Anaconda Navigator. Full-text
scape of Twitter use among academic urology faculty                  tweets were preprocessed by converting the sentences
at accredited US institutions has yet to be assessed.                into words (Tokenization) and removing unnecessary
Given the heavy reliance on virtual interaction during               punctuations, tags, and stop words that do not have a
the pandemic and the active role that SoMe plays, our                specific semantic meaning (“the,” “are”). Preprocessing
study aims to characterize the state of Twitter use among            was done using the Natural Language Toolkit (NLTK)
current academic urology faculty. As Twitter offers                  on Python (v3.10.8).
an information-rich reservoir created by the urologic
academic community, the interactions among users                     Sentiment analysis
shape complex network structures that have not been                  Following processing of tweets and removal of
previously evaluated. The aim of our study was to char-              duplicates and unnecessary punctuations, all tweets
acterize the currently academic urology Twitter presence             were split into 3 data frames based on sentiment
by sex and specialty. We hypothesize that while urologic             (neural, negative, and positive). Sentiment analysis
oncology represents the total largest number of Twitter              refers to identifying and classifying tweets that are
participants within urology, there is a growing trend                expressed in text using the machine learning sentiment
among other subspecialties of urology, with an increas-              analysis model to compute users’ perception. Sentiment
ing number of interactions.                                          analysis was done using (https://github.com/yalinyener/
                                                                     TwitterSentimentAnalysis) package in Python (v3.10.8).
Materials and Methods                                                Twitter interaction analysis
Data source                                                          While the rtweet package allows for downloading
Data collection occurred from May 2021 to March 2022.                tweets and stream API, extraction of tweets relevant
A list of accredited US urology residency programs                   to a topic at hand (designated around a hashtag #),
was pulled from the American Urological Association                  followed by building of interaction centered around
(AUA). All MD/DO faculty associated with the US                      users (nodes), was performed via twinetverse in R
urology residency program and academic centers                       and is freely available here (http://graphtweets.john-
were included in the study. Information including                    coene.com/). Each interaction consists of a source and
sex, program location, and subspecialty training were                a target; in other words, the source is the screen name

SIUJ.ORG      SIUJ   •   Volume 4, Number 2   •   March 2023                                                                 97
ORIGINAL RESEARCH

(faculty), the user who posted the tweet, while target is     Among men, andrology (48.59%), reconstruction
the users who were tagged or interacted with the tweet.       (48.56%), and oncology (48.33%) had the highest propor-
This type of analysis allowed for interaction factor          tion of registered user accounts. General urology for
between subspecialties (grouped faculty) based on topic       both female (19.67%) and male faculty (17.86%) had the
of discussion. Although we chose to group based on            lowest Twitter representation (Figure 1). When compar-
urologic subspecialty, this analysis can be user specific     ing female and male Twitter representation within each
or topic specific. Interaction analysis was depicted as       specialty, female faculty had the highest representation
the number of interactions between the subspecialties         in female (45.77%), pediatric (28.29%), and reconstruc-
only, and no regression analysis was performed to test        tive (24.59%) urology, while male faculty had the high-
for statistical significance as interaction is dependent on   est representation in oncology (93.30%), and robotics
the topic.                                                    (91.85%) (Figure 1).
Statistical analysis                                          Program representation
Demographics were summarized using descriptive                When assessing program representation, The University
statistics. The categorical variables are presented as        of Colorado (69.57%), Mayo Clinic Rochester (67.86%),
counts and percentages and were compared using a              and Case Western Reserve (65.22%) had the most faculty
chi-square test. The continuous variables are expressed       on SoMe, proportional to the size of their program
as means (standard deviation [SD]) or medians                 (Supplementary Appendix Figure S1). The 5 cities
(interquartile range [IQR]). All statistical analyses were    with the highest overall Twitter representation were
conducted by a statistician (M.S.) and cross referenced       Philadelphia (52; 5.50%), New York (5.50%), Cleveland
by a physician (L.B.) using R version 4.0.4. All tests were   (43; 4.55%), New Hyde (34; 3.59%), and Chicago
2-sided with statistical significance defined by P < 0.05.    (32; 3.38%) (Supplementary Appendix Figure S1).
All visualizations were performed by Tableau Desktop
                                                              Twitter activity
and Corel Draw.
                                                              The top 5 words by occurrence since 2006 were “urology”,
                                                              “dr”, “great”, “aua”, and “cancer” (Supplementary
Results
                                                              Appendix Figure S1). The most frequently used
Demographics                                                  hashtags used by academic faculty users on Twitter were
We identified 143 residency programs through the              #prostatecancer (5369), #urology (3851), #bladdercancer
AUA website with a total of 2377 faculty (1975 men            (3122), and #covid19 (2839) (Supplementary Appendix
and 402 women). Among all faculty, 945 (39.75%) had           Figure S1). The top 3 mentions were @daviesbj (14 159),
registered Twitter accounts, with the majority being men      @amerurological (12 730), and @urogeek (5124). Overall,
(760 [80.42%] versus 185 [19.58%]). However, while the        45.72% of all tweets were considered positive, while
overall number of male academic urologists was higher,        43.64% were neutral, and 10.64% were negative.
proportionally, female urologists were more likely to
have a registered Twitter account (46 % versus 38.5%)            Sex-specific differences were observed. Although the
(Figure 1).                                                   top 2 hashtags among female academic urologists were
                                                              #urology (1112) and #covid19 (801), women were more
   The percentage of new Twitter accounts created from        likely to mention other female urologists including @
2006 to October 2021 stratified by sex was similarly          loebstacy (1052), @ashleywinter (741), and caseyseid-
assessed (Figure 1). Overall, there were more male than       man (544) compared with male faculty (Supplementary
female accounts registered for every year, with a peak for    Appendix Figure S1).
male faculty in 2014 (10.05% of all accounts registered)
and peak for female faculty in 2015 (2.65% of all accounts       The “sentiment” distribution across tweets by male
registered). Conversely, there was no notable change          and female faculty was different, with female faculty
during the COVID-19 (2019–2020) peak epidemic.                noted to tweet more “positively” than male faculty
                                                              (48.50% versus 45.08%), although the difference was not
   Faculty fellowships were categorized into andrology,       statistically significant (chi-square, P = 0.4) (Figure 1).
endourology, female pelvic medicine and reconstruc-
tive urology (FPMRS), general, oncology, pediatrics,          Subspecialty analysis
reconstruction, robotics, and transplant. Consistent          As previously hypothesized, urologic oncology
with AUA census, there are fewer female urologists            represented the largest overall subspecialty on Twitter,
across all fellowships compared with male urologists.         with the total number of active members of 225. The
Sex differences among fellowship training and SoMe use        subspecialty also represented the highest tweets per
were also evident. For female faculty, andrology (60%),       day per user (0.32) and total tweets per day (73.72) and
reconstruction (60%), and endourology (58.06%) had the        the highest total followers (333 951) and likes (143 261).
highest proportion of Twitter representation (Figure 1).      Andrology and pediatric urology represented the
                                                              second-highest group among the subspecialties for tweet

98                                                                         SIUJ   •   Volume 4, Number 2   •   March 2023   SIUJ.ORG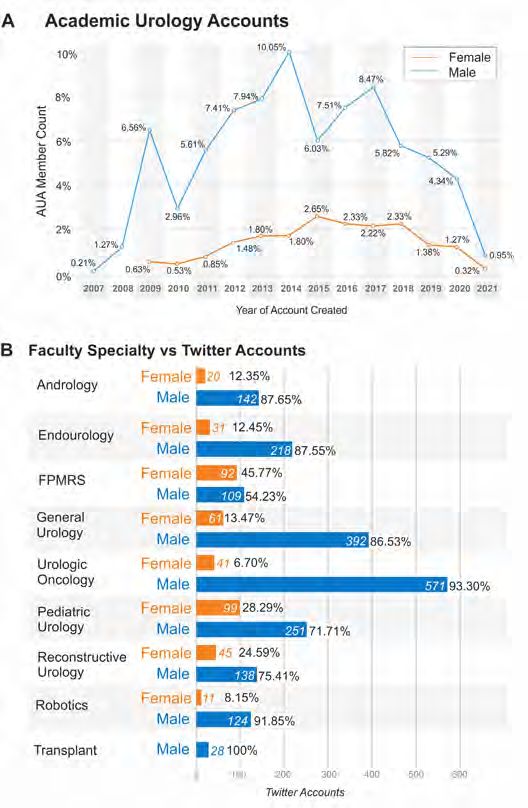
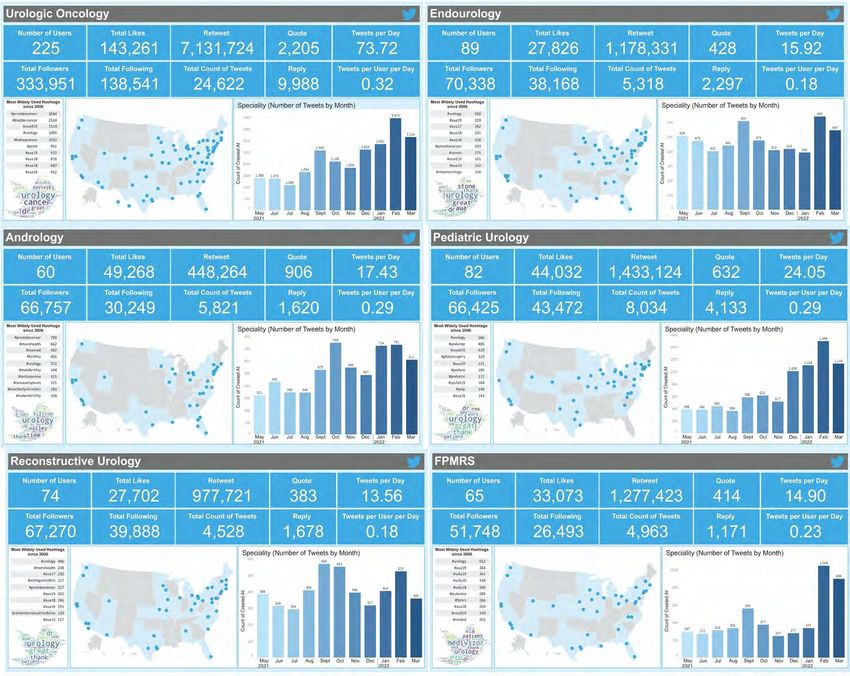
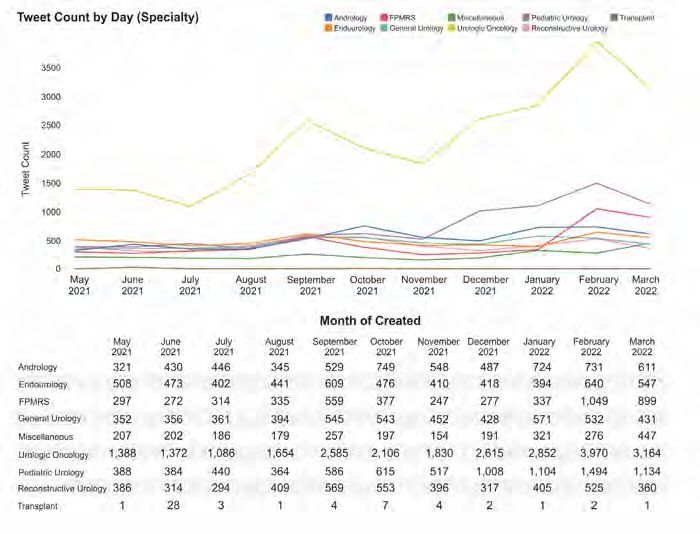
Social Media Network Analysis of Academic Urologists’ Interaction Within Twitter Microblogging Environment

FIGURE 1.
General Twitter presence and number of user accounts from 2007 to 2021. Academic Urology Twitter presence is
shown by number of Twitter accounts by year (A) stratified by male vs female. In addition, total Twitter academic
urology presence is broken down by specialty and gender (B). Overall academic Twitter presence based on gender
can be seen in C, showing overall percentage of Twitter accounts (top) and broken down by proportion of all
academic urologist (bottom). (D). Sentiment analysis designated as neutral, negative or positive from each users’
tweets, with birdgram representative of most commonly utilized words within the tweets corresponding to
the size of the word

per user per day (0.29) and similar number of followers              Twitter network interaction analysis among
(66 757 versus 66 425); however, pediatric urology was               subspecialties
more likely to retweet a post than andrology (1 433 124              We assessed urology subspecialty interaction on Twitter
versus 448 264) (Figure 2).                                          by counting the total number of interactions between
   When assessing temporal trends across specialties                 specialties centered around the hashtags: #aua21,
by month and day, urologic oncology represented the                  #auamatch, and #urosome. Although any hashtag can
highest tweet count overall, with peaks in September                 be used for the interaction analysis, we chose these
2021 (529), January 2022 (724), and February 2022 (731).             particular “specialty neutral” hashtags to visualize
January and February corresponded to similar trends                  active direct communication. While urologic oncology
among other specialties likely reflecting AUA match,                 consistently interacted with other subspecialties most
while many specialty meetings corresponded to peaks in               frequently due to the total number of participants within
activity. Overall, Monday represented the lowest activ-              urologic oncology (ie, 39 interactions with FPMRS),
ity day on average, with Twitter activity increasing from            when assessing global proportional interaction, FPMRS
Thursday and peaking on Friday night (Figure 3).                     represented the most diverse interaction network.

SIUJ.ORG      SIUJ   •   Volume 4, Number 2   •   March 2023                                                                99
ORIGINAL RESEARCH
FIGURE 2.
Twitter profiles of urologic subspecialties on Twitter. Hashtag results based on 2006 to present analysis, remainder
of the reported features reflective of May 2021 to March 2022 data
As seen in Figure 4, conversations focused within a Twitter usage among urologists, prompted by different
subspecialty were also more likely to be seen within incentives. Urologists in the US and Canada who were in
urologic oncology (visualized as blind ending blue lower academic ranking and had higher H-indices were
node). While this interaction improved with #urosome more likely to have Twitter accounts[4].
and #auamatch, the interactions as seen in Figure 4 are
topic dependent, with more interactions seen between The challenges imposed by COVID-19 limited in-
andrology and urologic oncology with #urosome than person interactions, forcing the medical community
the other 2 topics. Overall, pediatric urology and FPMRS to embrace other forms of communication. Although
did highlight more interactive ties compared with other we did not see any notable changes in the number of
subspecialties. registered accounts for faculty during COVID-19
(2019–2020), there was a significant jump in urology
Discussion program account creation in 2020, the largest increase
since 2009[5].
The steady increase in Twitter representation among
academic urologists since 2006 reflects the increasing While the majority of Twitter representation is largely
awareness of Twitter as a means of academic repre skewed toward male faculty, we found a steady increase
sentation and promotion among individual programs in female faculty representation across all urology
and faculty. A recent study has also found increasing subspecialties over the past 16 years. Proportionately,
100 SIUJ • Volume 4, Number 2 • March 2023 SIUJ.ORG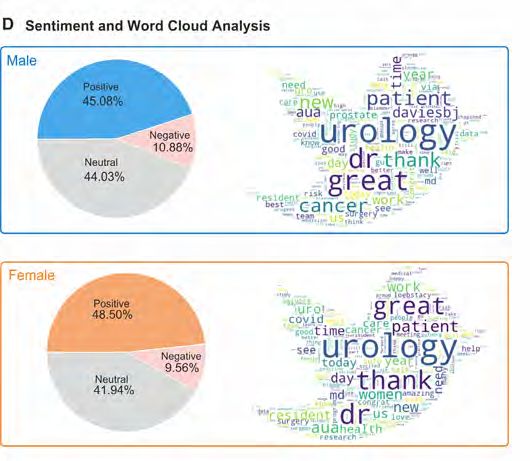
Social Media Network Analysis of Academic Urologists’ Interaction Within Twitter Microblogging Environment

FIGURE 3.
Temporal distribution of online Twitter activity by day and month, further categorized by sub-specialty
within urology

more female urologists use Twitter. This might be an                 also more likely to mention or tweet to a male and female
effort of female urologists to build their professional              urologist on Twitter, while male academic urologists
reputation and to inspire other aspiring female surgeons.            limited their interaction to male colleagues as evidenced
Besides the goal of improving healthcare, Twitter pres-              by top mentions. This finding is not unique to urology.
ence has been shown to increase industry support,                    In a recent study by Zhu et al., which evaluated a total
with surgeons with an active Twitter account receiving               of 3148 health services researchers on Twitter, women
1.7 times the amount in payments compared with                       were more likely to follow other women (54.8% of users
surgeons without an active account. Furthermore,                     followed by women were women, whereas 42.6% of users
among Twitter users, those with 321 to 172 000 followers             followed by men were women)[7]. Academic urologists
received 4.7 times and 9.5 times the amount in payments              fellowship trained in andrology, reconstruction, endou-
compared with those with 0 to 80 followers[6].                       rology, and oncology had the most Twitter represen-
                                                                     tation. This is supported by data previously published,
  One of the top hashtags used by female faculty, but                showing that physicians in the US and Canada trained
not in the top for male faculty, was #ilooklikeasurgeon.             in urological oncology, minimally invasive urology,
The sex differences in Twitter activity highlight how                and endourology were more likely to have Twitter
academic female urologists use SoMe as a platform for                accounts[4]. One possible explanation for the high
advocacy and cultural change initiatives. Women were                 percentage of andrology faculty could be attributed to

SIUJ.ORG      SIUJ   •   Volume 4, Number 2   •   March 2023                                                               101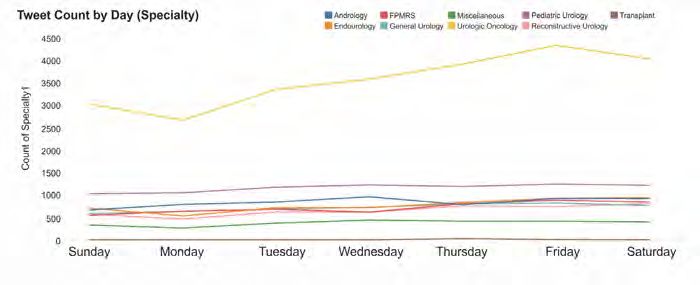
ORIGINAL RESEARCH

FIGURE 4.
Interaction analysis based on subspecialty direct interaction with others on three different topics including #aua21,
#auamatch, and #urosome. Interaction tables represent the number of direct conversations between members of
each subspecialty focused on the topic at hand

the stigma inherent to the topics within the subspecialty,   as a source of information on COVID-19. Valdez et al.
such as sexual health and male infertility. Because these    showed that Twitter volume increased consistently from
conversations may be difficult for patients to discuss       early to late March 2020, around when COVID-19 was
openly, andrology faculty are likely using SoMe as an        declared a global pandemic[10].
advocacy platform.
                                                                Our study is unique in that compares direct interac-
   The most frequently used hashtags by academic urol-       tion among subspecialties within academic urology on
ogists were dedicated hashtags created for annual AUA        Twitter. While previous research has focused mainly on
conferences. These hashtags not only organize posts          trends of utilization and growth, our innovative anal-
associated with a certain conference but also reflect the    ysis fostered by information networks and a novel API
increasing use of Twitter during medical conferences.        network, highlights the communication and engage-
In a 2017 survey of AUA members, a third of the 1280         ment among the subspecialties. Based on our findings,
respondents with SoMe accounts reported following a          we can establish that virtual interaction on Twitter is
medical conference virtually[8]. The 2018 AUA annual         dependent upon the topic; however, strong intersubspe-
conference had a significant, 5-fold increase in Twitter     cialty ties are seen from FPMRS and pediatric urology.
posts compared to 2013[9]. Another hashtag that              As we previously mentioned, while it may seem that
dramatically increased in occurrence was #covid19. In        urologic oncology by number alone had the highest
just over 2 years, #covid19 surpassed others as one of the   level of interaction, proportionally, FPMRS and pedi-
top 5 most frequently used hashtags in the past 16 years.    atric urology were more likely to engage other subspe-
This likely reflects the increased consumption of SoMe       cialties. It is unclear why this network structure exists,

102                                                                       SIUJ   •   Volume 4, Number 2   •   March 2023   SIUJ.ORG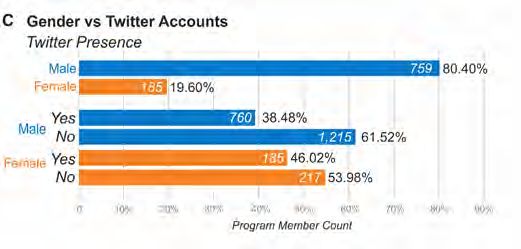
Social Media Network Analysis of Academic Urologists’ Interaction Within Twitter Microblogging Environment

and the implications of this type of interaction; however,                   Conclusion
a higher level of interaction is more likely to spread to                    Our research indicated that there is a growing
other networks and enhance the spread of information                         representation of women in the field of academic urology
(ie, reach more users).                                                      on the social media platform Twitter. This presence
Our study is not without limitations. We analyzed only                       offers opportunities for enhanced communication and
academic urologists. Thus, urologists who work in                            connection within the field. Furthermore, the study
private practice or other non-academic institutions were                     revealed variations in interactions between various
not able to be accounted for. There are many urologists                      subspecialties within urology, with FPMRS and
on social media who were not included in the analysis                        pediatric urology found to have a notable higher level
but represent an integral role in advocacy and growth of                     of intersubspecialty engagement compared with other
urologic knowledge (eg, Ashley Winter). Furthermore,                         subspecialties.
faculty designation to subspecialty was based on
urologists’ academic institution information, and while
most were able to be categorized into a subspecialty, the
process was dependent on the accuracy of information
listed by the institution.

References
  1. Bukavina L, Dubin J, Isali I, Calaway A, Mortach S, Loeb S, et al.       6. Storino A, Vigna C, Polanco-Santana JC, Park E, Crowell K, Fabrizio
     Twitter footprint and the match in the COVID-19 era: understanding          A, et al. Disparities in industry funding among colorectal surgeons:
     the relationship between applicant online activity and residency            a cross-sectional study. Surg Endosc.2022;36(9):6592–6600. doi:
     match success. Urol Pract.2022;9(4):331–339. doi: 10.1097/                  10.1007/s00464-022-09062-8. PMID: 35103858.
     UPJ.0000000000000306.
                                                                              7. Zhu JM. Pelullo AP, Hassan S, Siderowf L, Merchant RM, Werner RM.
  2. Prunty M, Rhodes S, Mishra K, Gupta S, Sheyn D, Ponsky L, et al.            Gender differences in Twitter use and influence among health policy
     Female authorship trends in urology during the COVID-19 pandemic.           and health services researchers. JAMA Intern Med.2019;179(12):1726–
     Eur Urol.2021;79(2):322–324. doi: 10.1016/j.eururo.2020.11.017. PMID:       1729. doi: 10.1001/jamainternmed.2019.4027. PMID: 31609393.
     33250302.
                                                                              8. Loeb S, Carrick T, Frey C, Titus T. Increasing social media use in
  3. Kearney MW. rtweet: collecting and analyzing Twitter data. J Open           urology: 2017 American Urological Association survey. Eur Urol
     Source Softw.2019;4(42):1829. doi: 10.21105/joss.01829.                     Focus.2020;6(3):605–608. doi: 10.1016/j.euf.2019.07.004. PMID:
                                                                                 31351900.
  4. Chandrasekar T, Goldberg H, Klaassen Z, Wallis CJD, Leong JY,
     Liem S, et al. Twitter and academic urology in the United States and     9. Ho P. Margolin E, Sebesta E, Small A, Badalato GM. #AUAMatch:
     Canada: a comprehensive assessment of the Twitterverse in 2019.             the impact of COVID-19 on social media use in the urology residency
     BJU Int.2020;125(1):173–181. doi: 10.1111/bju.14920. PMID: 31602782.        match. Urology.2021;154:50–56. doi: 10.1016/j.urology.2021.05.019.
                                                                                 PMID: 34033828.
  5. Manning E, Calaway A, Dubin JM, Loeb S, Sindhani M, Kutikov A, et al.
     Growth of the Twitter presence of academic urology training programs    10. Valdez D, Ten Thij M, Bathina K, Rutter LA, Bollen J. Social
     and its catalysis by the COVID-19 pandemic. Eur Urol.2021;80(2):261–        media insights into US mental health during the COVID-19
     263. doi: 10.1016/j.eururo.2021.05.002. PMID: 34006446.                     pandemic: longitudinal analysis of Twitter data. J Med Internet
                                                                                 Res.2020;22(12):e21418. doi: 10.2196/21418. PMID: 33284783.

SIUJ.ORG        SIUJ   •   Volume 4, Number 2   •   March 2023                                                                                   103
ORIGINAL RESEARCH SUPPLEMENTARY APPENDIX FIGURE S1. AUA programs faculty Twitter presence, listing of top 10 programs with percent of total faculty (A), as well as total number of registered academic Twitter accounts by city (B). C-D representing overall, male and female specific hashtags and mentions from 2006 to present by faculty, with overall sentiment analysis shown in D and most commonly utilized words (E) 104 SIUJ • Volume 4, Number 2 • March 2023 SIUJ.ORG
You can also read