Social Integration Measurement of Inhabitants in Historic Blocks: The Case of Harbin, China - MDPI
←
→
Page content transcription
If your browser does not render page correctly, please read the page content below
sustainability

Article
Social Integration Measurement of Inhabitants in
Historic Blocks: The Case of Harbin, China
Zihan Cai 1,2 and Ming Lu 1,2, *
 1    School of Architecture, Harbin Institute of Technology, Harbin 150006, China; 13B334015@hit.edu.cn
 2    Heilongjiang Cold Region Urban-Rural Human Settlements Science Key Laboratory, No. 66 Xidazhi St.,
      Harbin 150006, China
 *    Correspondence: hitlm1969@hit.edu.cn; Tel.: +86-0451-8628-1137

 Received: 5 July 2018; Accepted: 8 August 2018; Published: 9 August 2018

 Abstract: The inhabitants of historic blocks require more social and planning consideration. A basic
 means to achieve inclusive planning and social sustainability in such areas is to quantitatively study
 the social integration of their inhabitants. Based on social survey data for the inhabitants of Harbin’s
 Central Street and DaoWai historic block in China, this paper establishes the measurement factors that
 affect inhabitant social integration to construct a measurement model. Statistical analysis is performed
 using exploratory factor analysis (EFA) and confirmatory factor analysis (CFA). The analysis results
 reveal five dimensions of inhabitant social integration: behavioral integration, cultural integration,
 industrial integration, spatial integration, and management integration. Subsequently, the statistical
 scores for social integration and related factors are calculated. The empirical results indicate that the
 level of the inhabitant social integration has an impact on the vitality and sustainable development
 of the blocks. The social integration score of the inhabitants of Central Street is higher than that of
 the inhabitants of the DaoWai historic block. Among the five dimensions, the industrial integration
 level of Central Street is the highest, whereas the spatial integration level of DaoWai historic block
 is the highest. The level of management integration is the lowest for both blocks. The difference in
 the levels of industrial integration between the two blocks is the highest, and cultural integration
 is the lowest. Comparing the status quo of the two blocks, the paper concludes that the promotion
 of inhabitant social integration requires enhancing the dimensions with lower measurement scores
 according to the specific conditions of the block. In this manner, a fundamental theory for a socially
 inclusive revitalization of historic blocks is established, thus to enhance social sustainability.

 Keywords: social integration measurement; inhabitant; historic blocks; Harbin; China

1. Introduction
     As urbanization accelerates, the social economy, financial resources and the environment are
entering a new period with new demands. Equality and social justice have become prominent issues
in social development. As a special spatial type within the city, the historic block possesses diversified
features. It is not only a space for the development of urban tourism but also a living space that
preserves historic charm and cultural sentiment.
     At present, due to pursuing the maximization of economic benefits, the interests of inhabitants
are generally ignored during the development of historic blocks. As a result of a primarily economic
motivation, the reconstruction and renovation of historic districts have not succeeded in addressing
the social inclusion of inhabitants and the sustainability of blocks. More social consideration is needed,
including a fair right to discourse [1], protection of the rights and interests of life [2], the sharing
of public space, and more attention to the planning and construction of cities [3]. Conflicts and
contradictions between inhabitants’ lifestyle and tourism business activities are present in China’s

Sustainability 2018, 10, 2825; doi:10.3390/su10082825                       www.mdpi.com/journal/sustainability
Sustainability 2018, 10, 2825                                                                        2 of 19

historic blocks. Many urban historic districts appear hollowed out. In addition to public holidays and
daytime business hours, there are active commercial tourism activities. These hollowed historic blocks
are defined by a lack of popularity and daily activities, which leads to a lack of vitality that cannot
meet the requirements of sustainable development and the increasing demand for tourist experiences.
From the perspectives of public participation and equitable sharing, the interests of inhabitants and
social integration issues continue to require resolution.
      In recent years, the social issues faced by historic district inhabitants have attracted attention
in various areas, including urban planning, sociology, and public health. The academic community
has gradually gained insight into the perspective of inhabitants. A number of scholars argue that
it is necessary to ensure the retention rate of these inhabitants and to preserve and protect their
lifestyles [1,4]; cultural inheritance is preserved if it sustains the historic and cultural elements [5,6].
Decisions that affect the social integration of low- and middle-income earners require a scientific
basis that reflects the goals fairness and a reasonable allocation of resources [2,7]. Scholars have
attempted to address the question of sustainable renovation through resident perception surveys
and typological methods [8,9]. Most studies are more inclined to focus on policy mechanisms,
public participation evaluation, and resident perception surveys. Researchers have suggested that
effective mechanisms should be adopted to resolve conflicts of interest and decrease the power gaps
among stakeholders [10]. The primary mechanism should be public participation evaluation, including
mutual trust, equal speaking rights, public interest, and feedback communication [11]. Scholars have
verified that the authenticity of the inhabitants’ lifestyle, public participation, and the residents’ role
affect the image and development of tourism destinations [12,13]. Other scholars have studied the
satisfaction of residents through comprehensive methods, such as city landscape surveys, stakeholder
interviews, and property rights sales evaluation [14]. Studies have investigated the planning and
development of historic districts from the perspective of inhabitants. However, there is a lack of
research on how to quantify inhabitant social integration.
      Social integration became the core concept of Western social policy research and practice
in the early 21st century and has been widely addressed by government agencies, social policy
researchers, and decision-makers. Social integration is defined as participation in a broad range
of social relationships [15]; it is not a one-way effort but instead involves different social groups
for mutual adaptation with the common goal of collaboratively and constructively shaping future
life [16]. Furthermore, social integration is known to positively affect quality of life and health
outcomes [17]. Many scholars believed that it can serve as a source of social stress and motivation to
promote people’s mental health [18–21], reflected in the interrelationship between the interdependent
system of community participation and community integration as a very important measure of social
integration [22].
      Social integration is an abstract concept in theory. It can be used to quantify a current situation
and its development level. It is an analytical tool for research on social development [22]. With the
development of the theory, developing the distinction between objective and subjective index systems,
social integration and social exclusion became the new perspectives from which to measure social
integration [23]. Zhou proposed that only the index system was unified, consistent, and theoretically
corresponded to effective measurement (including the design of the questionnaire and subsequent
analysis); this index gives the research comparability (it can reflect the similarities and differences
between regions and different populations) to reflect the dynamic change of this concept [24].
The measurement of social integration was pioneered by Park and Burgess, who proposed four
measurement dimensions: economic competition, political conflict, social connection, and cultural
integration [25]. Landecker divided these measurement dimensions into cultural integration,
communicative integration, functional integration, and normative integration [26]. Subsequently,
many sociological researchers subdivided their classification systems. In 2001, the Social Protection
Committee of the European Union proposed 18 measurement indicators grouped into four major
systems: integration indicators, pension indicators, health indicators, and long-term care indicators [27].
Sustainability 2018, 10, 2825                                                                        3 of 19

The commonly used measures include the size of the network, frequency of contact with network
members, and membership in a formal or informal group [28]. Western research has primarily
focused on immigration and ethnicity [29], including measurement dimensions such as social, political,
cultural, and economic integration [30,31]. Measurement research in China has focused on migrant
workers, floating populations, new urban immigrants, and other groups [32–35]. Topics have included
economic integration [35,36], psychological integration [37,38], cultural integration [27,39], identity
integration [31–35], and community integration [40]. There has been little research on the inhabitants
of historic districts. The social culture of such inhabitants differs from that of the international
immigrants or domestic floating population who also reside in such districts. However, the social
vulnerability of the former group during block reconstruction resembles that of the other transient
groups such as the new urban immigrants; they each face similar challenges to their socioeconomic
status. Therefore, the measurement of inhabitant social integration can draw on the dimensions of
measurement established for similar groups.
      In this paper, the two largest historic blocks in Harbin of Heilongjiang Province in China that
have the most inhabitants were selected as the research area. After the renewal of the material space,
a distinct difference between the vitality of the two blocks emerged. From a sociological perspective,
this study investigates whether differences in the sustainable vitality of the neighborhoods are due to
differences in the level of social integration of the inhabitants. The purpose and objective of this study
is to solve the “host and guest conflict” between the lifestyle of the inhabitant and the tourist trade in
the historic blocks, as well as to improve the level of social integration.
      To quantify the social integration of inhabitants of historic districts and thus help sustain the
vitality of such areas while enhancing social sustainability, this paper constructs a theoretical model
to measure inhabitant social integration. The paper adopts exploratory factor analysis (EFA) from
Statistical Product and Service Solutions (SPSS) and confirmatory factor analysis (CFA) from the
Structural Equation Model (SEM) to statistically analyze survey data of the inhabitants of Harbin’s
Central Street and DaoWai historic and cultural blocks in China. In addition, we quantitatively study
the factors that influence inhabitant social integration and factor weight to create a model to measure
the social integration of the inhabitants of the historic blocks. The comprehensive social integration
scores and the scores for each dimension are calculated to perform a comparative analysis of the
revitalization of these two historic blocks in Harbin.
      According to results, we can intuitively represent the overall level and dimension of the social
integration of inhabitants in the historic blocks. Compared to the present situation, it is suggested that
the planning should focus on improving the low score of the measurement results to better promote
the development of the inhabitant social integration in the historic blocks.

2. Methodology

2.1. Measurement Dimensions and Indicator Selection
     There has been no unified view regarding the measurement of social integration. The research has
primarily targeted a single research object and discussed its specific influencing factors. The selection
of indicators to measure the social integration of the inhabitants of historic districts is mainly based on
those applied to urban new immigrants [38] and with reference to the Sydney Urban Frontier Project
(UFP) [41], which aimed to improve the circumstances of socially vulnerable urban groups. To assess
the social issues faced by historic block inhabitants in Harbin, a social integration measurement model
with five dimensions was constructed: behavioral integration [35], cultural integration [31], industrial
integration [38], spatial integration [42–45], and management integration [27]. Based on a literature
review and considering the special conditions of the inhabitants of Harbin’s historic blocks, we initially
selected 21 measurement indicators (see Figure 1).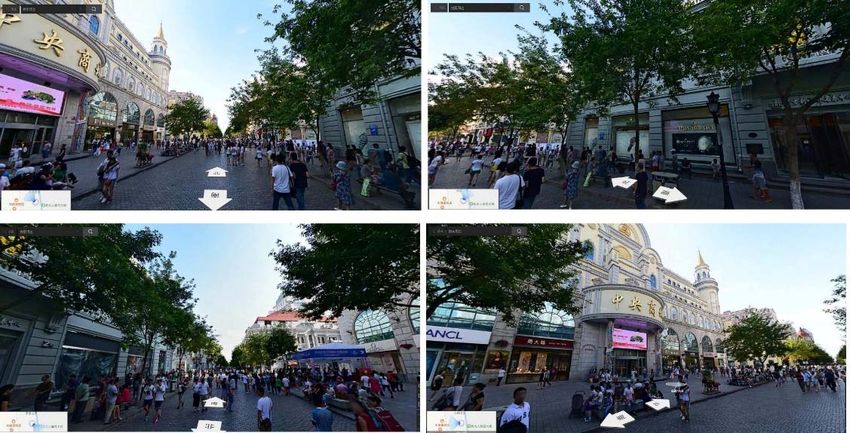
Sustainability 2018, 10, 2825 4 of 19
Sustainability 2018, 10, x FOR PEER REVIEW 4 of 19
Figure 1. Primary Selection of Social Integration Measurement Dimension and Indicators.
Figure 1. Primary Selection of Social Integration Measurement Dimension and Indicators.
(1) Behavioral integration. This dimension includes interpersonal communication, living habits,
(1) Behavioral
and social behaviorintegration.
[35]. Here, This dimension
we primarily includes
draw interpersonal
on dimensions andcommunication,
indicators of social living habits,
behavior
and social behavior [35]. Here, we primarily draw on dimensions and
applied in the international migration integration index [35] and establish three measurement indicators of social behavior
applied in neighborhood
indicators: the international migration integration
communication, index [35]networks,
social community and establish three measurement
and social psychological
distance. In addition, to assess the disturbance caused by tourism activities for the psychological
indicators: neighborhood communication, social community networks, and social historic block
distance. Inwe
inhabitants, addition,
designed to aassess
novelthe disturbance
indicator: caused
external by tourism activities for the historic block
disturbance.
inhabitants, we designed
(2) Cultural integration.a novel
This indicator:
dimensionexternal disturbance.
originated in respect to the traditional culture of historic
blocks [31]. Here, we primarily draw on the dimensionsinand
(2) Cultural integration. This dimension originated respect to the traditional
indicators of cultural culture of historic
preservation and
blocks [31]. used
acceptance Here,inwe primarily
research draw on the
on domestic dimensions
migrant workers and[39]indicators of cultural preservation
and the characteristics of community and
acceptance
cultural used in research
integration noted inon thedomestic migrant
UFP report [41].workers [39] and
The business the characteristics
culture that emerges of community
from tourism
development should seek to continue the cultural atmosphere based on the original streettourism
cultural integration noted in the UFP report [41]. The business culture that emerges from market
development should seek to continue the cultural atmosphere based on the
trade to achieve the integration of the traditional neighborhood culture with the business culture.original street market trade
In
to achieve the integration of the traditional neighborhood culture with the
this regard, the following three indicators are established: continuity of folk culture, community business culture. In this
regard, atmosphere,
culture the followingand three
localindicators
cultural are established: continuity of folk culture, community culture
elements.
atmosphere, and local
(3) Industrial cultural Here,
integration. elements.
we primarily refer to the dimensions and indicators of economic
(3) Industrial integration.
integration applied in research on the Here, wesocial
primarily refer toofthe
integration dimensions
a floating and indicators
population of economic
[36]. Incorporating
integration applied
inhabitant in researchand
entrepreneurship on the social integration
employment into of a floatingintegration
industrial population measurement
[36]. Incorporating and
inhabitant entrepreneurship and employment into industrial integration measurement
considering the traditional economy in the historic blocks, we adopted the following four indicators: and considering
the traditional
degree economy
of difficulty in the historic
in employment, blocks,
degree of we adopted
difficulty in the following four indicators:
entrepreneurship, degree of
traditional economic
difficulty in employment,
management, degree of difficulty in entrepreneurship, traditional economic management,
and job satisfaction.
and job satisfaction.
(4) Spatial integration. Based on the suggestions of the UFP report regarding spatial environment
(4) Spatial
planning integration.[41]
and integration Basedon onthethe suggestions
micro community of the UFP report
spatial regarding
level, we spatial
establish environment
six measurement
planning
indicators:and integration
living [41] onliving
infrastructure, the micro
spacecommunity spatial level,
privacy, residential we establish
environment quality,six transportation
measurement
indicators: living infrastructure, living space privacy, residential environment
convenience, public space sharing, and public facilities sharing. The intention was to organically quality, transportation
convenience,
divide public space
and integrate inhabitantsharing,
livingand public
space andfacilities sharing.
tourist public The intention
activity space in the wasphysical
to organically
spatial
divide and integrate inhabitant living space and tourist public activity space
layout [43–45] to resolve the heterogeneity of the two spaces caused by efforts to preserve inhabitant in the physical spatial
living conditions.
(5) Management integration. Here, we draw on the indicators of social participation in the
Atkinson indicator system. These indicators are used in the EU to achieve the “two-in-one”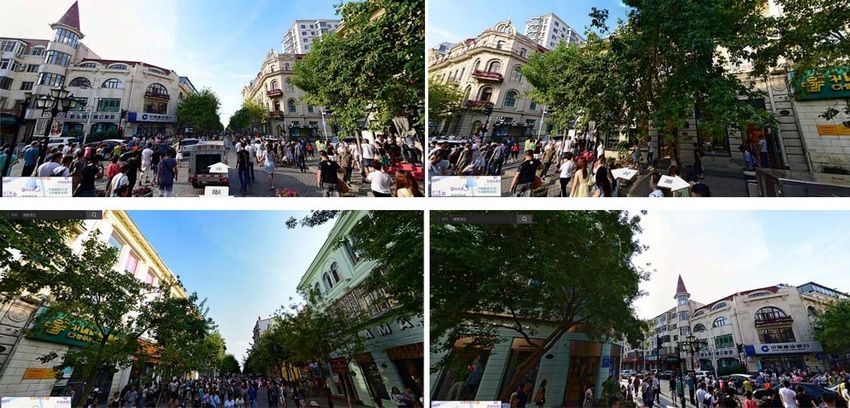
Sustainability 2018, 10, 2825                                                                                  5 of 19

layout [43–45] to resolve the heterogeneity of the two spaces caused by efforts to preserve inhabitant
living  conditions.
Sustainability 2018, 10, x FOR PEER REVIEW                                                                     5 of 19
      (5) Management integration. Here, we draw on the indicators of social participation in the Atkinson
indicator
integration system.   These indicators
                of community             are used inand
                                    management       the EU  to achieve
                                                         business       the “two-in-one”
                                                                     public administrationintegration of community
                                                                                              while establishing     a
management         and    business   public  administration    while  establishing  a  public
public interest and public participation mechanism on the same platform [46]. In this manner,  interest  and publican
participation    mechanism on plan
integration management             the same
                                         withplatform
                                               balanced[46].interests
                                                             In this manner,
                                                                      can beanformed.
                                                                                integration  management
                                                                                         Here,             plan with
                                                                                                  we develop    four
balanced    interests   can  be formed.  Here, we  develop   four  measurement   indicators:
measurement indicators: self-organizing groups, participation in management, public speaking self-organizing groups,
participation    in management,
rights, and management               public speaking rights, and management evaluation.
                                 evaluation.

2.2. Research Object
2.2. Research Object and
                     and Data
                         Data Source
                               Source
      The research samples  of
      The research samples of  thisthis
                                     study  are located
                                         study           in Harbin,
                                                 are located         Heilongjiang,
                                                               in Harbin,             China, which
                                                                             Heilongjiang,    China,was   founded
                                                                                                      which    was
in 1898. The  Middle   East Railway    construction   and  Russian   colonial  culture  had  a profound
founded in 1898. The Middle East Railway construction and Russian colonial culture had a profound          historic
impact
historicon its urban
         impact      construction
                 on its             and architectural
                        urban construction              style. Thestyle.
                                               and architectural   samplesTheselected
                                                                                samplesfor  analysis
                                                                                          selected   inanalysis
                                                                                                   for  this paper
                                                                                                                 in
were  Harbin’s  two  historic districts with   the highest  retention   rate of  inhabitants:  Central
this paper were Harbin’s two historic districts with the highest retention rate of inhabitants: CentralStreet  and
the  DaoWai
Street and theHistoric
                DaoWai Block. The Block.
                         Historic   location  of location
                                            The  the two districts  is shown
                                                           of the two  districtsinisFigure
                                                                                     shown2.in Figure 2.

                                Figure 2. Location of Central Street and Daowai Historic Block.
                                Figure 2. Location of Central Street and Daowai Historic Block.

     The reasons for choosing these two blocks as the research samples are as follows:
     The   reasons
     (1) They    are for
                      the choosing  these
                           two largest      two blocks
                                         historic        as the research
                                                  and cultural            samples
                                                                blocks with   a longare as follows:
                                                                                      history  in Harbin, and they
     (1) They    are  the two  largest  historic  and  cultural blocks  with  a
cover 940,500 m and 524,450 m , respectively, which can be seen in Figures 3 and
                    2                  2                                        long  history  in Harbin,   andStreet
                                                                                                   4. Central    they
cover  940,500   m  2 and 524,450 m2 , respectively, which can be seen in Figures 3 and 4. Central Street
was built in 1900, and there are 71 historic buildings, such as the Renaissance and Baroque buildings,
was
whichbuilt  in 1900,
        reflect        and there
                the unique        are 71 historic
                              architectural        buildings,
                                              culture          such
                                                       of Harbin.    as the Street
                                                                   Central  Renaissance
                                                                                   is knownandasBaroque    buildings,
                                                                                                  “the first street of
which  reflect  the   unique  architectural   culture  of Harbin.  Central  Street is known
Asia”. The DaoWai Historic Block was built in 1920 and is the largest Chinese Baroque buildingas  “the first street of
                                                                                                                block
Asia”. The    DaoWai    Historic  Block   was  built in 1920 and  is the largest Chinese  Baroque
in China. At the end of the 19th century, the historic impact of these two blocks on Harbin consistedbuilding   block
in
of China.
    urban At   the end of the
             construction       19th century,and
                              development       the historic  impact form,
                                                      architectural   of thesewhich
                                                                               two blocks   on Harbin
                                                                                      determined     theconsisted
                                                                                                           European of
architectural style and urban features of Harbin. This caused the city to be known as “Oriental Little
Paris” in the 20th century.
     (2) A large number of inhabitants still live in these two blocks. The number of inhabitants in
Central Street is 22,000, and the retention rate is approximately 78%. In the current renovation stage,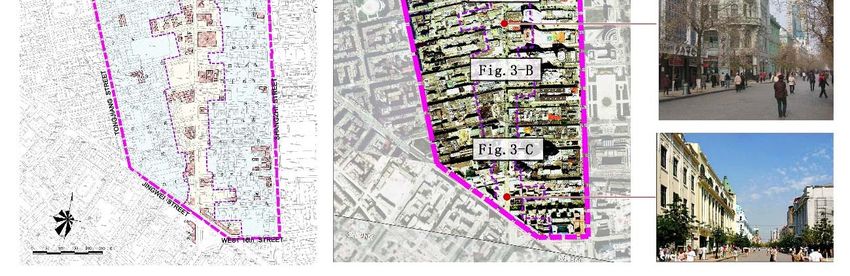
Sustainability 2018, 10, 2825                                                                                                    6 of 19

urban construction development and architectural form, which determined the European architectural
style and urban features of Harbin. This caused the city to be known as “Oriental Little Paris” in the
20th century.
     (2) A large number of inhabitants still live in these two blocks. The number of inhabitants in
Central Street is 22,000, and the retention rate is approximately 78%. In the current renovation stage,
        Sustainability 2018, 10, x FOR PEER REVIEW                                                                         6 of 19
the number of inhabitants of the DaoWai Historic Block is approximately 8000, with a retention rate of
approximately
        the number   49%.of inhabitants of the DaoWai Historic Block is approximately 8000, with a retention rate
        of approximately
     (3) In the two blocks,      49%.tourist commerce and inhabitants’ daily activities coexist, producing a vivid
contrast of activities and blocks,
              (3)  In   the  two    cultural tourist commerce
                                                blending.         and Street
                                                             Central    inhabitants’   daily activities
                                                                                is characterized     bycoexist,   producing
                                                                                                         the history     of thea Middle
        vivid contrast of activities and cultural blending. Central Street is characterized by the history of the
East Railway trade culture and Russian commercial culture. The DaoWai Historic Block is characterized
        Middle East Railway trade culture and Russian commercial culture. The DaoWai Historic Block is
by smallcharacterized
          traditionalby     commercial         business
                               small traditional           and market
                                                    commercial    businessculture.
                                                                             and market culture.
     (4) The(4)differences          between      the  two   blocks
                   The differences between the two blocks are         are street
                                                                            streetsize,
                                                                                    size,   industrial
                                                                                        industrial  type,type,
                                                                                                          housing housing
                                                                                                                      price andprice and
inhabitants’   standard
        inhabitants’           of living.
                         standard             In addition,
                                     of living.  In addition,after
                                                              after the   transformation
                                                                     the transformation        of material
                                                                                            of material space,space,    there
                                                                                                                there has   been has been
        a significant     difference    in  the  sustainable  vitality  of the current    block. The  Central
a significant difference in the sustainable vitality of the current block. The Central Street block is mainly   Street  block   is
        mainly based on tourist business services. The average housing price is approximately 12,000
based on    tourist business services. The average housing price is approximately 12,000 RMB/m2 ,
        RMB/m2, the income level and the quality of life are high, and the vitality of the block is high. The
the income level and the quality of life are high, and the vitality of the block is high. The DaoWai
        DaoWai Historic Block is mainly based on low-level life services businesses, the average housing
Historicprice
          Block      is mainly based
               is approximately                on low-level
                                      5000 RMB/m                 life services
                                                      2, inhabitants’  income levelbusinesses,
                                                                                      is low, and the   average
                                                                                                   the vitality      housing
                                                                                                                 of the block is price is
approximately        5000    RMB/m       2 , inhabitants’ income level is low, and the vitality of the block is low.
        low.

                                                                  (A)

                                                           Figure 3. Cont.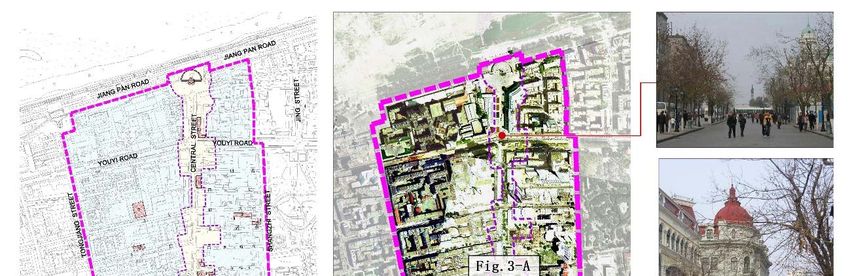
Sustainability 2018, 10, 2825                                                                                              7 of 19
          Sustainability 2018, 10, x FOR PEER REVIEW                                                             7 of 19

                                                               (B)

                                                              (C)

               Figure 3. Central Street Protection Planning. (A) Baidu Map Photos; (B) Baidu Map Photos; (C) Baidu
      Figure 3. Central Street Protection Planning. (A) Baidu Map Photos; (B) Baidu Map Photos; (C) Baidu
             Map Photos.
      Map Photos.
             The scope of the study selected in this paper includes the overall scope of the historic block
        protection zone in Central Street and the DaoWai Historic Block. In Central Street, the protection area
     The scope of the study selected in this paper includes the overall scope of the historic block
        and the surrounding environment are coordinated in terms of space, economy, and society. Affected
protection  zone in Central Street and the DaoWai Historic Block. In Central Street, the protection
        by this, the spatial pattern of the surrounding area is similar to that of Central Street, and the social
area and   the  surrounding
        and economic      level isenvironment
                                    equivalent. At are
                                                     the coordinated
                                                          same time, theinintensity
                                                                              terms ofof space,     economy, and
                                                                                            urban construction     and society.
Affecteddevelopment
          by this, theinspatial   pattern ofareas
                           the surrounding     the surrounding      area iscontrolled.
                                                    has been effectively      similar to   that
                                                                                         Due  to of
                                                                                                 theCentral   Street, and the
                                                                                                      special Chinese
        Baroque
social and        buildings,
            economic          theis
                          level   spatial types of the
                                     equivalent.    At DaoWai
                                                        the same Historic
                                                                    time,Block   and its surrounding
                                                                            the intensity     of urbanenvironment
                                                                                                           construction and
development in the surrounding areas has been effectively controlled. Duehigher
        are different. The  development    intensity of the surrounding   areas  is significantly   to thethan  that ofChinese
                                                                                                            special
        the DaoWai Historic Block, which has had an assimilation effect on the socioeconomic aspects of the
Baroque buildings, the spatial types of the DaoWai Historic Block and its surrounding environment
        surrounding areas. The overall regional socioeconomic level is relatively similar.
are different.
             TheThe  development
                   data                intensity
                        used in this study         of the surrounding
                                             were collected                  areas social
                                                              using an inhabitant    is significantly   higherbythan
                                                                                           survey conducted         the that of
the DaoWai
        project’s team from May to November 2017 in the historic blocks of Harbin’s main urban area. A of the
              Historic   Block,   which    has  had   an  assimilation    effect  on   the socioeconomic       aspects
surrounding
        random areas.   The method
                  sampling    overallwas
                                       regional   socioeconomic
                                           used for                  level is relatively
                                                     a total of 1099 questionnaires    basedsimilar.
                                                                                              on different scales and
     Thethedata
            conditions
                  used ofininhabitants’
                             this study retention. Of the validusing
                                           were collected        recovered  questionnaires,
                                                                        an inhabitant          330 were
                                                                                            social       from conducted
                                                                                                     survey   Central       by
        Street and 282 were from the DaoWai Historic Block.
the project’s team from May to November 2017 in the historic blocks of Harbin’s main urban area.
A random sampling method was used for a total of 1099 questionnaires based on different scales and
the conditions of inhabitants’ retention. Of the valid recovered questionnaires, 330 were from Central
Street and 282 were from the DaoWai Historic Block.
Sustainability 2018, 10, 2825                                       8 of 19
   Sustainability 2018, 10, x FOR PEER REVIEW                     8 of 19

                                                      (A)

                                                      (B)

                                                      (C)

                                                Figure 4. Cont.
Sustainability 2018, 10, 2825 9 of 19
Sustainability 2018, 10, x FOR PEER REVIEW 9 of 19
(D)
Figure 4. Daowai Historic Block Protection Planning. (A) Baidu Map Photos; (B) Baidu Map Photos;
Figure 4. Daowai Historic Block Protection Planning. (A) Baidu Map Photos; (B) Baidu Map Photos;
(C) Baidu Map Photos; (D) Baidu Map Photos.
(C) Baidu Map Photos; (D) Baidu Map Photos.
2.3. Survey Method
2.3. Survey Method
The survey combined subjective questionnaires and semistructured interviews. A Likert scale
wasThe survey
used withcombined subjective
the following questionnaires
response options: 1 and semistructured
(strongly disagree),interviews.
2 (disagree), A Likert scale was
3 (neutral), 4
used with the following response options: 1 (strongly disagree), 2 (disagree), 3 (neutral),
(agree), and 5 (strongly agree). The questionnaire was completed based on subjective feelings. The 4 (agree), and 5
(strongly agree).
Likert scale is aThe questionnaire
common method to was completed
measure socialbased on subjective
integration [17]. Thefeelings. The Likert
questionnaire included scale
a is
a common method to survey
basic demographic measure social
(e.g., integration
respondent age,[17]. The questionnaire
identity, income, length included a basic
of residence) anddemographic
21 social
survey (e.g., respondent
integration measures as age, identity,
basic items.income, length“Do
For example, of residence)
you have and good21communication
social integration with measures
your
as neighbors?”
basic items. “Do For you
example,
think “Do you have good
the community culturecommunication
in this block iswith veryyour
good?” neighbors?”
“Can you “Do start you
a
business
think easily in this
the community neighborhood?”
culture “Is is
in this block thevery
privacy
good?”of your
“Can space
youvery
startstrong?” “Can
a business you be
easily a
in this
good part of the block management?” The scores assigned by the inhabitant
neighborhood?” “Is the privacy of your space very strong?” “Can you be a good part of the block respondents for each
item were used
management?” Theto transform
scores assignedthebysample data intorespondents
the inhabitant scale variables, anditem
for each a quantitative
were used to statistical
transform
theanalysis was into
sample data performed. Using SPSS
scale variables, and a21.0 statisticalstatistical
quantitative software, Statistical
analysis was Product
performed. andUsing Service
SPSS
Solutions, IBM, Chicago, IL, USA, preliminary collation and inspection were performed
21.0 statistical software, Statistical Product and Service Solutions, IBM, Chicago, IL, USA, preliminary on the two
sets of survey
collation data. Then,
and inspection reliability
were analysis
performed on was performed
the two sets ofon the 21data.
survey measurement items included
Then, reliability analysis
in the survey. For the total sample data for the DaoWai and Central Street blocks, internal consistency
was performed on the 21 measurement items included in the survey. For the total sample data for
reliability coefficient Cronbach’s Alphas were 0.927 and 0.926, respectively, which met statistical
the DaoWai and Central Street blocks, internal consistency reliability coefficient Cronbach’s Alphas
reliability requirements. A Bartlett Test for Sphericity and Kaiser–Meyer–Olkin (KMO) analysis were
were 0.927 and 0.926, respectively, which met statistical reliability requirements. A Bartlett Test for
performed on the data. The results indicated a p-value of 0.000 (p < 0.001), and the Bartlett test was
Sphericity and Kaiser–Meyer–Olkin (KMO) analysis were performed on the data. The results indicated
satisfied. The KMO values were 0.908 and 0.904, respectively. Therefore, the sample data were
a p-value of 0.000 (p < 0.001), and the Bartlett test was satisfied. The KMO values were 0.908 and 0.904,
suitable for factor analysis, and the validity of the scale met normal standards.
respectively. Therefore, the sample data were suitable for factor analysis, and the validity of the scale
met normal
2.4. standards.
Statistical Analysis Method
To determine
2.4. Statistical Analysis the structure of the inhabitants’ social integration measurement indicators in the
Method
historic blocks, EFA was performed on the two groups of data samples. The variance maximization
To determine
method was used thetostructure
perform of the inhabitants’
rotation socialtointegration
in factor load analyze themeasurement indicators The
principal components. in the
historic blocks,
structure and EFA
number wasofperformed
the factorson thecompared
were two groups of data
through thesamples.
varianceThe variance rate
contribution maximization
and the
method was used to perform rotation in factor load to analyze the principal
common factor variance value, and the irrational factors were eliminated. In this manner, components. The structure
the
and number of the
measurement model factors wereand
structure compared through were
factor indicators the variance contribution rate and the common
initially determined.
factor variance
CFA of the value,
SEMand wasthe irrational
used to test factors weredetermined
the initially eliminated.measurement
In this manner, the through
model measurement
the
model structure
robust maximum andlikelihood
factor indicators were initially
(MLR) estimator. determined.
The model adaptability was good, and the adaptability
indicator
CFA ofistheshown
SEM in wasTable
used1.to
Intest
the the
table, χ2 means
initially Chi-square,
determined df means degrees
measurement model of freedom,
through theχrobust
2/df
means ratio
maximum of two (MLR)
likelihood terms, p-value
estimator.meansTheprobability level, RMSEA
model adaptability means
was good, root
and themean square error
adaptability of
indicator
approximation,
is shown in Table 1.NFI In themeans χ2 means Chi-square,
table,nonnormed fit index, CFI meansdegrees
df means comparative χ2 /dfIFI
fit index,
of freedom, means
means ratio
incremental
of two fit index,
terms, p-value RFI means
means relative
probability fit index,
level, RMSEA and AGFIroot
means means
mean adjusted
squaregoodness-of-fit index.
error of approximation,
The SEM method includes the mutual influence of each factor when estimating
NFI means nonnormed fit index, CFI means comparative fit index, IFI means incremental fit index, the model, and the
RFIweight
meansvalue
relativeis fit
determined
index, andtoAGFIbe the pathadjusted
means coefficient obtained from
goodness-of-fit CFA.
index. TheThe
SEMinhabitant social
method includes
integration scores were calculated and converted into values between 1
the mutual influence of each factor when estimating the model, and the weight value is determinedand 100 according to the to
standard scores. The factors of each dimension were converted in the same way, resulting in the social
be the path coefficient obtained from CFA. The inhabitant social integration scores were calculated
integration scores of the inhabitants.
and converted into values between 1 and 100 according to the standard scores. The factors of each
dimension were converted in the same way, resulting in the social integration scores of the inhabitants.
Sustainability 2018, 10, 2825                                                                                                                               10 of 19

                                                                  Table 1. Model fitness.

         Groups                 χ2           df           χ2 /df      P-Value RMSEA                        NFI        CFI            IFI       RFI       AGFI
     Central Street           202.74       147             1.38        0.002             0.034             0.94      0.98         0.98         0.94       0.92
    DaoWaiHistoric            242.16       147             1.65        0.000             0.044             0.98      0.99         0.99         0.97       0.90
        Block

3. Results

3.1. Structure of Inhabitant Social Integration Measurement Factors
     EFA was used to test the two data sets. It was found that the common factor variance of the factors
“social psychological distance” and “job satisfaction” was less than 0.5. In the principal component
analysis, “social psychological distance” straddled two dimensions. Thus, the dimension ownership
was unclear and had to be removed. The remaining 19 factors were determined as measurement
indicators, and EFA was performed again. The results revealed that the eigenvalues of the five principal
components were greater than 1, and the common factor variance of all the indicators was 0.5 or more.
The cumulative contribution rates of the five principal component factors were 74.401% (Central Street)
and 74.333% (DaoWai Historic Block). According to the factor indicator load value, the principal
component factors that composed the measurement factors were tested, and the dimension factors were
compared and named. The results are shown in Table 2. In the table, green refers to the data results for
Central Street, and blue refers to the data results for the DaoWai Historic Block. The EFA test results
eliminated dimensionally unclear factor indicators and determined the structure of the inhabitant social
integration measurement factors; the five dimensions are behavioral integration, cultural integration,
industrial integration, spatial integration, and management integration. This outcome matches that of
the theoretical model consisting of the initially selected factors.

              Table 2. Exploratory factor analysis (EFA) Result—Central Street/Daowai Historic Block.

                                                     Spatial          Management          Behavioral          Industrial       Cultural        Common Factor
                     Factor
                                                   Integration        Integration         Integration        Integration      Integration        Variance
         Neighborhood Communication               0.137     0.126     0.141     0.212    0.836    0.750     0.175   0.175    0.193     0.162   0.806    0.680
          Social Community Networks               0.216     0.101     0.222     0.214    0.808    0.725     0.108   0.199    0.232     0.255   0.815    0.687
              External Disturbance                0.264     0.217     0.185     0.045    0.794    0.768     0.209   0.125    0.052     0.153   0.780    0.678
           Continuity of Folk Culture             0.245     0.131     0.169     0.219    0.238    0.189     0.209   0.119    0.774     0.817   0.787    0.783
        Community Culture Atmosphere              0.159     0.237     0.178     0.110    0.208    0.199     0.153   0.191    0.807     0.809   0.774    0.799
            Local Cultural Elements               0.247     0.192     0.183     0.179    0.050    0.228     0.122   0.267    0.811     0.806   0.769    0.842
       Degree of Difficulty in Employment         0.249     0.194     0.184     0.238    0.228    0.171     0.799   0.819    0.226     0.219   0.838    0.842
     Degree of Difficulty in Entrepreneurship     0.131     0.220     0.185     0.180    0.205    0.227     0.810   0.832    0.144     0.203   0.770    0.866
       Traditional Economic Management            0.231     0.266     0.174     0.138    0.077    0.170     0.836   0.869    0.124     0.159   0.804    0.899
              Living Infrastructure               0.672     0.691     0.121     0.292    0.094    0.078     0.128   0.163    0.349     0.207   0.613    0.638
              Living Space Privacy                0.749     0.772     0.154     0.181    0.062    0.103     0.152   0.135    0.175     0.148   0.642    0.680
        Residential Environment Quality           0.767     0.760     0.193     0.106    0.087    0.240     0.210   0.154    0.074     0.153   0.683    0.693
          Transportation Convenience              0.756     0.794     0.169     0.069    0.227    0.165     0.057   0.087    0.112     0.006   0.667    0.670
              Public Space Sharing                0.721     0.698     0.154     0.250    0.171    -0.030    0.121   0.150    0.159     0.139   0.613    0.592
            Public Facilities Sharing             0.794     0.734     0.169     0.199    0.188    0.125     0.152   0.172    0.099     0.130   0.727    0.640
             Self-organizing Groups               0.187     0.230     0.831     0.790    0.098    0.126     0.156   0.196    0.165     0.171   0.787    0.761
          Participation in Management             0.187     0.245     0.792     0.826    0.167    0.123     0.077   0.134    0.215     0.246   0.742    0.836
                 Speaking Rights                  0.245     0.215     0.790     0.852    0.157    0.092     0.137   0.129    0.104     0.182   0.738    0.830
            Management Evaluation                 0.172     0.192     0.805     0.782    0.179    0.201     0.241   0.126    0.108     0.000   0.780    0.705
                                                                  Eigenvalues                                                                      Groups
         Variance Contribution Rate               20.511             16.010              12.710            12.596            12,574
                                                                                                                                                Central Street
     Cumulative Variance Contribution Rate        20.511             36.521              49.231            61,828            74.401
         Variance Contribution Rate                         20.230              16.700            11.123            13.390            12.890   DaoWai Historic
     Cumulative Variance Contribution Rate                  20.230              36.930            48.053            61.443            74.333       Block
      Note: the green values in the table is the result of the data of Central Street, and the blue values is the result of the
      data of DaoWai Historic Block.

3.2. Weight of Inhabitant Social Integration Measurement Factors
     Considering the correlation between the various measurement factors of inhabitant social
integration in the historic blocks, the SEM method was used to test the factor model again. The analysis
results were used to determine the weight of each indicator factor. The study used MLR to estimate the
Sustainability 2018,
Sustainability 2018,
Sustainability 10,
2018, 10, xx FOR
FOR PEER
10, 2825 PEER REVIEW
REVIEW 11
11 of
of 19
19
estimate
estimate the
the model
model parameters
parameters to to obtain
obtain the
the normalized
normalized load
load and
and path
path coefficients
coefficients (Figures
(Figures 55 and
and 6).
6).
model
All parameters
T-values were to obtain the
significant. Thenormalized
results load
indicate and
that path coefficients
inhabitant (Figures
spatial 5 and
integration in
All T-values were significant. The results indicate that inhabitant spatial integration in Central Street6). All T-values
Central Street
were
had significant.
had the
the most The results
most significant
significant indicate
impact
impact on that inhabitant
on social
social integration,
integration,spatial
with integration
with aa path in Central
path coefficient
coefficient of Street
of 0.76.
0.76. The
Thehad the most
behavioral
behavioral
significant
integrationimpact
integration of
of the on social integration,
the inhabitants
inhabitants of
of the
the DaoWaiwith historic
DaoWai a path coefficient
historic block had of
block had the0.76.
the most
mostThe behavioral
significant
significant integration
impact
impact on of
on social
social
the inhabitants
integration, withof the
a DaoWai
path historic
coefficient ofblock
0.78.had
The the most
path significant
coefficient of impact
the
integration, with a path coefficient of 0.78. The path coefficient of the dimension factor was on social
dimension integration,
factor was
with a path coefficient
determined
determined to
to be
be the of 0.78. value
the weight
weight The path
value of coefficient
of the
the model of the dimension
model measurement
measurement factor
factor
factor for was determined
for further
further calculation
calculationto be
of the
of the
weight
social value of
integration the model
score.
social integration score. measurement factor for further calculation of the social integration score.
Figure
Figure 5.
5. Confirmatory
Confirmatory factor
Confirmatory factor analysis
analysis (CFA)
(CFA) Result
Result (Central
(Central Street).
Street).
Figure
Figure 6.
6. CFA
CFA Result
Result (Daowai Historic Block).
Historic Block).
(Daowai Historic Block).Sustainability 2018, 10, 2825 12 of 19
Sustainability 2018, 10, x FOR PEER REVIEW 12 of 19
3.3.
3.3.Score
ScoreofofInhabitant
InhabitantSocial
SocialIntegration
IntegrationMeasurement
Measurement
The
Thesocial
socialintegration
integrationcomposite
composite score
scorewas
wascalculated
calculated by
by taking
taking the
the path
pathcoefficients
coefficients (weights)
(weights)
of the
of the five dimensional factors as the weights and taking the weighted sum and
dimensional factors as the weights and taking the weighted sum and converting them converting them
into
into values
values between
between 1 and1 100
andaccording
100 according
to theto the standard
standard scores.scores.
The sameThecalculation
same calculation
methodmethod was
was applied
applied to the
to the five five dimensional
dimensional factors,
factors, and the and
samethe same conversion
conversion was performed.
was performed. The descriptive
The descriptive statistical
statistical
results for the measurement score are shown in Figure 7. The results reveal that the overall overall
results for the measurement score are shown in Figure 7. The results reveal that the level of
level of inhabitant
inhabitant social social integration
integration in Central
in Central Street
Street waswas high
high (Mean
(Mean = =66.87,
66.87,SD
SD == 20.34). Industrial
Industrial
integration
integration hadhadthe
thehighest
highestscore
score(Mean
(Mean==65.84,
65.84,SDSD==18.16),
18.16),and
andmanagement
managementintegration
integration had
hadthe
the
lowest score (Mean = 55.66, SD = 19.87). The overall level of inhabitant social integration
lowest score (Mean = 55.66, SD = 19.87). The overall level of inhabitant social integration in the in the
DaoWai
DaoWaihistoric
historic block was lower
lower(Mean
(Mean==55.05,
55.05,
SDSD = 20.68).
= 20.68). Spatial
Spatial integration
integration had had the highest
the highest score
score (Mean = 62.74, SD = 17.89), and management integration had the lowest score
(Mean = 62.74, SD = 17.89), and management integration had the lowest score (Mean = 45.66, SD = (Mean = 45.66,
SD = 19.18).
19.18).
Figure7.7.Social
Figure SocialIntegration
IntegrationMeasurement
MeasurementScore
ScoreComparison.
Comparison.
4. Discussion
4. Discussion
4.1.Comparison
4.1. Comparisonofofthe
theOverall
OverallLevels
LevelsofofInhabitant
InhabitantSocial
SocialIntegration
Integration
The described
The described measurement
measurement model model can can intuitively
intuitively quantify
quantify thethe level
level ofof inhabitant
inhabitant social
social
integration in
integration in the
thehistoric
historicblocks,
blocks,andandthethe
social integration
social status
integration of inhabitants
status in thein
of inhabitants different blocks
the different
can be reflected by calculating the integrated scores. According to the percentage
blocks can be reflected by calculating the integrated scores. According to the percentage conversion conversion results,
it was found
results, it wasthat the inhabitant
found social integration
that the inhabitant score for Central
social integration score Street was higher
for Central Street(66.87), which
was higher
indicates
(66.87), that indicates
which Central Street inhabitants
that Central Streethad achievedhad
inhabitants social integration.
achieved In addition, In
social integration. the conflict
addition,
between the inhabitants’ lives, tourism, and commerce was small and
the conflict between the inhabitants’ lives, tourism, and commerce was small and trended towardtrended toward a harmonious
alevel of sociallevel
harmonious integration.
of socialThe inhabitant
integration. Thesocial integration
inhabitant social score in thescore
integration DaoWaiin thehistoric
DaoWai block was
historic
lowerwas
block (55.05).
lowerThis outcome
(55.05). Thisindicates
outcomethat social integration
indicates there requires
that social integration improvement.
there The overall
requires improvement.
level comparison is consistent with the difference between vitality and
The overall level comparison is consistent with the difference between vitality and sustainability sustainability of theof two
the
neighborhoods.
two neighborhoods.
AAcomparison
comparisonofofthe theactual
actualcircumstances
circumstances ofofthethe two
two historic
historic blocks
blocks revealed
revealed thatthat
thethe difference
difference in
in social integration level is primarily due to four factors: the development
social integration level is primarily due to four factors: the development stage of the blocks, inhabitant stage of the blocks,
inhabitant characteristics,
characteristics, the of
the initial state initial state ofand
the blocks, the the
blocks, and the resource
background background levelresource level of
of the blocks. the
First,
blocks. First, Harbin’s Central Street is in a period of mature development
Harbin’s Central Street is in a period of mature development (the district was established in 1900 and (the district was
established in 1900 and officially transformed into the nation’s first commercial pedestrian street in
1997). Various planning and construction projects have been completed, and development has beenSustainability 2018, 10, 2825 13 of 19
officially transformed into the nation’s first commercial pedestrian street in 1997). Various planning and
construction projects have been completed, and development has been steadily advancing. In contrast,
the DaoWai historic block remains in the early stage of renovation and development (Street planning
was initiated in 2007, and the first phase of the renovation was completed in 2011). The overall
demolition of the block has not been completed. Second, generally, the comprehensive social status of
the Central Street inhabitants was higher than those of the DaoWai historic block. There are significant
differences in the education, employment, and income of the inhabitants. Early in the last century,
Central Street had already become an important commercial street in Harbin City, while the DaoWai
historic block was a residential district. Thus, there are differences in the initial state of the blocks.
Finally, the accumulated background resources of Central Street’s economic and social environment
exceed those of the DaoWai historic block. There is also a difference in social attention.
4.2. Comparison of Social Integration Dimension Factors for the Inhabitants of a Single Block
For Central Street, the score comparison results for the five dimensional factors are as follows:
industrial integration (65.84) > spatial integration (58.23) > behavioral integration (58.05) > cultural
integration (56.86) > management integration (55.66). Industrial integration is the dimension factor
with the highest score. This outcome is related to the block’s economic resources. It is relatively
common for the inhabitants to be locally employed. The inhabitant spatial integration score ranks
second. The inhabitants’ living conditions are generally good, and transportation is convenient.
However, most of the living spaces are open street-style dwellings. Therefore, living space privacy
is low. The level of public space sharing and facilities must be improved. The level of inhabitant
behavioral integration is slightly lower primarily because the numerous tourists who visit the block
disturb the inhabitants’ lifestyle activities. The level of cultural integration is low, and the impact of
business tourism and assimilation is relatively obvious. The level of inhabitant management integration
is the lowest, and there is no inhabitant group organization that would help realize block autonomy.
The model of government-dominated development management is continuing.
The plan to enhance inhabitant social integration in Central Street should focus on the dimensions
with low scores, that is, on the continuity of the inhabitants’ culture. In this way, the integration of
multiple cultures in the block could be balanced. Inhabitant participation in community management
should be enhanced to provide the inhabitants implementation responsibility under the current block
management system.
In the case of the DaoWai historic block, the score comparison results for the five dimensional
factors are as follows: spatial integration (62.74) > behavioral integration (60.81) > cultural integration
(55.11) > industrial integration (49.71) > management integration (46.55). Spatial integration is
the dimensional factor with the highest score. This outcome is related to the overall shape of
the block, that is, the spatial pattern of a main axis connected to auxiliary streets. The extent of
disturbance by tourism of inhabitant lifestyle activities is not high. The inhabitant behavior integration
score ranks second because there are a relatively large number of retained inhabitants who have
preserved their established ways of living. The neighborhood exchanges and social networks are
in good condition. Cultural integration and industrial integration did not perform well because of
the impacts of the block renovation, business, and trade on the cultural and economic aspects of
inhabitant lifestyle activities. The inhabitant management integration score is the lowest. At this
stage, the government-dominated development management model cannot achieve the self-living and
self-governing model of the inhabitants.
The planning priorities for enhancing the DaoWai historic block should focus on industrial
integration and management integration and seek to sustain the block’s traditional economic
form, promote local employment and entrepreneurship for block inhabitants, strengthen the public
participation of the inhabitants in the block’s renovation, and promote the block’s renovation and
development through a cooperative model.Sustainability 2018, 10, 2825 14 of 19
4.3. Comparison of Inhabitant Social Integration Dimension Factors for the Two Blocks
Table 3 compares the dimension factors and the score differences of the two blocks. The analysis
found significant differences in industrial integration between the two blocks. The difference in
the types of industry and the scales of the two blocks made the largest contributions to the score
gap. Central Street has sustained a large-scale, industry-rich commercial and trade model based on
the historic foundation of the Western colonial economy. The district is primarily oriented toward
international tourism. DaoWai has mainly focused on street business, and the scale is generally small.
The clients served by this activity are mostly city residents. The difference in the level of management
integration between the two blocks is reflected in the difference in their development stages. Central
Street is at a mature stage. However, it lacks public participation from inhabitants. The DaoWai historic
block is undergoing reconstruction and renovation, and the block management is dominated by the
government. The difference in the spatial integration level is small between the two blocks, and the
“bone shape” spatial form of the two blocks renders their living spaces close to the commercial spaces.
The spatial integration level of the DaoWai historic block is slightly higher than that of Central Street.
The levels of behavioral integration in the two blocks are on par with one another, although the scores
of the DaoWai historic block are higher. The difference in cultural integration is the smallest, and the
traditional culture of the inhabitants is not prominent. Both blocks require improvement in this aspect.
Table 3. Inhabitant social integration score margin difference value.
Social Spatial Behavioral Cultural Industrial Management
Groups
Integration Integration Integration Integration Integration Integration
Central Street (A) 66.87 58.23 58.05 56.86 65.84 55.66
DaoWai Historic Block (B) 55.05 62.74 60.81 55.11 49.71 46.55
Difference Value (A–B) 11.82 -4.51 -1.76 1.75 16.13 9.11
In summary, planning and development should focus on the identified weaknesses to enhance
the social integration of inhabitants of Harbin’s two historic blocks. The key is to promote public
participation and thus improve the integration of inhabitants into block management. A long-term
interactive management mechanism should be formed by combining autonomous internal inhabitant
management with external government management. Behavioral, cultural, and industrial integration
should be rationally enhanced. To stimulate the vitality of the blocks, the inhabitants’ culture and
economy should be highlighted. Attention should be paid to the functional separation and public
sharing of the inhabitants’ living space and the commercial space. In planning historic blocks,
inhabitant inclusion should be advocated. Due to the different timing of the development of the
blocks, the statistical results of this study reflect the level of inhabitant social integration at the current
stage. In this study’s next phase, the sample size of the social survey data will be expanded, and the
measurement factor model will be adjusted according to the development stage. In this manner,
we will be able to draw conclusions regarding the correlation between inhabitant social integration
and population attributes.
4.4. Suggestions for Planning and Policy
The above analysis shows that the difference in industrial integration between the two blocks is
the largest among the five dimensional factors, and the difference of cultural integration is the smallest.
The study found that differences in the level of inhabitant social integration are the reasons for different
levels of vitality and sustainability of neighborhoods. According to the indicators of the inhabitant
social integration measurement system and the degree of the two differences, we propose planning
and policy improvement suggestions for the following five aspects of the historic blocks in Harbin.
(1) Sharing the benefits of industrial resources and promoting innovation and entrepreneurshipYou can also read