SNOWPACK MONITORING IN THE ROCKY MOUNTAIN WEST - A User Guide - Western Water Assessment
←
→
Page content transcription
If your browser does not render page correctly, please read the page content below
SNOWPACK MONITORING IN
THE ROCKY MOUNTAIN WEST
A User Guide

                                                     December 2020

                                      Western Water Assessment
           Cooperative Institute for Research in Environmental Sciences
                                          University of Colorado Boulder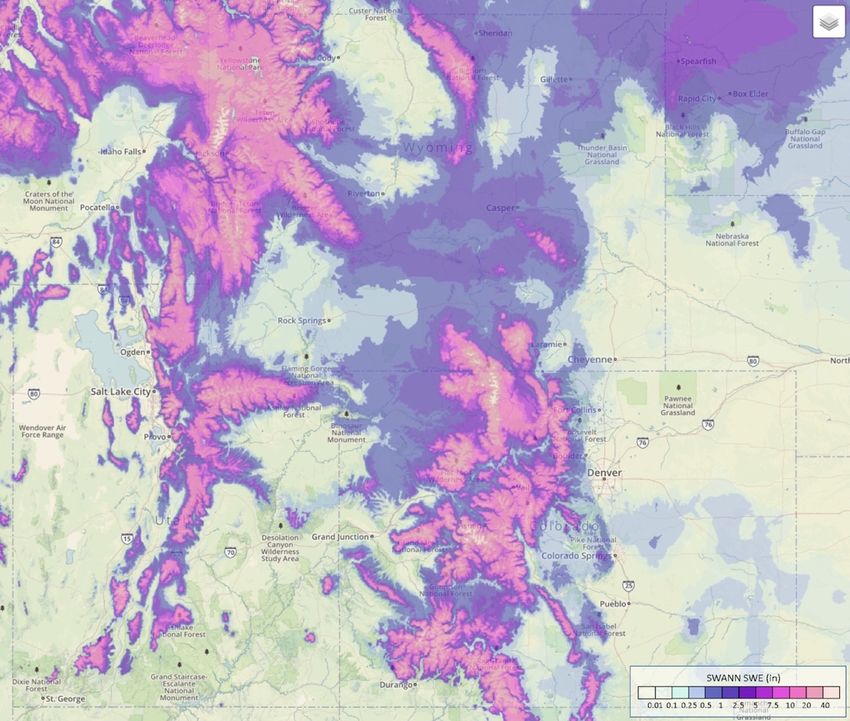
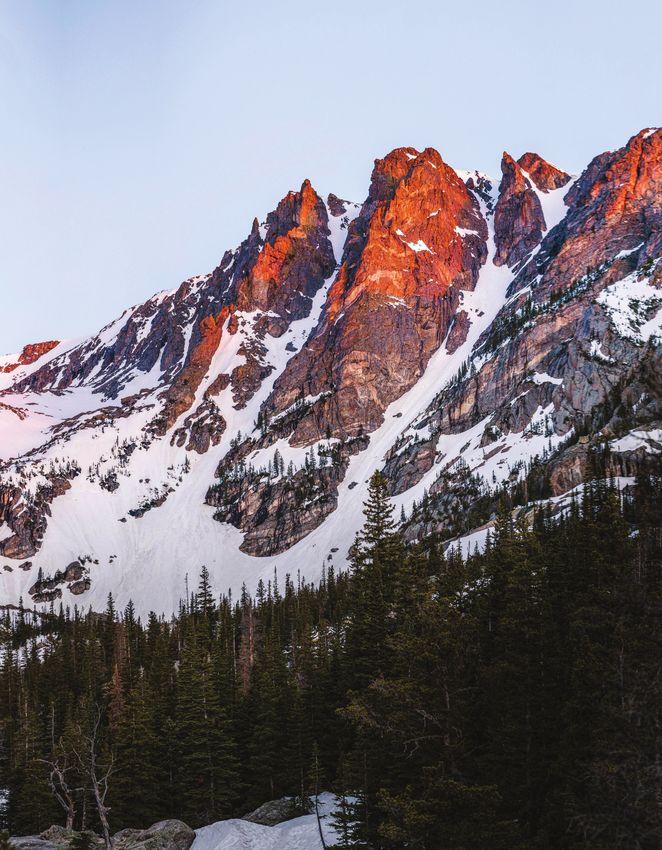
SNOWPACK MONITORING IN THE ROCKY MOUNTAIN WEST:
A USER GUIDE

Western Water Assessment
Cooperative Institute for Research in Environmental Sciences (CIRES)
University of Colorado Boulder

Lineke Woelders
Jeff Lukas *
Liz Payton
Benét Duncan

December 2020

Suggested citation: Woelders, L., J. Lukas, E. Payton, and B. Duncan, 2020. Snowpack Monitoring in the
Rocky Mountain West: A User Guide. Western Water Assessment. Available online at
http://wwa.colorado.edu/publications/reports.

Western Water Assessment (WWA) is a university-based applied research program that addresses
societal vulnerabilities to climate variability and climate change in the Rocky Mountain West – Colorado,
Utah, and Wyoming. We are part of the Cooperative Institute for Research in Environmental Sciences
(CIRES) at the University of Colorado Boulder. Support for our program and this guide comes from
NOAA’s Regional Integrated Sciences and Assessments (RISA) Program.

Copyright © 2020 Western Water Assessment

Cover Photo: Dream Lake, Colorado by Vincent Ledvina on Unsplash

* Current affiliation: Lukas Climate Consulting and Research, Louisville, CO
Snowpack Monitoring in the Rocky Mountain West: A User Guide
Contents
Section 1. Why a snowpack user guide?................................................................................................................................... 1
Section 2. Understanding the snowpack .................................................................................................................................. 4
Overall spatial pattern................................................................................................................................................................... 4
Snowpack accumulation and losses prior to spring snowmelt ...................................................................................................... 4
Spring snowmelt ............................................................................................................................................................................ 6
Translation from snow to runoff.................................................................................................................................................... 6
Recent trends in snow ................................................................................................................................................................... 7
Expected future changes in snow .................................................................................................................................................. 7
Section 3. Monitoring the snowpack: SNOTEL and snow courses ............................................................................................. 9
SNOTEL stations............................................................................................................................................................................. 9
Snow courses ............................................................................................................................................................................... 11
Limitations of the SNOTEL/snow course networks ...................................................................................................................... 12
Interpreting SNOTEL/snow course SWE information ................................................................................................................... 13
Other in-situ snow observations (CoCoRaHS, COOP, CODOS) ..................................................................................................... 13
Section 4. Monitoring the snowpack: Remote sensing and spatial modeling .......................................................................... 15
Remote sensing of snow (ASO, MODIS) ....................................................................................................................................... 15
Spatially distributed snow modeling (SNOW-17, SNODAS, SWANN, CU-SWE)............................................................................ 16
Section 5. Applying snowpack data: Seasonal streamflow forecasting ................................................................................... 19
NRCS forecast methods ............................................................................................................................................................... 19
NOAA RFC forecast methods ....................................................................................................................................................... 19
Section 6. Accessing snowpack data: Data tools and resources .............................................................................................. 21
NRCS Interactive Map .................................................................................................................................................................. 23
NRCS Snow Survey tools and products ........................................................................................................................................ 25
CBRFC Snow Groups .................................................................................................................................................................... 27
COOP–NOAA NCEI Daily Snowfall & Snow Depth maps and data table ...................................................................................... 28
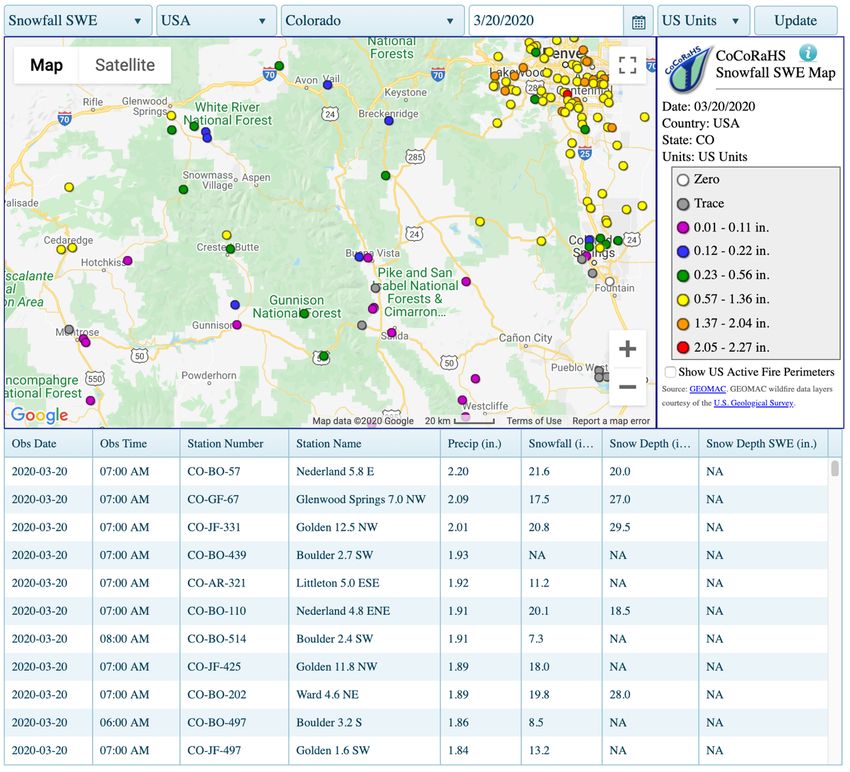
CoCoRaHS Maps .......................................................................................................................................................................... 30
NOAA NOHRSC - SNODAS Interactive Map.................................................................................................................................. 32
CWCB CDSS SNODAS Tools (Colorado-only SNODAS map) .......................................................................................................... 34
SnowView – Snow Water Artificial Neural Network Modeling System (SWANN) ....................................................................... 36
CBRFC Modeled Snowpack – Interactive Conditions Map ........................................................................................................... 38
Glossary ................................................................................................................................................................................ 40
Acronyms and abbreviations ................................................................................................................................................. 42
References ............................................................................................................................................................................ 43
Contents i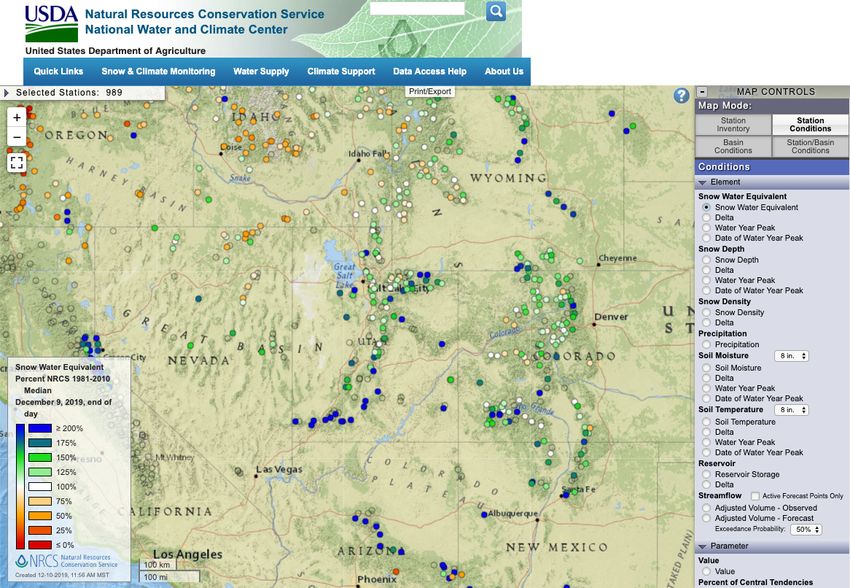
Snowpack Monitoring in the Rocky Mountain West: A User Guide

Section 1. Why a snowpack user guide?
In the Rocky Mountain West, snow is a dominant player in the hydrologic cycle. Across the states of
Colorado, Utah, and Wyoming (where Western Water Assessment focuses its work, Figure 1), most of the
region’s annual streamflow—about 60-85%—originates as snowmelt 1. The region’s snowpack is
effectively an enormous seasonal reservoir that fills and then empties every year. Schneider and Molotch
(2016) show that across the states of Colorado, Utah, and Wyoming (where Western Water Assessment
focuses its work, Figure 1) this snow reservoir has an average seasonal peak volume of about 40 million
acre-feet, equivalent to 1.5 times the capacity of Lake Powell 2. SWANN (Snow-Water Artificial Neural
Network Modeling System) estimates of 1982-2019 median April 1st SWE volume, accessed via
SnowView (https://climate.arizona.edu/snowview/) show a similar seasonal peak volume for this region.

    Figure 1. The Western Water Assessment’s region comprises the states of Wyoming, Utah, and
    Colorado.

Section 1. Why a snowpack user guide?                                                                     1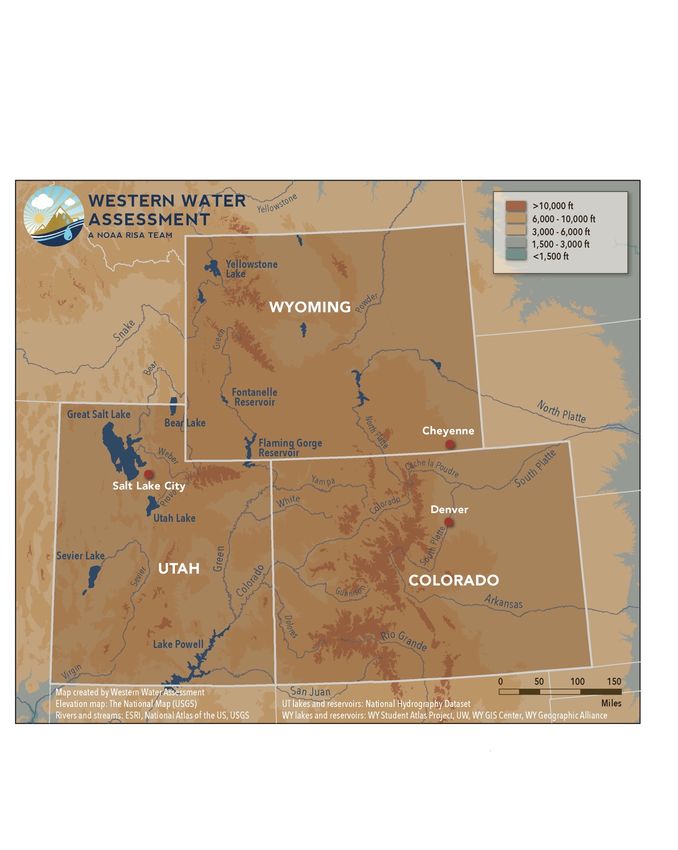
Snowpack Monitoring in the Rocky Mountain West: A User Guide

Since variation in the size of the snowpack from year to year strongly controls the magnitudes of
seasonal, annual, and peak streamflows, monitoring the evolution of the snowpack over the course of
the winter and spring is critical to forecasting streamflow and managing water supply. Snow monitoring
is also vital to other river-based interests, such as fisheries management and guided rafting.

We assembled this guide for water managers, decision makers, forecasters, researchers, and others who
use, collect, and produce snow information. The guide is organized around five objectives:

    •     Outline the fundamental characteristics of the snowpack, the processes that drive its variability
          over time and space, and the challenges of sampling such a dynamic resource.
    •     Highlight the key role of snowpack in seasonal water supply forecasting.
    •     Describe the SNOwpack TELemetry (SNOTEL), snow course, and other networks of point
          observations.
    •     Summarize the several products providing spatial estimates of snowpack derived from point
          observations, snow models, and remote sensing.
    •     Provide practical guidance on accessing, interpreting, and applying snow data.

Table 1 summarizes the data and products covered in this guide.

Table 1. Overview of the snow monitoring networks and products described in this guide 3.

 Network or          Method and input      Snow             Spatial resolution or #    Spatial    Temporal
 Product             data                  variables               Stations           coverage    resolution

 SNOTEL              In situ measurement   SWE, snow           336 stations in         West-        Hourly
 (NRCS)                                    depth,             CO/UT/WY; ~900           wide
                                           precipitation,    stations West-wide
                                           other weather
                                           obs.

 Snow course         In situ measurement   SWE, snow           178 courses in          West-      Monthly or
 (NRCS)                                    depth, snow          CO/UT/WY               wide      semi-monthly
                                           density

 COOP                In situ measurement   Snowfall,         100s of sites, though    US-wide       Daily
 (NOAA;                                    snow depth,      few at high elevations
 volunteer                                 daily
 observers)                                precipitation

 CoCoRaHS            In situ measurement   Snowfall,        1000s of sites, though    US-wide       Daily
 (volunteer                                snow depth,      few at high elevations
 observers)                                daily SWE
                                           accumulation

Section 1. Why a snowpack user guide?                                                                           2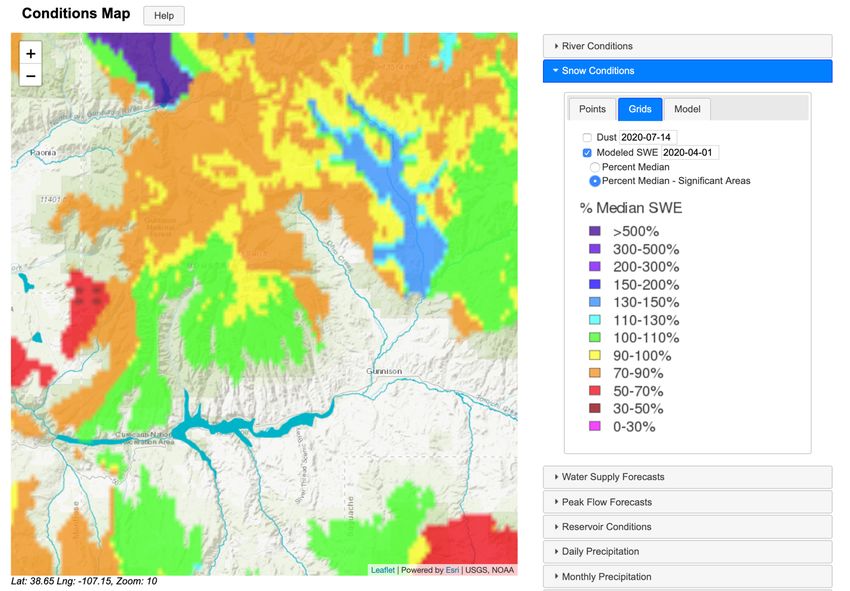
Snowpack Monitoring in the Rocky Mountain West: A User Guide

 Network or        Method and input         Snow             Spatial resolution or #    Spatial       Temporal
 Product           data                     variables               Stations           coverage       resolution

 ASO               Integrated airborne      SWE, snow                50 m                  By        As flights are
 (NASA JPL)        lidar and imaging        depth, snow                                watershed       made on
                   spectrometer             albedo, snow                               as flights      demand;
                   measures snow            grain size,                                are made      typically 1-6
                   depth and albedo;        dust radiative                                 on         per season
                   fusion with              forcing                                     demand
                   measured/modeled
                   snow density
                   produces SWE

 MODSCAG           MODIS satellite          Fractional              ~500 m              US-wide      Daily, 2-4 day
 (NASA JPL)        imagery used to          snow-covered                                                   lag
                   derive snow extent       area, snow
                   and properties           grain size

 MODDRFS           MODIS satellite          Radiative               ~500 m             North and     Daily, 2-4 day
 (NASA JPL)        imagery used to          melt forcing                                 South             lag
                   derive snow                                                          America
                   properties

 SNOW-17 snow      Snow model using         SWE, snow        ~600 modeling units         CBRFC           Daily
 model             area-averaged            covered area     in the Colorado River      domain
 (NOAA CBRFC       precipitation data                                Basin             (Colo. Riv.
 and other RFCs)   derived from point                                                  Basin + E.
                   observations, plus                                                    Great
                   freezing-level data                                                   Basin)

 SNODAS            Snow model               SWE, snow                1 km               US-wide          Daily
 (NOAA             assimilates satellite,   depth,
 NOHRSC)           airborne, and in situ    snowmelt,
                   snow data and            sublimation,
                   weather obs              snow
                                            temperature

 SWANN &           Snow model and           SWE, snow                1 km               US-wide          Daily
 SnowView          neural network           cover
                   algorithm, uses
 (Univ. of
                   SNOTEL SWE and
 Arizona)
                   MODSCAG snow
                   area

 MODIS-based       Statistical model        SWE                     ~500 m             Southern      Typically 4-8
 CU-SWE            blending SNOTEL,                                                     Rockies      per season,
 (Univ. of         MODSCAG,                                                             domain        3-7 day lag
 Colorado)         physiography,
                   analog historical
                   SWE pattern

Section 1. Why a snowpack user guide?                                                                                 3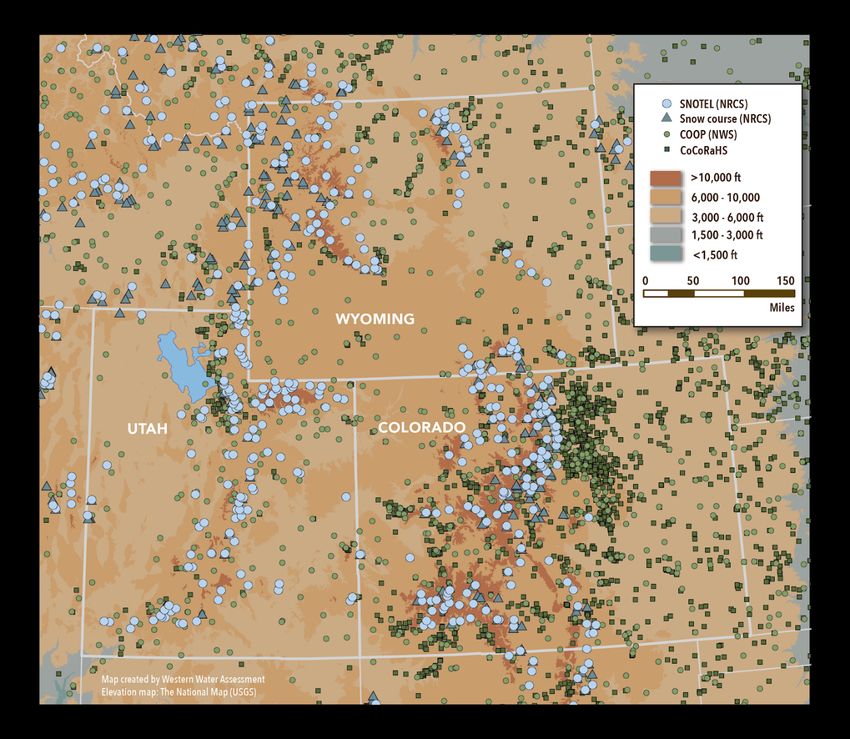
Snowpack Monitoring in the Rocky Mountain West: A User Guide

Section 2. Understanding the snowpack
How do we know how much water is in the snowpack? The depth, density, and areal extent of the
snowpack changes over time, making answering this question particularly challenging. One foot of
densely packed snow will contain more water than one foot of newly fallen, loose snow. The metric most
commonly used to integrate snow depth and density and thereby express the amount of water
contained in the snowpack is snow water equivalent, or SWE. SWE can be thought of as the depth of
water (e.g., in inches) that would result if you melted a column of the snowpack.

SWE expresses the depth of water contained in the snow at a particular site; point observations of SWE
are often used as proxies or predictors for water volume in an area or basin. This simplification works
well for most locations and basins most of the time, but a multi-dimensional perspective of the snowpack
can track snow conditions more accurately than point observations can. Spatially explicit monitoring of
the snowpack can represent the areal distribution of snow, but it takes more effort and additional data
and tools, and may not always be achievable. That said, conceptualizing the snowpack in all dimensions
can help us better understand and compensate for limitations of the network of point observations.

Broad aspects of the spatial distribution and temporal evolution of the snowpack are fairly consistent
from one year to another. However, the details within these generalized patterns can vary greatly from
year to year and from basin to basin. Many individual weather events shape the snowpack: storm
dynamics that build snow accumulations, wind events that redistribute and help sublimate snow, and
heat waves that drive rapid snowmelt. The aggregate of these events, and their complex interactions
with the terrain and vegetation, give each snow season a unique form over space and time.

Overall spatial pattern
We start by describing the generalized spatial pattern of the snowpack. The most prominent and
consistent aspect of that pattern is that snow depth and SWE generally increase with increasing
elevation at least up to treeline. This gradient is a consequence of multiple factors:

    •   Higher precipitation, due to orographic lift of moist air masses.
    •   Larger fraction of precipitation falling as snow, due to lower temperatures at higher elevations.
    •   Lower sublimation and mid-season snowmelt, also due to lower temperatures.

Above treeline, snow depth and SWE may no longer increase with elevation in a given area, or may even
decrease, depending on an area’s exposure to high winds. Wind can prevent snow accumulation on
windward slopes and can increase sublimation and cause scour in locations where snow does
accumulate. There is also evidence that the elevational gradient in precipitation may flatten out at the
very highest elevations.

In a given area, snow depth and SWE are also generally higher on north-facing slopes and lower on
south-facing slopes, due to differential inputs of solar radiation and thus sublimation and snowmelt. The
prevailing flow of moisture in the region is coming from the west throughout the cool season, which

Section 2. Understanding the snowpack                                                                       4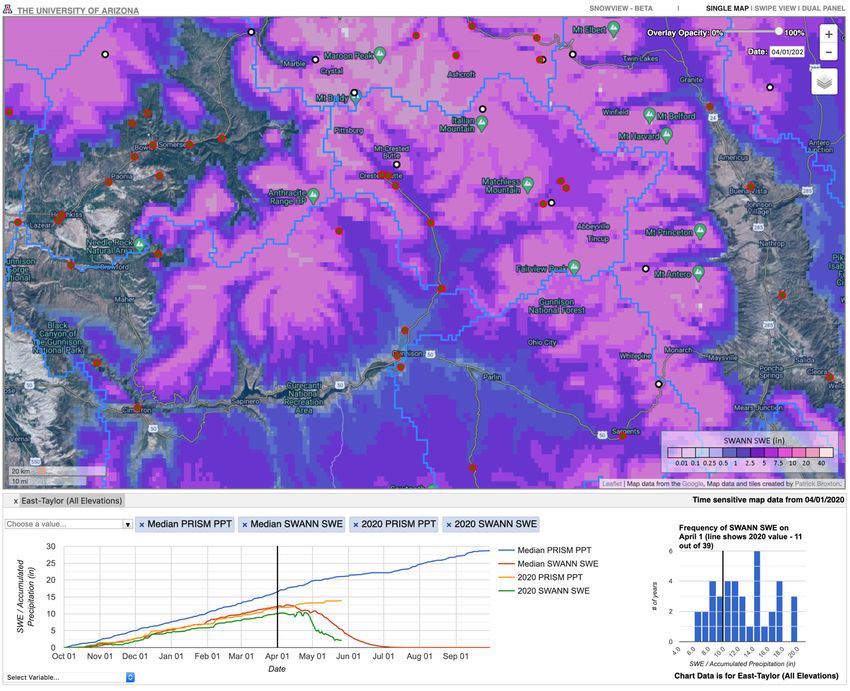
Snowpack Monitoring in the Rocky Mountain West: A User Guide
means that mountain areas on the west side of major drainage divides, such as the Continental Divide,
tend to accumulate more snow at a given elevation than the slopes on the east side.
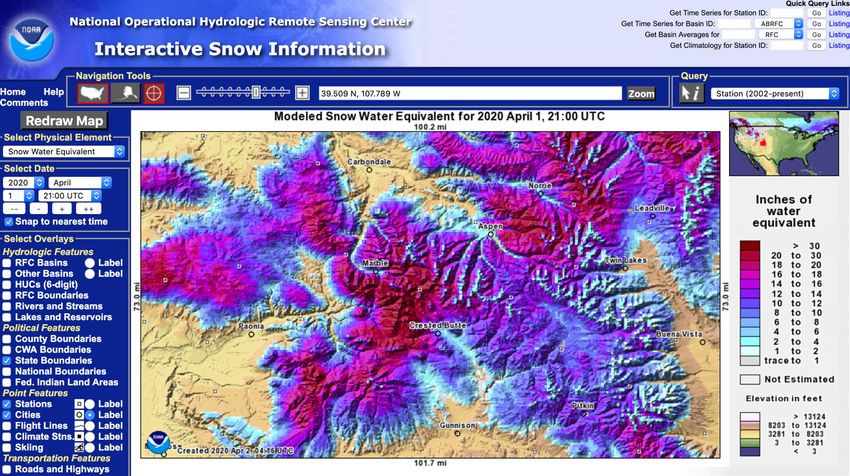
Figure 2 below shows a typical distribution of SWE across the Rocky Mountain West on April 1st, near the
seasonal peak.
Figure 2. “Typical” pattern of April 1 SWE amounts across the Rocky Mountain West, with higher
SWE at higher elevations and lower SWE at lower elevations. April 1, 2009, depicted here, had
near-normal depths at most SNOTEL sites in the region. (Source: Map of SWE estimates from
SnowView)
Snowpack accumulation and losses prior to spring snowmelt
The region’s snowpack accumulates over a 4 to 7-month period, with accumulation typically beginning in
October at higher elevations across most of the region, and later in the fall and early winter in locations
that are further downslope or southward. The peak SWE value in wind-sheltered locations at high
elevations, where SNOTEL stations are typically located, generally averages 15”–50” 4.
Section 2. Understanding the snowpack 5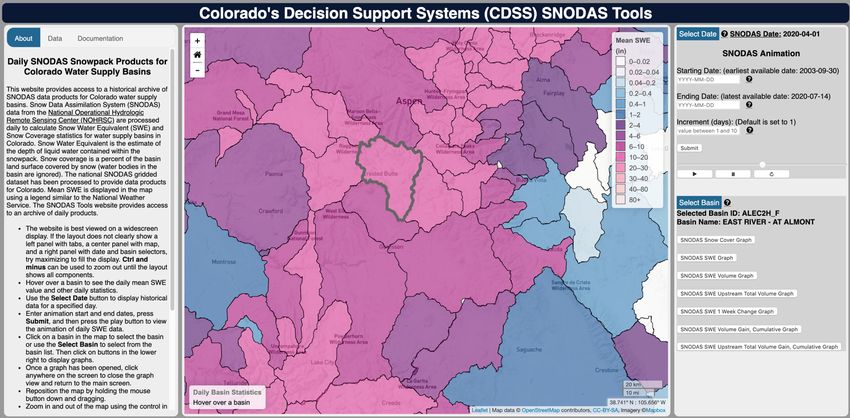
Snowpack Monitoring in the Rocky Mountain West: A User Guide

Field studies and modeling 5–7 suggest that the equivalent of 10–20% of peak SWE in the Rocky
Mountain West is lost to sublimation—the transition of water from snow and ice directly to water vapor—
during the course of the season. The highest losses occur during the spring months, March through May,
when air temperatures and shortwave solar radiation are higher. Most of this sublimation loss is
embedded in the overall downward trend of the snowpack during the spring melt. Sublimation losses
from the snowpack are less than the evaporation losses that would occur if the same amount of
precipitation fell as rain.

The overall winter climate (November–March) at high elevations in Colorado, Utah, and Wyoming is even
colder than in the other mountain regions of the western U.S., such as the Sierra Nevada, Cascades, and
northern Rockies 8. This means that the snowpack itself is colder, and thus less prone to melt prior to the
spring peak.

Spring snowmelt
The spring melt of the snowpack occurs over the span of 2 to 3 months. Snowmelt typically begins in
earnest in April or May in a normal snow year. Snowmelt is driven primarily by greater shortwave
radiation due to higher sun angles and longer days. However, higher air temperatures—especially when
overnight low temperatures are above freezing—prime the snowpack for faster melt. Once the snowpack
becomes isothermal, measuring 32°F (0°C) throughout its depth profile, rapid melt can occur.

The snowmelt rate is enhanced when the snow surface is dusty. In the past few decades, the dust-on-
snow phenomenon has become more frequent in the region due to drier conditions, soil disturbance,
and vegetation loss in the main dust source areas in the Colorado Plateau. Dust is deposited on the
snowpack continuously, but it can be deposited in denser layers on the snowpack during distinct, usually
dry, wind events. Typically, 3 to 10 dust-on-snow events affect parts of the region each spring,
particularly in southwestern Colorado and southern Utah. The aggregate dust loading and thus impact
on melt rates varies substantially from year to year 9–11.

Translation from snow to runoff
As noted above, the spring snowmelt drives most of the region’s overall streamflow. But the translation
from snowpack to runoff is not as straightforward as it might appear. Only a portion of each spring’s
snowmelt runs off directly to streams and rivers that same season. Instead, much of the snowmelt soaks
into the soil, infiltrates deeper, and becomes new groundwater, which then displaces and pushes out a
proportional volume of older, stored groundwater toward the stream channel. This process is illustrated
in Figure 3.

Section 2. Understanding the snowpack                                                                     6
Snowpack Monitoring in the Rocky Mountain West: A User Guide

                Figure 3. Schematic representation of the route of snowmelt from snowpack to
                streamflow. Only a portion of snowmelt runs off directly to streams and rivers,
                while much of the snowmelt becomes new groundwater, which then pushes
                older groundwater to the stream channel.

Critically, if the soil is abnormally dry, it will soak up a decent fraction of the snowmelt first, before any
snowmelt infiltrates deeper. This phenomenon was evident in the 2020 Colorado River spring runoff,
which was lower than would have been expected based on the precipitation and snowpack alone. Dry
soils carried over from the very dry fall of 2019 absorbed much of the snowmelt, reducing the amount of
water available for runoff.

Taken together, while the size of the snowpack is generally a good gage of the magnitude of the spring
runoff, we shouldn’t expect to see all of the water volume in a basin’s snowpack at its peak to become
runoff. Some will be lost to sublimation and evaporation, and some will be diverted to replenish soil
moisture and ultimately lost to evapotranspiration. Importantly, this fraction will vary from year to year,
typically being higher in wet years, and lower in dry years.

Recent trends in snow
The peak water volume of the region’s snowpack (e.g., April 1 SWE) is mainly determined by the amount
of cold season precipitation, but it can also reflect variation in other weather factors—temperature,
humidity, wind, and solar radiation—that influence snow loss (sublimation and melt). Of these factors,
temperature has an obvious and statistically significant recent trend. Temperatures in the three-state
region increased in all seasons, and about 2°F overall, over the past 40 years. This warming trend, both
regionally and globally, has been largely attributed to anthropogenic climate change. Cold season
precipitation also appears to show a downward trend over the past 40 years, but given the high
variability in precipitation, this could be due to natural variability 12.

A number of recent studies have noted substantial declining trends in April 1 SWE at locations across the
western U.S. over the most recent 30 to 70 years. All of these studies indicate that rising temperatures
have played a role in causing the observed declines in SWE. Generally, reduced cold season

Section 2. Understanding the snowpack                                                                            7
Snowpack Monitoring in the Rocky Mountain West: A User Guide precipitation since 2000 has also contributed. These and other studies also show a pervasive shift toward earlier snowmelt and peak runoff across the West, typically occurring 1-4 weeks earlier than in the 20th century. Again, rising temperatures are believed to have played a role, along with reduced precipitation—smaller snowpacks peak and melt earlier—and increasing dust-on-snow impacts. When snowmelt initiates earlier in the spring, average melt rates are lower on average. Slower melt actually tends to lead to less efficient runoff, as snow is more prone to being sublimated away during an extended melt season. Expected future changes in snow All climate models project that the recent warming trend for the region will continue, if not accelerate, depending on the trajectory of greenhouse gas emissions and uncertain feedbacks in the climate system. Due to this continued warming, future hydrologic projections for the Rocky Mountain region show a strong tendency toward future declines in April 1 SWE 4 (and references therein), despite modest projected increases in winter and early spring precipitation. This strong tendency toward decreased April 1 SWE reflects multiple effects of the projected warming: a shift toward precipitation falling as rain instead of snow, greater sublimation and melt of the snowpack throughout the season, and a shift toward earlier snowmelt in the spring. These warming-related effects are strongly modulated by elevation, with snowpack at higher elevations seeing less impact from warming as a percentage of current snowpack than at lower elevations. The general mid-range of the projected change in April 1 SWE by mid-century is a loss of roughly 10% to 20% 13. These declines in SWE are expected to be greater by mid-century at lower elevations in the snowpack zone (roughly 8,000-10,000’ in Colorado) and in southern parts of the Colorado River Basin where the winter climate is not as cold, the snowpack is shallower, and the snow season is shorter. Even at higher elevations (above 11,000’ in Colorado), spring snowpacks are expected to decline 4. Section 2. Understanding the snowpack 8
Snowpack Monitoring in the Rocky Mountain West: A User Guide

Section 3. Monitoring the snowpack: SNOTEL and snow
courses
For over 80 years, snowpack monitoring and water supply forecasting in the western U.S. has relied on a
network of in situ, ground-based observations (point measurements) managed and maintained by the
NRCS along with state and local cooperators. From the mid-1930s until the late 1970s, these
observations came solely from snow courses that were manually measured monthly or semi-monthly,
from January through May or June. Starting in the late 1970s, the snow courses have been increasingly
augmented by, and at many sites replaced by, automated SNOTEL (SNOwpack TELemetry) stations.
Currently, the SNOTEL stations carry the vast majority of the load for operational monitoring, but snow
courses are still critical for validation purposes and for the continuation of long-term records, which
extend back as far as 85 years in some locations. SNOTEL data are used to construct, calibrate, and
validate other snow data products, including those described in Section 4.

In addition to the foundational SNOTEL and snow course point observations, the COOP (Cooperative
Observer Program) and CoCoRaHS (Community Collaborative Rain, Hail, and Snow) programs provide
useful supplemental snow data collected by volunteer observers. These monitoring programs are also
described below.

SNOTEL stations

The key element of the SNOTEL station is the snow pillow: large (1.5-3.0 m wide) bladders of stainless
steel or synthetic rubber containing an antifreeze solution that are buried so that their upper surface is at
ground level. As snow accumulates on the pillow, it exerts pressure on the bladder, and this pressure
caused by the weight of the snow is measured and converted into snow water equivalent (SWE).

SNOTEL stations also collect data on snow depth, all-season precipitation (frozen and liquid), and air
temperature with daily maximums, minimums, and averages. Many enhanced SNOTEL sites also have
sensors for collecting soil moisture and soil temperature measurements at various depths, as well as solar
radiation, wind speed, and relative humidity (Figure 4). The data collected at SNOTEL sites are generally
reported hourly.

Real-time data collected at SNOTEL sites are transmitted to the NRCS Water and Climate Information
System using one of three telemetry systems, depending on the location of the station: meteor burst
(most stations), satellite, or cellular.

Section 3. Monitoring the snowpack: SNOTEL and snow courses                                                 9
Snowpack Monitoring in the Rocky Mountain West: A User Guide

   Figure 4. SNOTEL automated collection site. Source: NRCS
   (https://www.wcc.nrcs.usda.gov/about/mon_automate.html).

Currently, there are 336 SNOTEL sites within the region: 115 in Colorado, 132 in Utah, and 89 in
Wyoming (Figure 5). Each site receives preventative maintenance and sensor adjustment annually. The
reliability of each SNOTEL site is verified by ground truth measurements taken during regularly
scheduled manual surveys. These readings are compared with the telemetered data to check that values
are consistent and compatible. For more information about SNOTEL, visit
https://www.wcc.nrcs.usda.gov/about/mon_automate.html.

Section 3. Monitoring the snowpack: SNOTEL and snow courses                                        10
Snowpack Monitoring in the Rocky Mountain West: A User Guide

Snow courses
Snow courses are typically about 1,000 feet (300 meters) long and located in small meadows protected
from the wind. They consist of a variable number, typically 5 to 10, of equally spaced individual sample
points. Snow surveyors use tubular aluminum snow samplers at each sample point to weigh the snow to
determine the snow-water equivalent, and also measure the snow depth (Figure 6). The SWE
measurements from each sample point are averaged to determine the site value.

    Figure 5. Locations of in-situ snow observing sites in the Rocky Mountain West (CO, UT, WY). The
    NRCS SNOTEL and snow course sites are focused on snow observations at higher elevations, and
    under normal operations, SWE measurements are available from all of the sites shown. The COOP
    and CoCoRaHS (see ‘Other in situ snow observations’, p. 18) networks have broader purposes but
    typically report snow observations (e.g., daily snowfall and daily SWE accumulation) from many,
    though not all, of the sites shown. The vast majority of COOP and CoCoRaHS sites are at elevations
    below the SNOTEL/snow course network.

Section 3. Monitoring the snowpack: SNOTEL and snow courses                                            11
Snowpack Monitoring in the Rocky Mountain West: A User Guide
Since snow courses have a larger measurement “footprint” than SNOTEL snow pillows, snow-course
SWE measurements are somewhat more spatially representative than SNOTEL SWE observations. But
snow-course measurements are carried out only monthly or semi-monthly, compared to hourly for
SNOTEL. Monthly manual SWE measurements are still taken at 178 snow courses in the region: 92 within
Colorado, 23 within Utah, and 63 within Wyoming (Figure 5). For more information about snow courses,
visit https://www.wcc.nrcs.usda.gov/about/mon_manual.html.
Figure 6. After clearing out any soil from the tube, the surveyor determines the amount
of water in the snowpack by weighing the tube with its snow core and subtracting the
weight of the empty tube. Source: NRCS (www.wcc.nrcs.usda.gov/factpub/sect_4a.html)
Limitations of the SNOTEL/snow course networks
SNOTEL sites and snow courses provide very accurate point measurements. These point measurements,
when aggregated across multiple sites, also do a decent job of representing the relative snow conditions
in the vast majority of a watershed that is not measured directly. However, there are general limitations
related to the coverage of these networks. Due to siting constraints and cost considerations, SNOTEL
sites and snow courses are not located on slopes, above treeline, or at lower elevations where snowpack
is generally low or intermittent. In Colorado, for example, the vast majority of SNOTEL sites and snow
courses are located in the elevation band between 9,000’ and 11,000’ (Figure 5).
Thus, in seasons with unusual spatial patterns—for example, a spring with abnormally low sublimation
loss above treeline, or unusually high mid-winter melt on south-facing slopes, or unusually high
accumulation at lower elevations relative to higher elevations—the SNOTEL and snow course
measurements may not collectively capture the actual basin-wide SWE conditions.
Section 3. Monitoring the snowpack: SNOTEL and snow courses 12Snowpack Monitoring in the Rocky Mountain West: A User Guide
Also, SNOTEL and snow course sites are not evenly distributed through the mountain headwaters. Some
headwaters catchments have relatively fewer sites, or lack in situ sites completely. Monitoring for those
catchments relies on sites in neighboring watersheds—where snow conditions will be comparable in
most years, but not all years. According to the Colorado Basin River Forecast Center (CBRFC), it is likely
that there is greater streamflow forecast error related to snowpack conditions in these data-sparse areas,
though no quantitative analysis has been done to confirm this.
In situ snow data are also subject to non-climatic influences that may decrease the spatial
representativeness of the information from a given station. In particular, changes in the vegetation
surrounding a SNOTEL site or snow course, such as from beetle infestation or wildfire, can impact snow
accumulation and melt. This can affect the site’s suitability for real-time monitoring as well as its use for
assessing long-term trends. For example, the Trapper Lake SNOTEL in the White River Basin in
northwestern Colorado was impacted by wildfire and now shows much lower SWE values than nearby
sites due to wind scour. Because of this, NRCS no longer uses Trapper Lake in calculating basin-wide
SWE conditions. Vail Mountain SNOTEL in the Eagle River Basin in central Colorado was impacted by
the mountain pine beetle infestation and subsequent tree removal. This SNOTEL site now appears to
accumulate less SWE, and to melt out faster, than it did prior to the beetle infestation.
Interpreting SNOTEL/snow course SWE information
A number of considerations factor into interpretation of SNOTEL and snow course SWE information:
• The percent of normal values are less helpful, and potentially misleading, in the early season or
the late season, when even a very small observed value may appear to be a huge percentage of
a near-zero normal.
• In late spring, there is always some snow remaining in a watershed, sometimes a lot--even after
all of the SNOTEL observed values have dwindled to zero.
• Because of local microclimates and other conditions, observations from SNOTEL sites just a
short distance apart may show surprisingly large differences in percent of median values.
• When using percent of normal data, ask “What is the normal?” Is it the median (usually) or the
mean? Because SWE observations cannot drop below zero, but can occasionally be extremely
high, historical SWE values are not symmetrically distributed on either side of the mean, and the
median is usually lower than the mean.
• Check the time period over which the normal is calculated (usually 1981-2010, but not always).
• Be attentive to systematic differences in both SWE and % of normal SWE within a watershed,
either with elevation, or with north-south and east-west orientations.
Section 3. Monitoring the snowpack: SNOTEL and snow courses 13Snowpack Monitoring in the Rocky Mountain West: A User Guide Other in-situ snow observations (CoCoRaHS, COOP, CODOS) Additional in situ snow observations from networks of volunteer observers can help fill out the picture of the snowpack, particularly at lower elevations. Note that these observations are principally for snowfall and snow depth. CoCoRaHS (Community Collaborative Rain Hail and Snow) observations Since its initiation in 1997, the CoCoRaHS network (Figure 5) has become an important supplemental source of precipitation data for weather and climate monitoring and other purposes. The volunteer observers who make up the CoCoRaHS network are encouraged to record snow measurements along with their daily precipitation observations, including snowfall, daily SWE accumulation, snow depth, and total SWE on the ground. Most CoCoRaHS observers do record snowfall and the daily SWE accumulation, and most of those also record snow depth, though far fewer of them measure and record total SWE on the ground. For example, on a typical day in March 2019, roughly 100 CoCoRaHS observers in western Colorado reported snowfall, snow depth, and the daily SWE accumulation, and roughly 20 of them also reported total SWE on the ground. For more information about CoCoRaHS, visit https://www.cocorahs.org/. COOP snow observations The Cooperative Observer Program (COOP) of the National Weather Service (NWS) has more than 10,000 volunteers who take daily weather observations in urban and suburban areas, at National Parks, seashores, and farms (Figure 5). Most stations in the COOP weather observer network in the Rocky Mountain region report daily snowfall and snow depth on the ground, in addition to temperature and precipitation. For example, on a typical day in March 2019, 40 of 56 COOP observers in western Colorado reported snowfall and snow depth. For more information about COOP, visit https://www.weather.gov/rah/coop. CODOS dust-on-snow observations As described above, the dust load on snow can influence the melt rate of the snowpack, and therefore affect the accuracy of streamflow forecasts. The Colorado Dust-on-Snow (CODOS) program is part of the Center for Snow and Avalanche Studies (CSAS). CSAS monitors the presence/absence of dust layers at 11 mountain pass locations throughout Colorado. The CODOS program uses those observations, data from nearby SNOTEL sites, and weather forecasts to issue a series of analyses of how dust-on-snow is likely to influence snowmelt timing and rates during the runoff season. For more information about CODOS, visit http://www.codos.org/. Based on the work of CSAS researchers and others, CBRFC now uses satellite data (described in the next section) showing the dust loading to adjust melt rates in their forecast model. Section 3. Monitoring the snowpack: SNOTEL and snow courses 14
Snowpack Monitoring in the Rocky Mountain West: A User Guide

Section 4. Monitoring the snowpack: Remote sensing
and spatial modeling

Remote sensing of snow (ASO, MODIS)
Remote sensing from satellite or airborne platforms provides spatially continuous data that can usefully
complement the point SWE data from SNOTEL or other in situ observations. In the Colorado River Basin,
remotely sensed snow data are being increasingly deployed and integrated into snowpack monitoring
and runoff forecasting systems. It is important to note that remote sensing products generally have
inherent uncertainties not shared by in situ measurements. For example, snow coverage itself is not
directly sensed, but instead is derived from reflected radiation from the surface, and the algorithms have
trouble distinguishing the signature of clean snow from that of clouds. In general, airborne products are
more reliable and have higher spatial resolution than satellite products, mainly due to the sensor being
roughly 100-1000 times closer to the land surface. However, satellite observations have much broader
spatial coverage.

Airborne Snow Observatory (ASO) observations
The Airborne Snow Observatory (ASO) is an airborne sensing, modeling, and processing system
developed by NASA Jet Propulsion Laboratory (NASA JPL) in 2013 and is now operated as a private
enterprise led by former NASA researchers. It carries a very high-resolution scanning LiDAR (Light
Detection and Ranging) sensor that can accurately measure snow depth as the difference between the
current snow surface height and the land surface height as measured during a previous flight under
snow-free conditions. Observed or modeled snow density, or both, is then used to translate the snow
depth data into SWE, resulting in a spatial SWE product with a 50-m resolution. A second sensor, an
imaging spectrometer, also measures snow albedo and thus the radiative melt forcing from dust-on-
snow. Of the remote sensing systems, ASO produces the most accurate estimates of spatial variability in
SWE across large areas (tens of km), with errors on the order of 1-2 cm of SWE, and typically provides
direct estimates of snow-water volume with full watershed coverage.

ASO has been primarily deployed operationally in several basins in California’s Sierra Nevada, but its use
has been increasing in the Rocky Mountains. In western Colorado, ASO has been flown as part of pilot
projects in the Uncompahgre Basin (2013–2017), Rio Grande and Conejos Basins (2015-2017), Gunnison
Basin (2016, 2018–19), over Grand Mesa (2013–2017), and in the Blue River watershed (2019). Typically,
1–6 flights are carried out per basin per season. For the spring of 2021, flights are planned in the Blue
River watershed, and in the Conejos, Animas, Dolores, and Upper Gunnison basins. For more
information about ASO, visit https://www.airbornesnowobservatories.com.

MODIS satellite products
MODIS (Moderate Resolution Imaging Spectroradiometer) is a moderate-resolution (500 m for most
products) multi-spectral sensor that is currently on two different satellites, Aqua and Terra, with daily
near-global coverage and data availability back to 2000. NASA JPL developed and continues to refine

Section 4. Monitoring the snowpack: Remote sensing and spatial modeling                                     15
Snowpack Monitoring in the Rocky Mountain West: A User Guide

two snow-specific data products from MODIS that are made available in near real-time: one that depicts
fractional snow-covered-area and snow-grain size (MODIS Snow Covered Area and Grain-size, or
MODSCAG) and one that depicts the radiative melt forcing from dust-on-snow (MODIS Dust Radiative
Forcing in Snow, or MODDRFS). While MODSCAG does not capture SWE, it can be integrated with in
situ observations to better represent the distribution of SWE across a landscape. The MODSCAG
product is a key input to the CU-SWE spatial snow product described below. For more information
about MODIS, visit https://modis.gsfc.nasa.gov and read Painter et al (2009) 14.

Spatially distributed snow modeling (SNOW-17, SNODAS, SWANN, CU-
SWE)
Spatially distributed snow modeling integrates observed meteorological and snow conditions with
modeled physical processes, including the effects of topography, to produce snowpack estimates
specific to each location or grid cell across a basin. For water supply purposes, the key output of such
modeling is an estimate of SWE for each pixel or other modeling unit, such that the total volume of
basin-wide SWE can be calculated directly from the smaller units. In principle, spatially distributed snow
modeling compensates for the key limitations (spatial density, representativeness, and elevational
coverage) of the SNOTEL network. Perhaps just as critically, spatially distributed modeling also
generates insights into processes, sensitivities, and patterns in time and space that are difficult or
impossible to glean from point observations alone.

However, it is important to note that the different modeled snow products are not independent of
SNOTEL. All of the products described below calibrate and/or validate their respective models on
SNOTEL data, and a few also directly assimilate SNOTEL data to inform the SWE estimates. In general,
they use modeled spatial SWE estimates and remotely sensed snow data to effectively spread the
SNOTEL observations across the landscape, generating a snowpack that is consistent with the SNOTEL
observations but that fills in the spatial gaps and detail missed because of topography and other factors.
Accordingly, the SWE estimates from these products—with the exception of ASO—will have lower
uncertainty within the elevation band where the SNOTEL network is predominantly located, and higher
uncertainty at elevations above and below that band.

It is also difficult to independently validate the accuracy of these spatial SWE products because of their
incorporation of SNOTEL data. Comparing them to each other can identify systematic differences, but
not which product is “right.” ASO SWE data, however, can serve as a viable reference for those basins
on specific dates for which ASO flights have been carried out.

CBRFC modeled SWE (SNOW-17)
For operational streamflow forecasting, the CBRFC pairs a snow model (SNOW-17) with a hydrology
model (Sac-SMA). SNOW-17 is run in a spatially “lumped” or partially distributed framework, meaning
that area averages are calculated for each modeling unit, with each unit typically representing an
elevation zone, of which there are usually three in each watershed. The mean area precipitation for a

Section 4. Monitoring the snowpack: Remote sensing and spatial modeling                                    16
Snowpack Monitoring in the Rocky Mountain West: A User Guide

modeling unit is calculated from the precipitation observations at one or more SNOTEL or COOP
stations using weightings determined by model calibration and the PRISM precipitation climatology.

SNOW-17 then builds a simulated snowpack, using the temperatures observed at the SNOTEL sites and
local freezing levels, to determine whether precipitation is falling as snow or rain and whether the
snowpack is accumulating or ablating. Historical precipitation observations are used to calibrate the
snow model. The model effectively estimates a snow-water volume for each modeling unit, and thus for
each watershed, sub-basin, and basin, which is then used to model the forecasted spring-summer
streamflow volume. The model allows snow to persist at the highest elevations even after most or all
SNOTEL sites have melted out, consistent with the real-world behavior of the snowpack. For more
information on SNOW-17, visit
https://www.wcc.nrcs.usda.gov/ftpref/wntsc/H&H/snow/AndersonSnow17.pdf.

Snow Data Assimilation System (SNODAS)
The Snow Data Assimilation System (SNODAS) is a physically based energy and mass-balance snow
model, driven by near real-time weather variables that can assimilate available snow data from remote
sensing and in situ measurements. SNODAS was developed by NOAA’s National Operational
Hydrologic Remote Sensing Center (NOHRSC) and has been produced operationally for the U.S. since
2004. SNODAS estimates multiple snow characteristics on a daily basis by merging satellite, airborne,
and in situ snow data with modeled depictions of snow cover. The snow variables that are modeled and
made available include SWE, snow depth, snowmelt, sublimation, and snowpack average temperature.
Model calibration and validation are focused primarily on SWE because of its importance to water
management. Both COOP and CoCoRaHS snow observations are now being incorporated into the
NOAA SNODAS products. For more information on SNODAS, visit
https://nsidc.org/sites/nsidc.org/files/files/nsidc_special_report_11.pdf.

Snow Water Artificial Neural Network Modeling System (SWANN)
The SWANN modeling system is a research product developed at the University of Arizona that uses
snow models, assimilated in situ SWE data, and artificial neural networks (ANNs; a type of machine
learning) to generate gridded estimates of SWE and snow cover. SWANN was prototyped for the Salt
River Basin in Arizona, in collaboration with the Salt River Project (SRP) but is available for the whole U.S.
The SWANN SWE estimates, which are available back to the early 1980s, use ANNs to account for local
variations in topography, forest cover, and solar radiation, while the snow cover estimates (generated on
a limited basis) use ANNs that are applied to Landsat and MODIS satellite reflectance data. The models
are trained with in situ SWE observations and aerial LiDAR SWE estimates from across the southwestern
U.S. The SWANN SWE data are produced in near real-time and delivered to SRP via a prototype
decision support tool that provides daily-to-annual operational monitoring of spatial and temporal
changes in SWE and snow cover conditions. The product now covers the conterminous U.S. and includes
35+ years of daily SWE estimates, allowing it to be used in modeling applications that require long-term
SWE records. More information may be found at this link: https://nsidc.org/data/nsidc-0719.

Section 4. Monitoring the snowpack: Remote sensing and spatial modeling                                     17
Snowpack Monitoring in the Rocky Mountain West: A User Guide

MODIS-based spatial SWE estimates (CU-SWE)
CU-SWE, a research product developed at the University of Colorado, blends observed SWE from
SNOTEL and CoCoRaHS, concurrent MODSCAG snow-covered data, physiographic variables that affect
snow (elevation, latitude, upwind barriers, and slope), and an analogous historical daily SWE pattern
(from 2000–2012) that had been generated using historical MODSCAG data and an energy-balance
snow model. This results in near real-time (3-7-day lag) spatial estimates of SWE at a 500-m resolution.
This product has been generated over a Sierra Nevada domain roughly biweekly during February to
June for California water managers since 2012. The methodology has been refined and extended to a
Southern Rockies domain that includes the snow accumulating areas in Colorado, eastern Utah, and all
but far northern Wyoming. The SWE data are distributed in a multi-page report that includes maps, a
summary of current conditions, and summary statistics. From 2018-2020, the Southern Rockies SWE
estimates were produced and distributed 4-5 times per season with the support of Western Water
Assessment. The developers hope to produce them again for winter-spring 2021.

The Mountain Hydrology Group at CU Boulder provides reports that contain an experimental research
product that provides near-real-time estimates of SWE for the Sierra Nevada mountain range in
California and the Intermountain West region (Colorado, Utah and Wyoming) from mid-winter through
the melt season. These reports can be found at this link: https://instaar.colorado.edu/research/labs-
groups/mountain-hydrology-group/services-detail/.

Section 4. Monitoring the snowpack: Remote sensing and spatial modeling                                    18
Snowpack Monitoring in the Rocky Mountain West: A User Guide

Section 5. Applying snowpack data: Seasonal streamflow
forecasting
Water users and providers in the Colorado-Wyoming-Utah region rely on forecasts of runoff timing and
amounts made by the Natural Resource Conservation Service (NRCS) and the NOAA River Forecast
Centers (RFCs). Other entities produce streamflow forecasts, but the forecast guidance from these two
agencies is the most commonly consulted in our region. These forecasts, which are critical to water
operations and management in the region, are briefly described in this section of the guide and
summarized in Table 2. More in-depth descriptions of methods are linked in the discussion below.

NRCS forecast methods
The snow-course and SNOTEL networks in the western U.S. were specifically developed by NRCS to
support their seasonal water supply forecasts, as well as for general snow monitoring. Thus, the
characteristics of these networks have influenced the NRCS water supply forecasting approach, and vice
versa. In this forecast approach, statistical regression modeling is used to relate several predictors—
typically water-year-to-date precipitation and current SWE from SNOTEL sites—to the target predicted
value: spring-summer streamflow at a given forecast point. NRCS models are calibrated on historical
data at particular sites and are applied to real-time predictor data to produce runoff forecasts at
individual stream gages. Point-based measurements are well suited for this statistical approach—it
requires a limited number of predictors to represent the basin snowpack above the stream gage being
forecasted. More information can be found at:
https://www.nrcs.usda.gov/wps/portal/wcc/home/aboutUs/waterSupplyForecasting/.

NOAA RFC forecast methods
Seasonal water supply forecasts for the Great Basin and the Colorado River Basin are provided by
NOAA’s Colorado Basin River Forecast Center, or CBRFC. Streamflow forecasts for Wyoming’s North
Platte River and Colorado’s Front Range are provided by the Missouri Basin River Forecast Center
(MBRFC) and Arkansas-Red Basin River Forecast Center (ABRFC), while the Snake River headwaters in
western Wyoming are covered by the Northwest River Forecast Center (NWRFC). The Rio Grande
headwaters in southwestern Colorado are covered by the West Gulf River Forecast Center.

All of these RFCs use the same forecast tools for seasonal water supply, but they produce and distribute
their operational forecasts differently. The two tools are (1) a statistical forecast method very similar to
that used by the NRCS, and (2) a more physically based conceptual hydrologic modeling system that
produces an ensemble of equally likely streamflow sequences (Ensemble Streamflow Prediction, or ESP).
More information can be found in Chapter 8 of the Colorado River Basin Climate and Hydrology State of
the Science Report 15 and https://www.cbrfc.noaa.gov/wsup/doc.php. All of these RFCs (and the
California Nevada RFC) produce a Western Water Supply Forecast Page, which takes forecasts from the

Section 5. Applying snowpack data: Seasonal streamflow forecasting                                             19
Snowpack Monitoring in the Rocky Mountain West: A User Guide

Western RFCs and puts them all on a single page
(https://www.cbrfc.noaa.gov/wsup/graph/west/map/esp_map.html).

Table 2. Key characteristics of the NRCS and NOAA RFC seasonal water supply forecasting approaches.

                                         NRCS                                     NOAA RFC

 Primary forecast        Statistical modeling (principal           Conceptual spatially lumped process
 tool/model              components regression equations)          modeling system (snow model + soil-
                                                                   moisture/runoff model)

 How it works            Several variables that in combination     The watershed above each forecast
                         best explain the historic runoff          point is divided into multiple modeling
                         outcomes at each forecast point are       units based on topography and
                         used as predictors of the current         elevation; within each unit, the current
                         year’s runoff.                            year’s hydrology is simulated up to the
                                                                   forecast date and then projected
                                                                   forward given the initial hydrologic
                                                                   conditions and the range of historical
                                                                   weather.

 How current state of    Current SWE and water-year-to-date        Snowpack is “built up” in the snow
 snowpack is             precipitation at SNOTEL sites are the     model for each modeling unit using
 incorporated into the   typical predictors in the forecast        SNOTEL and COOP observations of
 forecast                equations.                                precipitation and temperature (but not
                                                                   SWE); weather model output is used to
                                                                   distinguish snow from rain.

 How antecedent          Only partially and indirectly. For        Directly. SNOTEL and COOP
 (previous fall) soil    example, anomalously low October          precipitation and temperature are used
 moisture is             and/or November precipitation will        to explicitly model antecedent fall soil
 incorporated in the     nudge the year-to-date precipitation      moisture; anomalous soil conditions
 forecast                predictors down, which will push the      directly affects the modeled runoff
                         forecasted streamflow volumes             efficiency and thus forecasted
                         downward as well.                         streamflows.

 How the effects of      The forecast equations are calibrated     Short term: 5-day forecast of
 future weather (i.e.,   on historical observed SWE,               precipitation and 10-day forecast of
 between the forecast    precipitation, and streamflows for        temperature are used to adjust the
 date and the end of     each year in the 1981-2010 period.        modeled snowpack.
 the spring-summer       These observed streamflows were           Longer term: The 35 historical weather
 runoff period) are      generated, in part, by the spring         sequences from the 1981-2015 period
 incorporated in the     weather sequences during those            are used to separately evolve the
 forecast                years, so the spring weather is           modeled snowpack to the end of the
                         implicitly incorporated in the forecast   forecast period.
                         equations.

Section 5. Applying snowpack data: Seasonal streamflow forecasting                                            20
Snowpack Monitoring in the Rocky Mountain West: A User Guide Section 6. Accessing snowpack data: Data tools and resources This section of the guide provides practical information to help users find and retrieve the snow data they need. Consult the simple matrix (Table 3) below to find the tool or resource that offers the variables of interest. In addition, as may have been evident from the snow product descriptions above, there can be differences among data retrieved from product to product. We recommend that you consult multiple snow products and networks, including SNOTEL, and compare them over time for the watershed(s) of interest. Historical comparisons between snow data and other observed variables such as streamflow may lead you to choose one product over another. Section 6. Accessing snowpack data: Data tools and resources 21
Snowpack Monitoring in the Rocky Mountain West: A User Guide

Table 3. Schematic overview of variables provided by the tools and resources presented in this guide.

                                                  Variable                                        Snow
                                                                                               products /
 Tool or       SWE       Snow-   Snow      Snow       Snow        Air    Precipi-   Precipi-   networks
 resource                fall    depth    density    tempe-    tempe-     tation     tation    displayed
                                                      rature    rature              as snow      in tool

  NRCS         Yes                 Yes      Yes                 Yes        Yes                 SNOTEL
 Interactive                                                                                     Snow
 Map                                                                                            course

 NRCS          Yes                                              Yes        Yes                 SNOTEL
 Snow          (CO, UT                                           (UT     (CO, UT                 Snow
 Survey        only)                                            only)      only)                course
 Interactive
 Charts

 CBRFC         Yes                                                                             SNOTEL
 snow          (CBRFC
 groups        domain
               only)

 NOAA                    Yes       Yes                                                          COOP
 snowfall                                                                                      CoCoRaHS
 and snow
 depth map

 CoCoRaHS        Yes      Yes      Yes                                     Yes                 CoCoRaHS
 maps

 NOAA          Yes                 Yes      Yes        Yes                 Yes        Yes      SNODAS
 SNODAS                                                                                        SNOTEL
 map
                                                                                                COOP
                                                                                               CoCoRaHS

 CWCB          Yes                                                                             SNODAS
 CDSS          (CO
 SNODAS        only)
 tools

 U. Arizona    Yes                                                         Yes                 SWANN
 SnowView                                                                                      SNODAS
 map
                                                                                               SNOTEL

 CBRFC         Yes                                                                             SNOW-17
 modeled
 snowpack
 map

Section 6. Accessing snowpack data: Data tools and resources                                             22
Snowpack Monitoring in the Rocky Mountain West: A User Guide
NRCS Interactive Map
Quick facts
• Provides a clear spatial overview of snowpack (SNOTEL) and other hydroclimate conditions across
the western U.S., while allowing users to easily drill down into site-level data
• Tool Access: https://www.nrcs.usda.gov/wps/portal/wcc/home/quicklinks/imap
• Instructions/Help:
https://www.nrcs.usda.gov/wps/portal/wcc/home/dataAccessHelp/helpCenters/imapHelpCenter/
Data from snow monitoring networks discussed in this user guide displayed by this tool
• SNOTEL data
• Snow course data
The Interactive Map was debuted by NRCS in 2015 and has quickly become the go-to tool for displaying
real-time and historical data from multiple hydroclimate sensor and data networks, most
notably SNOTEL and snow courses.
Section 6. Accessing snowpack data: Data tools and resources 23You can also read