Smart Meters and the Benefits from Electricity Quality Improvements
←
→
Page content transcription
If your browser does not render page correctly, please read the page content below
Smart Meters and the Benefits from Electricity
               Quality Improvements*

                                        Robyn C. Meeks†
                                       Arstan Omuraliev‡
                                         Ruslan Isaev§
                                       Zhenxuan Wang¶
                                           June 14, 2021

                                               Abstract
          With hundreds of millions of households depending on grid connections that pro-
      vide low quality and unreliable electricity services, this poor quality is considered
      a barrier to development. In the Kyrgyz Republic, we investigate the impacts of and
      residential consumer response to electricity quality improvements through a random-
      ized installation of smart meters – a technology that utilities can install to improve
      electricity service quality. Service quality improvements led to increased billed elec-
      tricity consumption during peak months. Residential consumers responded by in-
      creasing expenditures on household appliances and investing in energy efficiency.
      Keywords: electricity, infrastructure, service quality,
      JEL: D01, D62, O13

   * We  thank participants at conferences (Advances in Field Experiments, Sustainable Energy Transitions
Initiative, Pacific Conference for Development Economics, Association of Environmental and Resource
Economists, Energy and Economic Growth Grid Reliability and Utility Operations, and the LSE Envi-
ronmental Economics Workshop) and seminars at Duke, NCSU, ETH-Zurich, and University of British
Columbia for helpful comments. We are grateful for discussions with and comments from Shakeel Ahmed,
Marc Jeuland, Jeremiah Johnson, Matt Johnson, Meera Mahadevan, Leslie Martin, Shaun McRae, Billy Pizer,
and Catherine Wolfram. Jessie Ou and Jiwoo Song provided excellent research assistance. We thank Duke
University, the University of Michigan, and the International Growth Centre for generous financial sup-
port. This randomized controlled trial was registered in the American Economic Association Registry for
randomized controlled trials under trial number #AEARCTR-0000461. All views expressed in the paper
and any errors are our own.
    †
      Sanford School of Public Policy, Duke University. Email: robyn.meeks@duke.edu.
    ‡
      Kyrgyz State Technical University, Renewable Energy Department. Email: oarstan@mail.ru.
    §
      Kyrgyz State Technical University, Renewable Energy Department. Email: karesisaev@rambler.ru
   ¶
      University Program in Environmental Policy, Nicholas School of the Environment and Sanford School
of Public Policy, Duke University. Email: zhenxuan.wang@duke.edu

                                                   1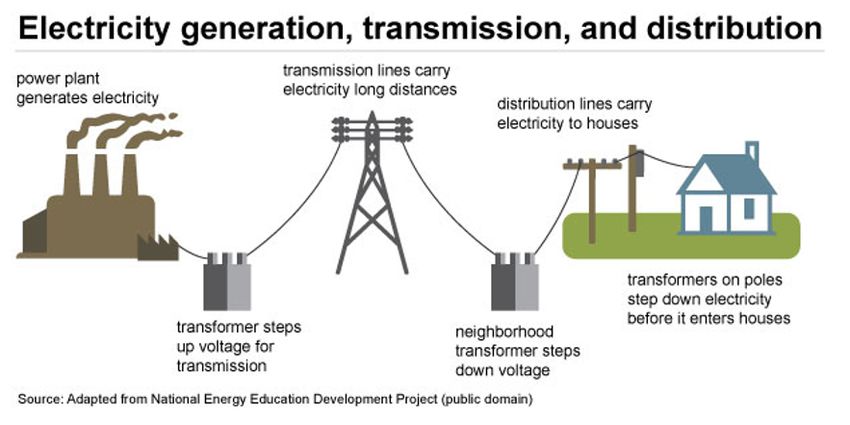
1       Introduction

Poor service quality is documented in a number of public sectors, including education,
health care, and social assistance (Duflo et al., 2012; Dhaliwal and Hanna, 2017; Das et al.,
2016; Callen et al., 2016; Banerjee et al., 2018; Muralidharan et al., 2018). Service quality
is similarly problematic for infrastructure sectors, including those delivering water and
electricity services. Although the number of people with electricity access has increased
during the 21st century, poor electricity service quality remains a persistent problem in
many developing countries (Trimble et al., 2016; Zhang, 2018) with hundreds of millions
of households depending on grid connections that provide low-quality and unreliable
electricity services (Day, 2020). Low-quality and irregular electricity services limit con-
sumption of electricity services (Zhang, 2018) and likely attenuate the economic benefits
from grid connections (Pargal and Ghosh Banerjee, 2014; Samad and Zhang, 2016; Tim-
ilsina et al., 2018).
        With low returns to electrification found in some contexts (Lee et al., 2020b; Burlig
and Preonas, 2016), but not others (Dinkelman, 2011; Lipscomb et al., 2013; Rud, 2012; Van
de Walle et al., 2013; Usmani and Fetter, 2019), differences in electricity service quality
provide a potential explanation for electrification’s heterogeneous impacts across settings
(Lee et al., 2020a). With this in mind, development organizations and governments in-
creasingly emphasize not only expanding the number of electricity connections, but also
improving electricity service quality for existing connections.1 Although recent evidence
suggests substantial willingness-to-pay for improved electricity service quality (Alberini
et al., 2020; Deutschmann et al., 2021), little causal evidence exists on the benefits from –
and consumer response to – electricity quality improvements.
        This paper reports results from a randomized installation of smart meters in the Kyr-
gyz Republic, a lower-middle-income country in Central Asia. Utilities increasingly in-
    1
   For example, Sustainable Development Goal 7.1 of the United Nations calls for “affordable, reliable and
modern energy services” (United Nations, 2020).

                                                    1
stall smart meters to address electricity sector challenges,2 and many entities argue that
smart meters can improve service quality and grid reliability.3 Although these returns
to smart meters could be substantial, their installation can be controversial (e.g., Smith
(2009)). In this paper, we first document the electricity service quality improvement that
followed the smart meter installation and then estimate consumers’ responses to these
electricity quality improvements through their billed electricity consumption, household
expenditures, and energy efficiency investments.4
Smart meters themselves cannot directly improve electricity service quality; how-
ever, through high-frequency energy readings (i.e., readings occur often), they can fa-
cilitate improvements. The smart meters provide two-way communication between the
meter and the utility, providing information on outages and other service quality prob-
lems (e.g., voltage fluctuations) within the distribution system. Alarms from the meters
alert the utility to problems, allowing for faster, more targeted responses to the necessary
locations. Additionally, smart meters automatically disconnect houses from the electric-
ity supply when the voltage spikes or drops, both protecting consumers’ appliances from
damage and providing consumers with evidence of substandard service quality.
Contracting between an electricity utility and its customers should mitigate poor ser-
vice quality; however, this often breaks down in practice, likely because of insufficient
information to enforce these contracts on both sides. Typically, the connection of a house
(or business) to the electrical grid involves a contract; the distribution company commits
to providing reliable electricity services that meet voltage standards, and the customer
2
China leads smart meter installations, with 469 million units installed as of 2017 (Largue, 2018). The
86 million smart meters installed in the United States covered roughly half of the country’s electricity cus-
tomers in 2018 (U.S. Energy Information Administration, 2019b). More recently, additional countries have
announced smart meter plans; for example, India plans to install 250 million meters (Singh, 2020).
3
For examples, see industry news (e.g., Sprinz (2018)), North American electricity utility websites (e.g.,
Duke Energy Progress (2020) and BC Hydro (2016)), United States Government investment assessments
(U.S. Department of Energy, 2014), and multi-lateral development bank reports (ESMAP, 2019).
4
This focus on smart meters to improve electricity quality differs from prior economics research that has
used smart meters primarily as a vehicle for other interventions, such as facilitating time-varying electricity
prices or providing households with real-time information on their electricity consumption through in-
home displays. For examples, see Wolak (2011), Jessoe and Rapson (2014), and Ito et al. (2018). In our study
setting, there are no in-home displays to provide information on prices, etc.
2commits to paying for the electricity consumed. Yet consumers lack data on the actual
quality of electricity services delivered and utilities lack information on the locations of
poorest service quality. The information smart meters provide could alleviate a contract
failure between electricity utilities and their customers.
The randomized experiment was designed to overcome endogenous electricity qual-
ity that is often mutually determined by local neighborhood characteristics. In collab-
oration with an electricity utility, 20 neighborhoods were selected within one city. Each
neighborhood receives electricity services via a transformer.5 These transformers, and the
approximately 1,600 households that they serve, were randomly assigned to treatment or
control status. In summer 2018, smart meters were installed at all 798 houses in the treat-
ment group. These replaced the houses’ old meters, which did not provide two-way
communication with the utility, high-frequency energy readings, or alerts of poor service
quality events, nor did the old meters automatically shutoff connections when voltage
spikes and drops occur. The control houses, 846 in total, retained their old meters. Elec-
tricity prices remained the same across both groups during the study period.
A unique combination of datasets permit us to overcome typical challenges in re-
searching electricity service quality. Limited data and utilities’ lack of incentive to report
on electricity quality measures makes measuring changes in outages and voltage fluctu-
ations difficult (Carranza and Meeks, forthcoming). As a result, most prior economics
research on electricity quality has employed electricity shortages as a proxy for service
quality. In this paper, we measure electricity service quality using data obtained at fre-
quent intervals from additional smart meters installed at all transformers in the study
area. These data provide objective outcome measures for both the treatment and con-
trol groups that are separate and distinct from the house-level intervention. In addition,
baseline and follow-up surveys provide self-reported measures of households’ experi-
enced electricity service quality, as well as data on household expenditures, appliances,
5
Transformers are a crucial component of the electrical grid, converting high-voltage electricity to us-
able, low-voltage electricity for household consumption (Glover et al., 2011).
3and energy efficiency investments. These datasets are complemented by utility data on
household billed electricity consumption over time, as well as details on the electricity
distribution system’s characteristics.
Results confirm that the smart meters led to improvements in service quality. We find
that incidences of voltage fluctuations (spikes and drops) were significantly less frequent
among the treated group, relative to the control, post-intervention. This effect persisted
into the second year following the smart meter installation.
Building upon this, our analyses provide evidence on the consumer response to the
smart meters and the electricity quality improvements that followed. First, we find that
treated houses’ monthly billed electricity consumption increased during months of peak
demand (November to March) and decreased during off-peak months (April to October).
The increase in peak months is consistent with unmet demand prior to the intervention
and improved electricity service quality and greater consumption thereafter. Prior to the
intervention, electricity service quality was most problematic during these peak demand
months, when outages and voltage fluctuations occurred frequently. As a result, these
months are the time when quality improvements could occur. Post-intervention during
peak demand months, households consume a greater quantity of electricity services due
to electricity being available for more hours per day within the standard voltage range. In
our setting, smoothing electricity consumption during the winter is important for house-
hold safety and health, as the peak demand is driven by electric heating.
We investigate potential explanations for these effects on billed electricity consump-
tion. The increase during peak months could result from greater use of existing appliances
(due to the additional hours of quality services sufficient to power those appliances) or
investments in new appliances (i.e., more appliances purchased and used). We find ev-
idence of the latter: treated households’ quarterly expenditures on home appliances in-
creased by 14 USD. We cannot, however, rule out the former explanation.
The impacts on off-peak billed electricity consumption likely occur through a differ-
4ent channel than the on-peak impacts, given service quality was not problematic during
these months. Instead, the decrease in off-peak billed electricity consumption could re-
sult from increased investment in energy efficiency or energy saving behaviors, more
broadly. Having experienced increased billed electricity consumption in the first months
post-intervention, treated households may have invested in energy efficiency and house-
hold improvements. We find evidence that treated households were more likely to invest
in upgrading their windows - a weatherization improvement that increases a building’s
retention of heat in the winter and cool air in the summer. This impact on house weath-
erization, in conjunction with the common residential use of electric heating, implies that
the increase in on-peak billed electricity consumption would have been even larger in the
absence of these energy efficiency gains. Without meters on individual appliances, we
cannot rule out electricity-saving behavioral changes that might have occurred in addi-
tion to these energy efficiency investments.
To conclude, we assess consumer returns to the electricity quality improvements dur-
ing peak months. We estimate that these returns are approximately 28 USD per house
per year, which is between one-half to one-third the cost of a smart meter. This finding,
in addition to the positive impacts on household appliance investments, is indicative of
consumer benefits from these electricity service quality improvements.
Broadly, this paper contributes to experimental research on methods to – and im-
pacts of – improving delivery of public services (Duflo et al., 2012; Dhaliwal and Hanna,
2017; Das et al., 2016; Callen et al., 2016; Banerjee et al., 2018; Muralidharan et al., 2018).
More specifically, we contribute to literature on the role of service quality in electrifica-
tion and development. Providing evidence of consumer gains – with respect to increased
electricity consumption and appliance investments – following electricity service quality
improvements, adds important insights to the existing research on the economic impacts
of electrification in developing countries (Dinkelman, 2011; Lipscomb et al., 2013; Rud,
2012; Van de Walle et al., 2013; Usmani and Fetter, 2019; Lee et al., 2020b; Burlig and Pre-
5onas, 2016; Meeks et al., 2021). Further, by focusing on residential consumers, this paper
complements existing research estimating the economic impacts of electricity shortages
(Fisher-Vanden et al., 2015; Allcott et al., 2016; Cole et al., 2018; Hardy and Mccasland,
2019) and reliability (Mahadevan, 2021) on firms.
Understanding residential consumers’ responses to changes in electricity quality is
important for development planning. Pro-poor growth in developing countries is ex-
pected to result in greater household appliance ownership and increased residential elec-
tricity demand (Wolfram et al., 2012). Residential electricity consumers, however, may
not adapt to low service quality through the same mechanisms as firms, such as self-
generation (Steinbuks and Foster, 2010), and their appliance ownership and use and de-
mand for electricity services likely depend on the quality of services delivered (McRae,
2010). Yet, little empirical evidence exists on such responses.
The paper proceeds as follows. Section 2 explains electricity quality and demand for
electricity services, as well as the role of smart meters. Section 3 details the study set-
ting and the experimental design. Section 4 describes data sources and presents baseline
checks. Section 5 presents the estimated impacts of smart meters on electricity service
quality and the consumer response. Section 6 presents calculations on the returns to the
electricity service quality improvements. Section 7 concludes.
2 Electricity Quality, Demand, and Smart Meters
In this section, we first describe types of poor electricity quality and discuss the potential
role of smart meters in service quality improvements. We then illustrate how consumers
may benefit from and respond to electricity quality improvements through a conceptual
framework.
62.1 Forms of Poor Electricity Service Quality
There are mainly two types of poor electricity service to consider: unreliable service due
to outages and low service quality due to voltage fluctuations.
Unreliable Service Due to Outages. An outage is a complete stoppage within the
distribution system that prevents the delivery of electricity. Outages can be planned or
unplanned. Planned outages are either for regular repairs and maintenance, which are
typically of limited duration and scheduled for off-peak months, or for electricity ra-
tioning.6 Unplanned outages are typically due to infrastructure breakage, malfunction,
and overloads.7 These unplanned outages can be lengthy in duration, lasting until re-
placement parts are purchased and repairs are completed. Absent back-up generation,
electrical appliances cannot be powered during a grid outage.
Low Service Quality Due to Voltage Fluctuations. Voltage fluctuations – a spike
above or a drop below the standard acceptable voltage range – result from a number
of reasons, including faulty and old distribution infrastructure, insufficient maintenance
and repairs, or demand that exceeds the infrastructure’s capacity.
2.2 Smart Meters and Electricity Service Quality Improvements
Smart meters can improve electricity service quality by providing additional information
to either consumers or the utility. First, smart meters can detect and directly alert the
utility to outages and voltage fluctuations. If the utility monitors this information, it can
respond quickly with repairs, maintenance, and overhauls. Second, smart meters can de-
tect voltage fluctuations and automatically disconnect from the distribution system, pro-
tecting appliances from damage. If standard voltage resumes, the consumer must press
a button on the smart meter to restart electricity flow. This required extra step increases
6
Rationing, which is commonly referred to as “load shedding,” did not occur during our study period
and therefore not further discussed in this section.
7
For example, transformers can overload. Each transformer can transfer a certain maximum electricity
load at any given time, and exceeding that load may cause breakage (Glover et al., 2011).
7the salience of voltage fluctuations for consumers and provides evidence of unsafe volt-
age fluctuations. With this information, consumers may argue for better maintenance,
upgrades, and repair. Without it, their complaints of voltage problems are typically un-
verified. If standard voltage does not resume, the smart meter prevents electricity flow
until the utility performs the necessary repairs. Thus, the meters help the utility target
efforts to the neediest locations within the distribution system, thereby potentially im-
proving electricity service quality.
2.3 Conceptual Framework: Electricity Service Quality and Demand
In this subsection, we provide a conceptual framework as to how electricity quality changes
affect demand for electricity services, including the role of smart meters. This frame-
work is informed by existing literature (see e.g., Klytchnikova and Lokshin (2009), McRae
(2010), and McRae (2015b).) A household’s demand for electricity services is determined
by the demand for services from each of the household’s electrical devices. Changes in
electricity service quality will also impact the demand for services from individual elec-
trical devices. This is particularly problematic for development, given service quality is
typically worst during times of peak demand, when electricity generation and distribu-
tion systems are insufficient to meet the quantity of electricity services demanded.
Both outages and voltage fluctuations can affect the appliances owned, the extent to
which the appliances are used, and the quantity of electricity services consumed. Each
of these service quality problems result in demand for electricity services that is not fully
satiated, thereby negatively affecting billed electricity consumption.
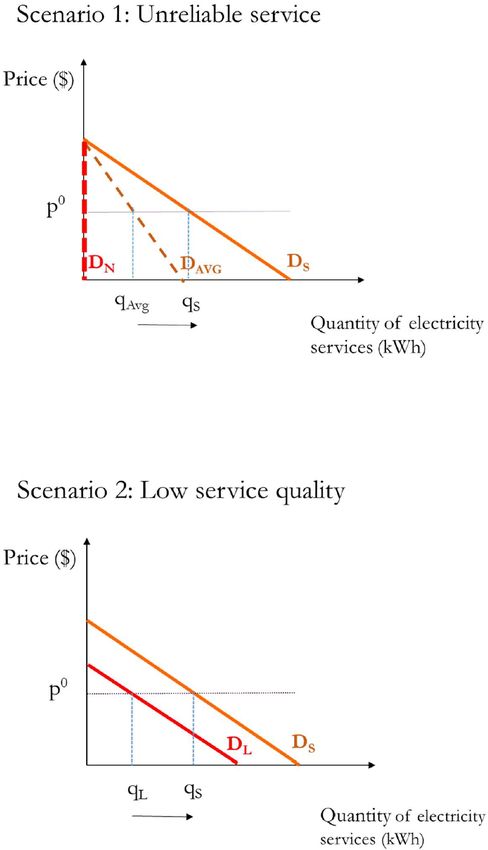
Unreliable Service Due to Outages. We depict the relationship between an outage
and the quantity of electricity services demanded in Scenario 1 of Figure 1. We first illus-
trate the quantity of electricity services demanded under standard (full) service quality
(i.e., no outages and no voltage fluctuations). In this graph, the electricity service de-
mand curve under standard (full) electricity service is depicted as DS . Assuming a linear
8electricity price, p0 , the quantity of electricity services demanded will be qS .8
Poor service quality can result in a quantity of electricity services consumed that
is less than qS . The demand curve during an outage, when no electricity is distributed
and therefore no electricity services are consumed, is represented by DN . However, when
standard (full) electricity service (i.e., with no outage) resumes, the demand curve returns
to DS . As a result, if the billing cycle (e.g., one month) includes both periods of standard
(full) supply, as well as periods of outages, the electricity bill will represent an average of
the two. This quantity demanded, as observed on the electricity bill, is depicted as qAvg
in the figure. The extent to which qAvg is less than qS will depend on the frequency and
duration of outages during the billing period (Klytchnikova and Lokshin, 2009) and the
consumer response to those outages.
Consumers may have various responses to outages. They may opt to not purchase
a certain appliance, particularly expensive appliances (e.g., an electric cooker). If this
occurs, then the quantity of electricity services consumed will be lower than qS . Alterna-
tively, the consumer may not plug in an appliance already owned to consume its services
if the appliance may be damaged by an outage.
If service quality improves after smart meter installation, then consumption of elec-
tricity services should increase due to greater consumption of the services provided by
electrical devices in the home. If smart meters can reduce outages, then we may observe
a shift in the quantity consumed, as observed on the electricity bill, from qAvg to qS . This
potential shift is illustrated by the arrow in Scenario 1.
It is possible that consumer behavioral responses to changes in electricity quality
and their electricity bills may push consumers away from qS following the smart me-
ter intervention. First, if consumers respond to the electricity quality improvements by
purchasing additional electrical devices, then electricity consumption increases could be
even greater than qS . Alternatively, if consumers experience a higher electricity bill (than
8
This is a simplification. In many contexts, including our study setting, consumers face a non-linear
tariff. The overall intuition, however, remains the same.
9expected or than previously experienced), then they may respond by replacing devices
with more efficient models, investing in other forms of energy efficiency such as weath-
erization, or changing behaviors. In such scenarios, and depending on the magnitude of
the energy-saving behaviors relative to the electricity service consumption increases due
to quality improvements, the electricity bills may actually decline.
Low Service Quality Due to Voltage Fluctuations. Voltage fluctuations can affect
the quantity of electricity services demanded via multiple channels, some of which oc-
cur through the same mechanisms as outages. First, low voltage can mean that power
is insufficient to run certain appliances, in which case the service provided by that ap-
pliance cannot be consumed. Second, voltage spikes may damage appliances, rendering
them unusable. Consumers may be particularly concerned about potential damage to
expensive appliances (e.g., a refrigerator), and hence fewer appliances may be used or
purchased within a household. For example, a household may not purchase a refriger-
ator if they think voltage fluctuations can damage it or render it unusable.9 Finally, as
with outages, if electricity service quality impacts households’ ability to consume an ap-
pliance’s services, then it will also impact their purchase decisions and the portfolio of
appliances owned. These channels all result in a lower quantity of electricity services
consumed than under a standard voltage scenario.
There is at least one mechanism through which voltage fluctuations may impact elec-
tricity service consumption differently than in the outage scenario. Some appliances may
function at lower voltages, while providing lower service quality (while using less elec-
tricity). For example, a light bulb may provide lighting services when voltage is low, but
the lighting is less bright than it would be with standard voltage. When certain appli-
ances run at low voltage, they consume fewer kWh per minute of use. We illustrate these
forms of low-quality electricity service in Scenario 2 of Figure 1. The demand curve dur-
ing periods of low-quality service, when electricity services may be consumed but at a
9
A household could purchase equipment, such as a stabilizer, to protect the appliance should voltage
fluctuate; however, we do not see much evidence of this occurring in our data within the study setting.
10lower quantity than standard (full) supply, is represented by DL . As shown in the figure,
the quantity of electricity services consumed when there are voltage fluctuations, qL , will
be less than the quantity consumed under standard quality, qS .
If smart meters can reduce voltage fluctuations, then we may observe a shift in the
quantity consumed, as observed on the electricity bill, from qL to qS . This potential shift
is illustrated by the arrow in Scenario 2.
3 Randomized Experiment with Smart Meters
With a history of poor quality electricity services and recent efforts to improve services
with smart meter installations, the Kyrgyz Republic provides a suitable setting for a ran-
domized experiment to test the consumer response to electricity quality improvements.
In this section, we provide background on the country’s electricity sector and informa-
tion on the drivers of electricity consumption within the country. We then explain the
randomized experiment.
3.1 Electricity Sector in the Kyrgyz Republic
Nearly 100% of Kyrgyzstan’s population is connected to the electrical grid, the result
of large-scale infrastructure construction during the former Soviet Union. Much of the
existing electricity infrastructure dates back to that time (Zozulinsky, 2007).
After 1992, the country’s electricity sector was restructured. Kyrgyzenergo, the state-
owned power company, was incorporated as a joint stock company, with the Kyrgyz gov-
ernment owning approximately 95% of the shares. By 2000 the sector was unbundled by
functionality – generation, transmission, and distribution – resulting in one national gen-
eration company, one national transmission company, and four distribution companies
(World Bank, 2017a). The distribution companies cover distinct territories, purchasing
electricity from the national transmission company and delivering it to residential, com-
11mercial, and industrial consumers.
Government regulations dictate the relationship between the distribution companies
and the electricity customers. Per the government’s Decree 576 (”Regulations on the Use
of Electric Energy”), when a new customer connects to the electrical grid, the consumer
and the distribution company (“the supplier”) sign a contract with requirements regard-
ing service quality and payment. The supplier commits to deliver reliable electricity ser-
vice at a consistent voltage (220/280 volts). The supplier installs and retains ownership
of a meter at the customer’s location to track consumption. Consumers can record devi-
ations from the electricity quality standards and any resulting material damages. After
reporting to the government oversight body, the consumer may recover from the supplier
damages that result from a service interruption or voltage fluctuation. The consumer
commits to pay for the electricity services consumed – as calculated based on monthly
meter readings – by a specified date. If payment is not made, the supplier can charge a
daily penalty and eventually disconnect the consumer from the power supply.
In recent decades, unreliable and low-quality electricity services have been perva-
sive, caused by the poor condition of the energy sector assets, intensive electricity use,
and large seasonal variations in demand. Between 2009 and 2012, distribution companies
reported an average of two outages per hour within their coverage areas (World Bank,
2017b). When electricity is delivered, voltage fluctuations are frequent. In a 2013 survey,
more than 50% of survey respondents reported voltage problems, and approximately one-
fifth of survey respondents reported damage to electrical appliances from poor electricity
quality (World Bank, 2017a).
Electricity consumption has been changing since the country’s independence in 1991.
The percentage of total electricity consumption comprised by the residential sector steadily
increased, reaching 63% by 2012 (Obozov et al., 2013). These changes are consistent
with increasing appliance ownership. Low electricity prices have also contributed to the
12growth in residential electricity consumption.10 Currently, consumption in the winter is
approximately three to four times that of summer, a pattern that is indicative of the use
of electric heating in the winter and the absence of air conditioning in the summer.
3.2 Randomized Experiment
In collaboration with one of the electricity distribution companies, the experiment was
implemented in one city in the Kyrgyz Republic. Prior to the experiment, a substantial
number of smart meters had been installed in other cities within the country, but not in
this particular city.
The randomized design focused on the last two steps in the electricity distribution
system: neighborhood transformers and residential electricity consumers (illustrated in
Appendix Figure A1).11 Twenty transformers, which each serve a neighborhood of house-
holds, were selected for the project. A map of the 20 transformers shows that they are
all located within a two-square-mile area (Appendix Figure A2). Transformers were
randomly assigned to treatment or control status, with 10 transformers in each group.
Houses served by the transformers in the treatment group (798 houses) received smart
meters, and houses served by the control group of transformers (846 houses) retained
their old meters (Appendix Figure A3). The utility replaced the old meters with smart
meters at all houses in the treatment group in July and August 2018.
The study’s residential electricity consumers reside in either multistory apartment
buildings or single-family dwellings. Eighty percent of these dwellings are owner occu-
pied. The average house in the sample has three rooms. Houses are typically individu-
ally metered. Sixty-five percent of households use electricity for winter heating. Houses
10
Residential consumers face a two-tiered increasing block price with a non-linearity in the price at 700
kWh per month. Below the cutoff, consumers pay 0.77 Kyrgyz soms (KGS) per kWh. Above the cutoff,
consumers pay 2.16 KGS per kWh. The exchange rate was 69 KGS = 1 USD as of September 1, 2018.
Residential consumers rarely exceed the threshold between the first and second tiers in the warm summer
months.
11
Residential consumers were identified as those consumers being charged the residential tariff rate.
13had only modest investments in energy efficiency at the outset, with 20% and 21% of
households using energy-efficient light bulbs and insulation, respectively. Households
did report electricity quality issues, with 47% reporting one or more outage per week and
71% reporting one or more voltage fluctuation per week during winter 2018 (prior to the
intervention). Twenty-one percent of households reported prior appliance damage due
to the poor electricity quality; however, almost no households had equipment to protect
against poor electricity quality, such as electricity generators or stabilizers.
4 Data and Baseline Checks
We employ data from several sources, including baseline and follow-up survey data, util-
ity transformer and billing records, and data from smart meters installed at transformers.
4.1 Primary and Secondary Data Sources
The analyses employ primary and secondary data, which vary in the timing of their cov-
erage relative to the smart meter intervention (as depicted by Appendix Figure A4).
4.1.1 Transformer Smart Meter Data
During summer 2018, smart meters were installed at all 20 project transformers, both
treatment and control. These transformer-level smart meters are independent and distinct
from the intervention smart meters installed at houses and are for data collection pur-
poses. These smart meters record “event alarms” indicating problematic events within
the neighborhood covered by the transformer. Alarms can be activated for a number of
reasons, including signs of electricity theft and indicators of poor service quality.12
12
For example, alarms are activated if power is detected going from a distribution line to a consumer
without a formal connection (an indication that someone is bypassing the meter), if an over-voltage event
(a voltage spike above the standard range) is detected, or if a power failure (outage) is detected.
14We create transformer-level variables measuring the incidence of alarms indicating
certain types of problems (i.e., theft, poor quality, and outages). Our categorization of
alarm types is based on documentation provided by the meter manufacturer. We also
create a variable comprising “other” alarms to capture those events that are not indicative
of our main outcomes and that we do not anticipate to be impacted by the intervention.
The incidence of alarms in our data varies greatly by event type (Appendix Table A1).
Of the transformer alarms recorded after the intervention, approximately 60% indicated
electricity voltage problems, 22% indicated power outages, 6% indicated theft, and the
remaining 12% were in the “other” category. The high number of voltage-related alarm
events underscores the extent to which electricity quality is a problem.
Transformer-level smart meter data are critical for the study. They provide high-
frequency objective indicators of electricity theft and electricity quality for both the treat-
ment and control groups, regardless of individual household meter status. Transformer
smart meters were installed approximately two months before the intervention smart me-
ters were installed at houses and therefore do not provide much pre-intervention data.
4.1.2 Baseline and Follow-up Survey Data
Baseline and follow-up survey data were collected in July 2018 and May 2019, respec-
tively. In each survey round, we sought to survey all 1,644 households within the treat-
ment and control groups. Survey respondents totaled 1,143 for the baseline survey and
1,125 for the follow-up survey. When we include only the households that responded to
both survey rounds the panel dataset includes 880 households.
The baseline survey was brief, designed to limit interaction with households. The
follow-up survey was more extensive, resulting in greater breadth of variables available
for the period after the smart meter installation. Both surveys asked questions on char-
acteristics of the home, quality of electricity services, the set of home appliances owned,
and overall household expenditures, among others. Importantly, both survey rounds col-
15lected data on perceived electricity quality during the previous January and February,
providing panel data on household perceptions of outages and voltage fluctuations.
4.1.3 Utility Data
The electricity utility provided several datasets: first, transformer-level data including
cross-sectional information on transformer characteristics (age of transformer, capacity,
etc.) as well as monthly panel data starting in January 2017 and continuing for 33 months,
including dates of overhaul maintenance, repairs, and replacements for all project trans-
formers; second, household-level monthly billed electricity consumption data from Jan-
uary 2017 through March 2020. These billed consumption data cover periods of approxi-
mately 18 months before and after the intervention. The period of analysis ends in March
2020 due to COVID-19.
4.2 Non-Compliance and Attrition
Non-compliance is not an issue in this study. Treatment assignment was at the trans-
former level, and all houses within the treatment group had smart meters installed by the
utility. By law, all electrical connections are required to be metered, the meters – whether
smart meters or the old meters – are legally owned by the electricity distribution com-
pany, and consumer consent is not required for meter changes.
We check the response rates for the treatment and control groups in the baseline
and follow-up surveys and find no differential attrition across groups. Attrition rates
between the baseline and follow-up surveys are 24.3% and 21.7% in the treatment and
control groups, respectively (Appendix Table A2).
164.3 Baseline Balance Tests
We test for baseline balance between treatment and control groups using transformer-
level utility data, household monthly billed electricity consumption data, and baseline
survey data.
Table 1 compares the control and treatment groups on characteristics important to
electricity quality. Panel A compares treatment and control transformers across various
characteristics. The transformers are similar with respect to the average number of houses
served (84.6 versus 79.6 households), their average capacity (an average of 381 versus 406
kVA), and their age (33.4 versus 27.9 years). Differences between treatment and control
transformers are not statistically significant. The age of the transformers is reflective of
the country’s overall aging infrastructure. Panel B compares the treatment and control
households at baseline. There are no statistically significant differences in households’
reported electricity quality, house size, use of insulation and energy-efficient light bulbs,
heating fuel used, and the use of technologies to protect against poor electricity quality
(e.g., generators and stabilizers). Additionally, no significant baseline differences exist be-
tween the treatment and control households for 12 categories of household expenditures,
including electricity and household appliances (Appendix Table A3). These comparisons
are limited to the 880 households in the balanced panel; however, similar comparisons for
the full 1,143 households surveyed at baseline provide similar results (Appendix Table A4
and Appendix Table A5).
Finally, we also test for balance across treatment and control houses using monthly
household billed electricity consumption data. Figure 2 graphs pre-treatment billed elec-
tricity consumption. The top panel plots the month-by-month differences between aver-
age electricity bills in the treatment and control groups, without controlling for any other
variables. The graph shows no significant differences in monthly electricity bills before
the intervention. Treatment households have slightly lower average electricity bills in July
2018, which is likely the result of outages required to install the intervention smart me-
17ters at these houses. The bottom panel plots the month-by-month average electricity bills
for the treatment and control households. Both groups have similar seasonal consump-
tion patterns; the average monthly electricity consumption in the winter is approximately
three times that in the summer, which is indicative of households using electric heating
during winter, but not air conditioning in the summer.
5 Effects on Electricity Quality and Consumer Response
In this section, we first confirm that the smart meter installation had the intended effect of
improving electricity service quality. We then present estimates of the consumer response
to smart meters and the electricity quality improvements, including billed electricity con-
sumption, household expenditures, and energy efficiency investments.
5.1 Confirming the Effects on Electricity Quality
To estimate the intervention’s effect on indicators of electricity quality, we employ the
data on event alarms from the transformer-level smart meters during the post-intervention
period. The two outcome measures are the number of transformer-level events per day
indicating either voltage fluctuations or power outages. We estimate the following equa-
tion:
Egt = αTreatg + βTreatg × Post2t + δ 0 Xg + γt + gt , (1)
where Egt is the number of either voltage fluctuations or outage events recorded by the
transformer smart meter per day for transformer g in time period t. Treatg is an indicator
of transformer treatment status equaling 1 for those randomly assigned to the treatment
status. Post2 is a binary indicator that equals 0 in the first year after the intervention and
1 in the second, Xg is a vector of transformer characteristics that could affect electricity
service quality (i.e., the number of households served by the transformer and the trans-
former’s technical capacity), and γt are month-by-year fixed effects. Standard errors are
18clustered at the transformer level.13
Results are presented in Table 2. Columns 1 and 2 present results from regressions
in which voltage fluctuation events are the outcome variable. We find significantly fewer
voltage fluctuation events per day in the treatment group than in the control group during
the first year after the intervention (Column 1). Comparing the coefficient on Treatg with
the control group mean – our estimate of the counterfactual – we see that these alarms
are essentially eliminated within the treatment group. The coefficient on the interaction
term, β, shows that this difference between the treatment and control groups persists into
the second year. To account for any differences in electricity quality that might be driven
by feeder line differences, we additionally include feeder line fixed effects in a second
specification. Column 2 shows that the results are robust to their inclusion. Columns
3 and 4 display results from regressions in which power outage events are the outcome.
Notably, the control group mean of 0.518 outage events per day is much less frequent than
the voltage event mean. Column 3 shows a small and marginally significant increase in
these events in the first year after the intervention. This positive coefficient could be due
to outages from the increased transformer repairs. The coefficient on the interaction term
indicates a change in the direction of the effect in the second year. These results, however,
provide no evidence of a significant negative effect on power outage events relative to the
control (as we saw with the voltage events). Lastly, as a robustness check, we run these
regressions again, this time using the “other” events as the outcome measure. This is the
category of alarms for which we anticipated no impacts, ex ante. The results in Columns
5 and 6 indeed show no significant differences between the treatment and control groups.
Transformer repairs and replacements appear to be the channel through which elec-
tricity service quality improved. Appendix A2 presents evidence on the mechanisms for
electricity quality improvements, showing that the treated transformers were more likely
to be overhauled or replaced (Appendix Table A12) and the event alarms from the house-
13
Given the limited number of clusters, we report the wild-bootstrap p-values with main results.
19hold smart meters directed utility attention to the transformers in greatest need of repairs
(Appendix Table A13). Those transformer repairs result in improved electricity service
quality, as measured by both event alarms (Appendix Table A14) and consumers’ per-
ceived quality improvements (Appendix Table A15).
To check that the voltage fluctuation and outage events are indeed picking up varia-
tions in the electricity quality experienced by the households, we perform two additional
robustness checks. First, we test the correlation between the transformer-level smart me-
ter voltage fluctuation and outage events and the household reported electricity quality
measures, which were collected via the follow-up survey implemented at approximately
the same time. We find that transformer smart meter events indicating electricity qual-
ity problems are indeed negatively and significantly correlated with better household-
reported electricity reliability (Appendix Table A6), showing that households’ perceived
electricity quality and the transformer-level electricity quality measures are aligned. As
expected, theft events are not correlated with households’ reported electricity quality.
Our second robustness check tests the correlation between the transformer smart
meter events (our outcome measures in Table 2) and events captured by the household
smart meters. This can be done for only the treated households, where the intervention
smart meters are installed. These two measures should not be perfectly correlated, for
multiple reasons. First, household meters do not pick up exactly the same things as the
transformer smart meters. Second, heterogeneity in electricity quality across households
within a transformer’s service area is expected. For example, households located closer
to or farther from the transformer might experience voltage fluctuations differently. Al-
ternatively, an outage may impact one house served by a transformer or all the houses
within that neighborhood. These two levels of smart meter alarms, however, should be
positively correlated, and they are (Appendix Table A7).
205.2 Consumer Responses to Electricity Quality Changes
As detailed in Section 2, the smart meters and the resulting electricity quality improve-
ments could impact billed electricity consumption in multiple ways. These effects play a
role determining the extent to which consumers benefit from smart meter installation.
5.2.1 Billed Electricity Consumption
To motivate further analysis, we first present an event study analysis that illustrates the
impacts on monthly billed electricity consumption across seasons and over time. Fig-
ure 3 shows a statistically significantly higher billed electricity consumption in treatment
households, relative to control households, during the post-intervention peak months.
Building upon the event study, we estimate the impact of smart meters on household
billed electricity consumption as follows:
Billigt = β1 Treatg × Post1t + β2 Treatg × Post2t + λi + δt + igt , (2)
where Billigt is the monthly billed electricity consumption by household i in transformer
g in month t. Treatg is the indicator of transformer treatment status, equaling 1 if the
household is treated with a smart meter and 0 otherwise. The binary variables, Post1t
and Post2t , are indicators equaling 1 for months within the first and second years after the
intervention, respectively. This allows the estimated effects to change over time. We run
the regressions separately for the heating (November to March) and non-heating (April to
October) seasons, given the heterogeneity in both consumption and service quality across
seasons. November to March is the period of peak electricity consumption and also the
time when electricity quality problems are worst.
The results are presented in Table 3. We find that household billed consumption
significantly increased during the heating season in the first year after the intervention,
but this increase does not persist into the second year (Column 1). The increase in year
211 is consistent with better service quality (i.e., fewer voltage fluctuations), as we found
in Section 5.1. That the increase does not remain of a similar magnitude or statistically
significant into the second year, suggests that households adapt to the improved service
quality either behaviorally (e.g., reducing their use of appliances or increasing the amount
of electricity stolen) or technologically (e.g., increasing the efficiency of their appliances
or homes). We investigate these household adaptations further in the subsections that
follow. The billed electricity consumption in the non-heating season decreases (Column
2). This is also consistent with these same adaptations following the smart meter instal-
lation, suggesting that the household adaptations affect billed electricity consumption
across seasons.
One potential concern is that households with different consumption patterns pre-
intervention (e.g., during the heating or non-heating season) will respond differently to
the installation of smart meters. As a robustness check addressing this concern, we re-
run the regressions controlling for monthly billed electricity consumption in 2017 (well
before the smart meter installation). The corresponding results are robust to including
these controls (Appendix Table A8).
5.2.2 Household Expenditures
Thus far, we have shown that electricity quality improves after the intervention and that
household billed electricity consumption data indicates that household response changes
over time.
To better understand households’ responses to the improvements in electricity qual-
ity, in terms of technological adaptations and expenditures, we utilize household survey
data.14 Both the baseline and follow-up surveys asked about expenditures for the pre-
vious months, providing a panel dataset of these variables. The follow-up survey was
implemented in May 2019. The survey timing is important for understanding household
14
Without devices monitoring consumption by each individual appliance, we are unable to test specific
behavioral adaptations.
22changes; these follow-up data were collected after the households experienced the first
post-installation peak (winter heating) season, but before the second.
We estimate the impact of treatment on household expenditures as follows:
Expenditureigt = β1 Treatg × Postt + β2 Postt + λi + igt , (3)
where Expenditureigt is household expenditure (KGS) on categories of goods and ser-
vices. The indicator variables, Treatg and Postt , as well as household fixed effects, are
defined as before. Standard errors are clustered at the transformer level.
Table 4 presents the corresponding results. We document a statistically significant
increase in household electrical appliance expenditures of 13.58 USD over a three-month
period (Column 11). This is consistent with households investing in more electrical appli-
ances in response to the electricity quality improvements. None of the other expenditure
categories change significantly between baseline and follow-up.
5.2.3 Energy Efficiency Investments
These increased electrical appliance expenditures could indicate either additional benefits
in the form of new services, increased efficiency in services previously consumed, or both.
After witnessing their electricity bills increase during the first heating season, treated
households could increase the efficiency of their homes. With this possibility in mind, we
asked follow-up survey respondents if they made any energy efficiency improvements to
their house since the end of 2018 (i.e., the time of the meter installation).
We estimate the impacts of the smart meter intervention on households’ investments
in energy efficiency. Results are presented in Table 5. Treated households were more likely
to report making energy efficiency improvements since the intervention. Specifically,
treated households are significantly more likely to report having replaced the windows
on their homes. Window replacement – an energy-efficiency investment promoted for
23these old homes – would explain why the peak billed electricity consumption increases
do not persist into the second year.
We also test for patterns in specific appliance purchases and whether the treated
households made smaller-scale improvements to increase their energy efficiency, specifi-
cally energy-efficient light bulbs; however, due to our limited panel dataset, these analy-
ses are likely under-powered. The coefficient is positive but is not statistically significant
(Appendix Table A9). Households could also increase or decrease the number of appli-
ances that they use; however, we find no significant effect on any of the large commonly
used appliances (Appendix Table A10), nor do we find any effect on the total number of
appliances owned (results not shown). Electricity-related device ownership is also not
affected, although it was also low within the control group (Appendix Table A11).
6 Returns to Electricity Quality Improvements
In an effort to value the benefits to consumers from the smart meter intervention, we es-
timate the returns to these electricity service quality improvements. To do so, we isolate
the changes in billed electricity consumption resulting from the voltage fluctuation and
outage improvements induced by the household smart meter installation and the trans-
former repairs that followed.
This analysis requires the creation of several additional variables not employed in
the earlier analyses. We create an aggregate reliability measure from household reported
electricity service quality (the total number of outages and number of voltage fluctuations
within a week), using household data from both the baseline and follow-up surveys.15 As
a final outcome measure, we focus on the household billed electricity consumption dur-
15
We use the household reported quality measure because this variable exists for both the pre- and post-
intervention periods, in contrast to the alarm data, for which we do not have baseline data. We consider
this analysis to be sufficient because we previously showed that the measure is significantly and nega-
tively correlated with smart meter alarms indicating electricity quality problems (Appendix Table A6), as
expected.
24ing the peak season (i.e., from November to March of the next year), as that was the
period of greatest electricity demand and worst service quality pre-intervention. We cal-
culate the total billed electricity consumption during this period both before and after the
intervention for each household.
Using this panel data of both electricity quality and billed electricity consumption,
we estimate the returns to the smart meter installation and the resulting electricity quality
improvements employing a two-stage least squares approach. In the first stage, we esti-
mate the effect of the smart meter intervention on electricity service quality as follows:
Reliabilityigt = β1 Treatg × Postt + β2 Replaceg × Postt + β3 Postt + λi + igt , (4)
where Reliabilityigt is the negative of the total number of outage and voltage fluctuation
events within a week, self-reported by household i in transformer g during time period
t. Treatig is an indicator of transformer treatment status, and Replaceig is an indicator
of transformer replacement status equaling 1 if the transformer has been replaced and 0
otherwise. The indicator variable, Postt , equals 1 for the post-intervention heating season
and 0 for the pre-intervention heating season. We include household fixed effects, λi , to
control for time-invariant unobserved household characteristics.
In the second stage, we use the predicted change in reliability from the first stage
to estimate the impact of improvement in electricity service quality on household billed
electricity consumption. We do so as follows:
\
qigt = β1 Reliability (5)
igt + λi + igt ,
where qigt is the total monetized billed electricity consumption during the heating sea-
son from November to March (kWh) for household i in transformer g in time period t.
\
Reliabilityigt is the estimated outcome from the first-stage regression, and λi represents
household fixed effects.
25The estimation requires that the exclusion restriction holds: the interaction of Replaceg ×
Postt must not affect the monetized billed consumption except through changes in relia-
bility. We argue this assumption is reasonable given the bounds set on the meter voltage
fluctuations. We might be concerned that the smart meters are able to “read” electric-
ity consumed at the low voltage and therefore can impact the electricity consumption
through a channel other than changes in reliability; however, the meters automatically
shutdown if voltage drops too outside of the safe range. This feature of the smart meters
rules out this channel through which the smart meters might affect electricity consump-
tion.
Results are in Table 6. Column 1 contains the results from the first-stage regression:
the impact of transformer treatment assignment and replacement on electricity quality.
Column 2 provides the second-stage results: the impact of estimated electricity quality
on electricity consumption. The coefficients can be interpreted as the marginal increase
in monetized electricity consumption with respect to the decrease in the weekly average
outage or voltage fluctuation. The result in Column 2 indicates that reducing the number
of electricity quality incidents (either voltage fluctuation or outage) by one per week on
average results in 1,833 KGS more in billed electricity consumption over the five-month
heating period. This is a welfare improvement of approximately 5.67 USD per month
during the five months of peak electricity consumption (28.35 USD per year).
7 Conclusions
Results from this randomized experiment provide evidence on the effects of and returns
to smart meters and the electricity quality improvements that followed. Utilities in both
developed and developing countries are installing smart meters for a variety of purposes,
such as reducing non-technical losses and increasing electricity service quality. These
basic drivers play an important role in utility adoption of such smart technologies, yet to
26You can also read