Size and body condition of sympatric killer whale ecotypes around the Antarctic Peninsula
←
→
Page content transcription
If your browser does not render page correctly, please read the page content below
Vol. 677: 209–217, 2021              MARINE ECOLOGY PROGRESS SERIES
                                                                                                  Published October 28
https://doi.org/10.3354/meps13866                Mar Ecol Prog Ser

                                                                                                   OPEN
                                                                                                   ACCESS

  Size and body condition of sympatric killer whale
       ecotypes around the Antarctic Peninsula
       J. W. Durban1, 2,*, H. Fearnbach3, A. Paredes3, L. S. Hickmott4, D. J. LeRoi5
       1
       Marine Mammal and Turtle Division, Southwest Fisheries Science Center, National Marine Fisheries Service,
                                8901 La Jolla Shores Drive, La Jolla, CA 92037, USA
                      2
                      Southall Environmental Associates, Inc., 9099 Soquel Dr., Aptos, CA 95003, USA
           3
           SR SeaLife Response, Rehabilitation, and Research, 2003 S. 216th St. #98811, Des Moines, WA 98198, USA
               3

                          4
                            Open Ocean Consulting, 3B Oaklands Road, Petersfield GU32 2EY, UK
                             5
                               Aerial Imaging Solutions, 5 Myrica Way, Old Lyme, CT 06371, USA

      ABSTRACT: Killer whales Orcinus orca are apex predators, and their health can indicate trophic
      dynamics in ecosystems that support them. We used aerial photogrammetry to estimate body
      lengths, to better understand size differences and food requirements, and widths, to infer current
      nutritional condition, of killer whales in the rapidly warming waters around the Antarctic Penin-
      sula. A remotely controlled hexacopter drone was used to collect aerial images of 242 killer
      whales of 3 sympatric ecotypes (Type A, n = 34; Type B1, n = 19; and Type B2, n = 189) in the aus-
      tral summers between 2015/2016 and 2018/2019. Total length (TL) varied between ecotypes, with
      B2s being diminutive in size, indicating large differences in energy requirements. The mean
      length for adult females ranged from 5.82 m (B2s) to 6.93 m (B1s), and the mean for adult males
      ranged from 6.44 m (B2s) to 7.80 m (As). We also found significant differences in head width (HW,
      proxy for body condition), with B2s being significantly leaner. Although this variation may reflect
      natural shape differences, we also estimated divergent regression lines of HW~TL indicating that
      this difference was greater at larger body sizes, with some anomalously thin adult female B2s. We
      suggest that these dissimilarities may indicate a density-dependent response, with leaner body
      condition in adults with higher energetic requirements, as the abundance of B2s is almost an order
      of magnitude greater than that of B1s and As. We hypothesize that food limitation resulted from a
      decline in carrying capacity during recent reductions in sea ice and warmer ocean temperatures.

      KEY WORDS: Photogrammetry · Drone · Antarctica · Climate change · Predator · Marine mammal

                   1. INTRODUCTION                              is under acute transition, with climate warming lead-
                                                                ing to changes in the physical marine environment
  Killer whales Orcinus orca are apex marine preda-             and biology, and interacting with an increase in hu-
tors known to have high caloric requirements (Noren             man activities (Convey & Peck 2019, Gutt et al. 2021).
2011) and therefore show population responses to                Here we report on the use of aerial photogrammetry
changes in prey availability (Ford et al. 2010). Con-           to estimate body lengths, to better understand size
sequently, studies of killer whales may help under-             differences and resultant food requirements, and
stand the impact of physical and biological ecosystem           body widths, to infer current nutritional condition, of
changes by measuring their responses to trophic dy-             killer whales in this changing system. Notably, our
namics in the ecosystem that supports them. The mar-            study in the austral summers of 2015/16 to 2018/19
ine environment around the Antarctic Peninsula (AP)             overlapped with a period of significant reduction in
                                                                © The authors 2021. Open Access under Creative Commons by
*Corresponding author: john.durban@sea-inc.net                  Attribution Licence. Use, distribution and reproduction are un-
                                                                restricted. Authors and original publication must be credited.
                                                                Publisher: Inter-Research · www.int-res.com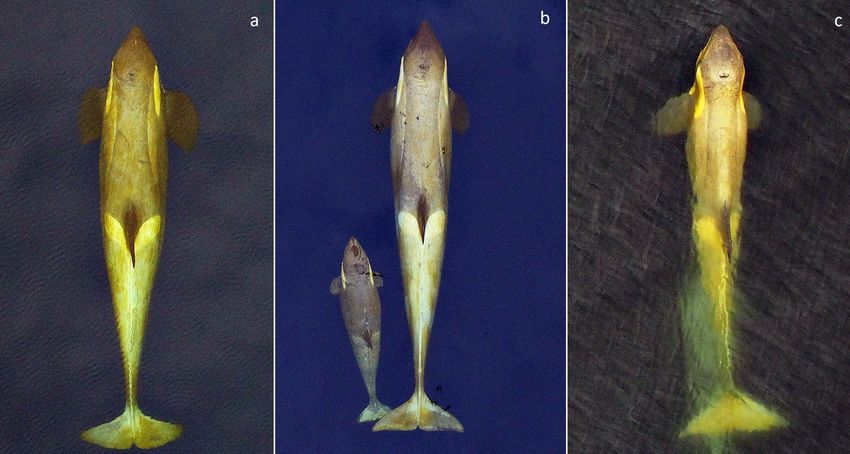
210                                     Mar Ecol Prog Ser 677: 209–217, 2021

sea ice and associated ocean warming in the Weddell         over the past decade, Fearnbach et al. (2021) reported
Sea, which extended to our sampling areas off the           a year of anomalously low survival in 2016−2017, but
northern and western AP (Turner et al. 2020). Specifi-      it is not yet clear if this is a continuing trend. Unfortu-
cally, in the austral summer of 2016/17, the sea ice ex-    nately, the inherent uncertainty of sampling-based
tent dropped to near-record low levels (second lowest       whale population estimates limits statistical power
in a 40 yr record) and remained at near-record low          and requires long time series to detect further trends
levels for the remaining 2 summers of our study             at the population level (Gerrodette 1987).
(Turner et al. 2020).                                          As an alternative, photogrammetry measures of
  A growing body of data is defining 3 generally            individual body condition have recently been shown
sympatric ecotypes of killer whales around the AP,          to offer high statistical power to detect changes in
which are distinct both morphologically (Pitman &           nutritional health of killer whales (Fearnbach et al.
Ensor 2003, Durban et al. 2017) and genetically             2020). For these long-lived top predators, such meas-
(Morin et al. 2010, 2015, Foote et al. 2016). Notably,      ures can be predictive of future mortality risk and
these ecotypes have varying ecology and trophic             therefore can provide an early warning of impending
interactions. Type A ranges widely in the Southern          population effects (Stewart et al. 2021a). In this con-
Ocean and is using AP coastal waters in increasing          text, we used photographs from a remotely con-
abundance, taking advantage of increasingly ice-            trolled drone (Durban et al. 2015) to generate pho-
free waters to prey on marine mammals (Fearnbach            togrammetric measurements of body width to infer
et al. 2019). In contrast, the uniquely pigmented Type      the condition of all 3 killer whale ecotypes and pro-
Bs (2 ecotypes) are endemic to Antarctica, with the         vide a baseline for future monitoring. While body
exception of rapid return migrations to the subtropics      condition informs on current nutritional status and
that are thought to be for physiological maintenance        population health, we also provide estimates of body
and skin growth in warmer waters (Durban & Pitman           length for each type that represent key data for para-
2012, Pitman et al. 2020). Similarly, their physiology      meterization of energetic models for understanding
is adapting to the extreme cold in Antarctica (Foote        prey requirements (Noren 2011).
et al. 2011, 2016) enabling 2 divergent ecotypes (Dur-
ban et al. 2017) to occur year-round in the coastal
waters of the AP: Type B1 specializes in hunting                      2. MATERIALS AND METHODS
seals that haul out on pack ice (Pitman & Durban
2012), while individuals of Type B2 are generally found       Aerial images of killer whales around the AP were
in more open water where they feed on penguins              collected in the austral summer (January to Febru-
(Pitman & Durban 2010) and occasionally Weddell             ary) in each of 4 different years, from 2015/16 to
seals Leptonychotes weddellii (B. Pitman unpubl.            2018/19. Encounters occurred mostly in the coastal
data) and regularly undertake prolonged bouts of            waters close to the west side of the AP, but also to the
deep diving (regular dives of 500−700 m, Pitman et          northeast of the AP in the far western Weddell Sea
al. 2020), likely to feed on fish.                          (Fig. 1). We launched and recovered a remotely con-
  Photographic mark−recapture estimates suggest             trolled hexacopter drone (APH-22 Aerial Imaging
recent population responses of these killer whale eco-      Solutions; Durban et al. 2015, 2016) by hand from a
types that are plausibly related to climate-driven de-      small (5.85 m) inflatable boat that approached killer
clines in sea ice around the AP (Fearnbach et al. 2019,     whales within a typical distance of 200 m. Individual
2021). Specifically, a population decline of the most       whales were distinguished based on distinctive pig-
pagophilic Type B1 contrasts with abundance in-             mentation and scarring patterns that were visible in
creases in Type A killer whales that prefer open            the aerial images (e.g. Durban et al. 2015, Groskreutz
water. This is similar to the contrasting abundance         et al. 2019). Whales were assigned to Type A, B1 or
changes of different penguin species off the western        B2 based on characteristic pigmentation patterns
AP, which has seen an abrupt decline in the breeding        that were visible in aerial photographs and corrobo-
population of ice-obligate Adélie penguins Pygoscelis       rated by boat-based observations and photographs
adeliae and an abrupt increase in ice-intolerant gen-       (Fig. 2 and see Fig. 4; Pitman & Ensor 2003, Durban
too penguins P. papua (Bestelmeyer et al. 2011).            et al. 2017, Fearnbach et al. 2019). Reliable assign-
There are also emerging indications of a change in          ments of type in the field and in subsequent photo-
population health of Type B2 killer whales, the most        graphs by the authors have been repeatedly corrob-
abundant ecotype around the AP. Specifically, despite       orated by genetic analyses (Morin et al. 2010, 2015,
being generally stable in abundance and survival            Foote et al. 2016).
Durban et al.: Size and condition of Antarctic killer whales 211
to collect vertical images from alti-
tudes of 22−48 m to provide a water-
level pixel resolution of 1−2 cm
(Durban et al. 2015). Pixel measure-
ments of killer whale morphometrics
were converted to distance units
using their ratio to the known size of
the camera sensor (4608 pixels =
17.3 mm wide) and were then scaled
to true size (scale = altitude/focal
length) using altitude measured by
an onboard temperature-compen-
sated pressure altimeter (Durban et
al. 2015). Because the killer whales
often did not surface with their
entire body parallel to the water’s
surface, total length (TL) estimates
for each individual were derived
from the addition of the maximum
Fig. 1. Antarctic Peninsula showing locations of 96 flights with a remotely con-
measurements across repeat images
trolled hexacopter drone to obtain aerial images of Type A, B1 and B2 killer for the tip of the rostrum to the ante-
whales. Light gray shows ice sheets and sea ice as a daily average for the rior of the dorsal fin and the anterior
month of January 2018 insertion of the dorsal fin to the
fluke notch; this summation was
During each year, a micro 4/3 digital camera assumed to represent the flattest measurement of
(Olympus E-PM2) and flat lens (25 mm F1.8 Olym- an individual that would be closest to true length
pus M. Zuiko) were mounted on a powered gimbal (Groskreutz et al. 2019).
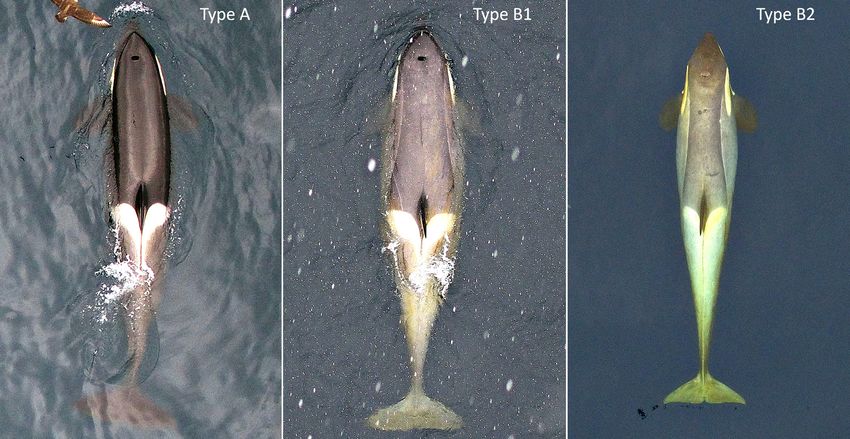
Fig. 2. Aerial images of killer whales of the 3 ecotypes (A, B1 and B2) in the coastal waters of the Antarctic Peninsula. All are
adult females in relatively good body condition for their ecotype; the yellow hue on Type B1 and B2 reflects diatoms on the
skin (see Durban & Pitman 2012). Images collected using a remotely controlled hexacopter at altitudes of ~30 m, scaled to
whale size using camera focal length and altitude estimated from an onboard pressure altimeter (Durban et al. 2015)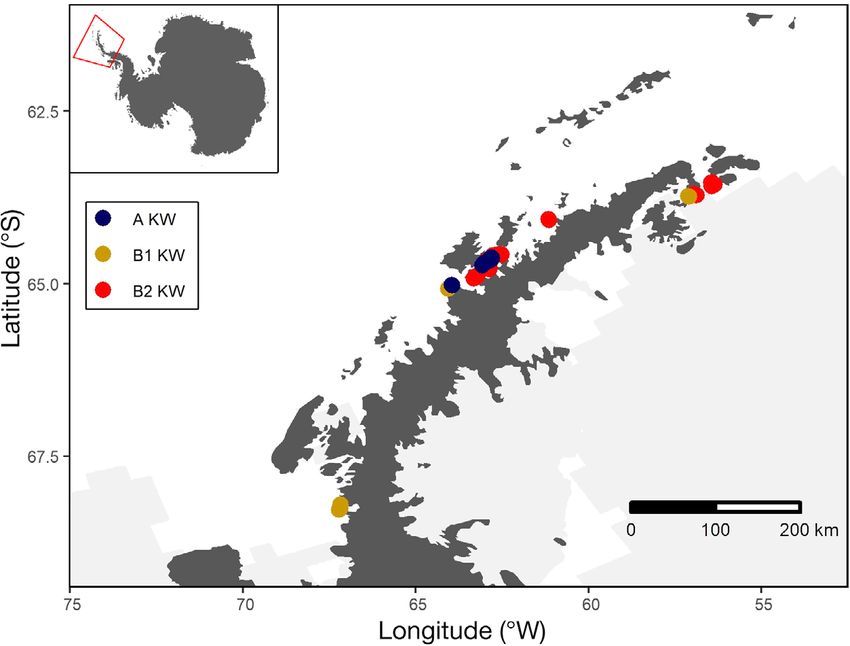
212                                          Mar Ecol Prog Ser 677: 209–217, 2021

   To make consistent comparisons of TL between                     tween the center of the blowhole and anterior inser-
killer whale ecotypes, we identified adult females as               tion of the dorsal fin. Reduced fat storage behind the
those with small calves traveling in echelon position               cranium is an obvious measure of poor condition in
and adult males based on visible secondary sexual                   cetaceans and can result in a ‘peanut head’ appear-
characteristics of enlarged pectoral fins and curved                ance that is particularly visible in aerial images of
tail flukes (Fig. 3). To assess differences in the TLs of           killer whales (Fig. 3; Fearnbach et al. 2018). By exam-
these confirmed males and females, within and be-                   ining aerial images of emaciated killer whales, this
tween ecotypes, we adopted a Bayesian formulation                   HW measure was identified as a useful proxy for body
of a fixed-effects ANOVA model (Kerry 2010). Uni-                   condition, and has been shown to reveal significant
form prior distributions were placed on the mean                    changes over time (Fearnbach et al. 2018). Recogniz-
lengths for each sex−ecotype grouping and on the                    ing that HW changes with body growth (Fearnbach et
residual standard deviation (SD) away from the                      a. 2020), we interpreted the median HW for each indi-
group means. These parameters were estimated by                     vidual in a regression against TL to compare the inter-
fitting to the TL of each individual in each group                  cept and slope of separate regression lines for each
using Markov chain Monte Carlo (MCMC) sampling                      ecotype. We centered each regression on a TL of 6 m,
using the package ‘Nimble’ (de Valpine et al. 2020)                 so the intercept provided a comparative HW measure
in the R statistical environment (R version 3.6.1;                  at TL = 6 m for each type. We adopted a Bayesian for-
www.r-project.org). The probability of whales in one                mulation to make comparisons using direct probability
group having longer lengths than another (e.g.                      statements, and used non-informative uniform prior
p[mean_TLmalesB1 > mean_TLmalesB2]) was simply de-                  distributions on the intercepts, slopes and residual
rived from the proportion of MCMC samples where                     SDs around the regression lines. We calculated the
the difference in parameter estimates was greater                   probability that a given whale was an abnormal out-
than zero.                                                          lier with a residual of more than 2 SDs (i.e. 2 times the
   To quantify body condition, we measured the head                 average residual) on either side of its ecotype regres-
width (HW) for all whales at a distance of 15% be-                  sion line using the Bayesian approach of Chaloner &

Fig. 3. Aerial images of Type B2 killer whales in the coastal waters of the Antarctic Peninsula. (a) Adult male, identified based
on visible secondary sexual characteristics of enlarged pectoral fins and curved tail flukes. (b) Adult female with a small calf in
echelon position. (c) Clearly emaciated adult female displaying the ‘peanut head’ condition (one of the outliers in Fig. 5 and
Table 2), with her dependent calf swimming beneath her. Images collected using a remotely controlled hexacopter drone at
altitudes of ~30 m, scaled to whale size using camera focal length and altitude from an onboard pressure altimeter (Durban
                      et al. 2015). The yellow hue reflects diatoms on the skin (see Durban & Pitman 2012)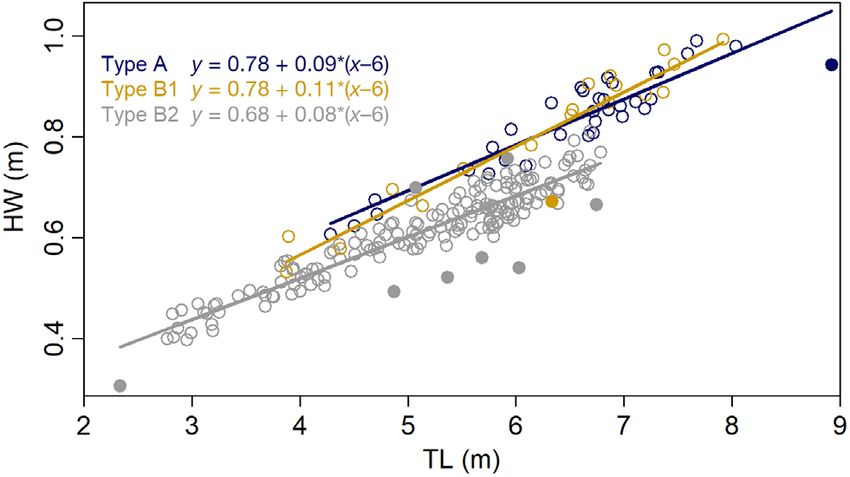
Durban et al.: Size and condition of Antarctic killer whales 213
Brant (1988). The 3 ecotype regression models were and 0.88 for length differences between males and
fit simultaneously using MCMC sampling in the females, respectively, of these types. It was notewor-
package ‘Nimble’ (de Valpine et al. 2020) in R thy that the largest males were Type A (mean = 7.80 m,
(version 3.6.1), and the probability of one regression max = 8.92 m) but the largest females were Type B1
parameter being greater than an another (e.g. (mean = 6.93 m, max = 7.36 m). In contrast, Type B2
p[slopeB1 > slopeB2]) was derived from the proportion individuals were diminutive in length with high
of MCMC samples where the difference in parameter probabilities (p = 1 in all cases) of length differences
estimates was greater than zero. of male and female B2s compared to both other eco-
types. Type B2 males were 1.36 m shorter than Type
A males on average, and females were 1.11 m shorter
3. RESULTS than Type B1 females. There was a high probability
(p = 1) of males being longer than females for all eco-
From 2016 to 2019, we flew 96 hexacopter flights types. This sexual dimorphism was most prominent
over killer whales (Table 1), each lasting an average in Type As, with the average male being 1.04 m
of 9 min (max = 12 min). Measurements of 45 calibra- longer than the average female, compared to only
tion images of a known-length rail on the research 0.65 and 0.62 m for Types B1 and B2, respectively.
boat were also taken on 20 d over all 4 years, and Differences in length translated to differences in
revealed the system to be approximately unbiased HW, with the smaller Type B2s having narrower
with an average error of < 0.01 m. The SD in error heads (Fig. 5). However, the regression of HW
was 3.6% (0.11 m compared to 2.95 m rail). We col- against TL revealed significant differences in HW
lected 3065 measurement-quality images of 242 dif- when accounting for length (Table 2), with high
ferent killer whales comprising all 3 types (Fig. 2, probabilities (p = 1 in both cases) that the intercept of
Table 1), including both adult males and adult fe- HW at TL = 6 m for B2s was thinner than that of both
males of each type (Fig. 3). Type B2s were imaged in As and B1s, respectively. In contrast, there was no
all 4 years of the study, B1s in 3 years and As in 2 dif- evidence (p = 0.42) that Type As were wider than B1s
ferent years (Table 1). Estimates of TL were derived at TL = 6 m. There were also differences in the slopes
from an average (median) of 8 measurements of the of the HW~TL relationships, with the steepest slope
tip of the rostrum to anterior insertion of the dorsal fin for Type B1s (p = 0.91 that it was steeper than Type
per individual (range = 1−23) combined with a median As and p = 0.99 that it was steeper than B2s) indica-
of 6 (1−29) measurements of the anterior insertion of ting that they became significantly more robust with
the dorsal fin to the fluke notch. Body condition was increasing length, particularly in relation to Type
inferred from a median of 6 (1−19) measurements of B2s. Type B2s had the shallowest slope, with p > 0.90
HW for each individual. Variability in repeat meas- that it was in turn shallower than Type As, indicating
urements of the same whale was low, with a mean that their proportionally leaner body condition was
coefficient of variation (= SD/mean) of < 5% for both more pronounced as TL increased. Supporting infer-
TL and HW. ence of their comparative poor condition, 8 Type B2
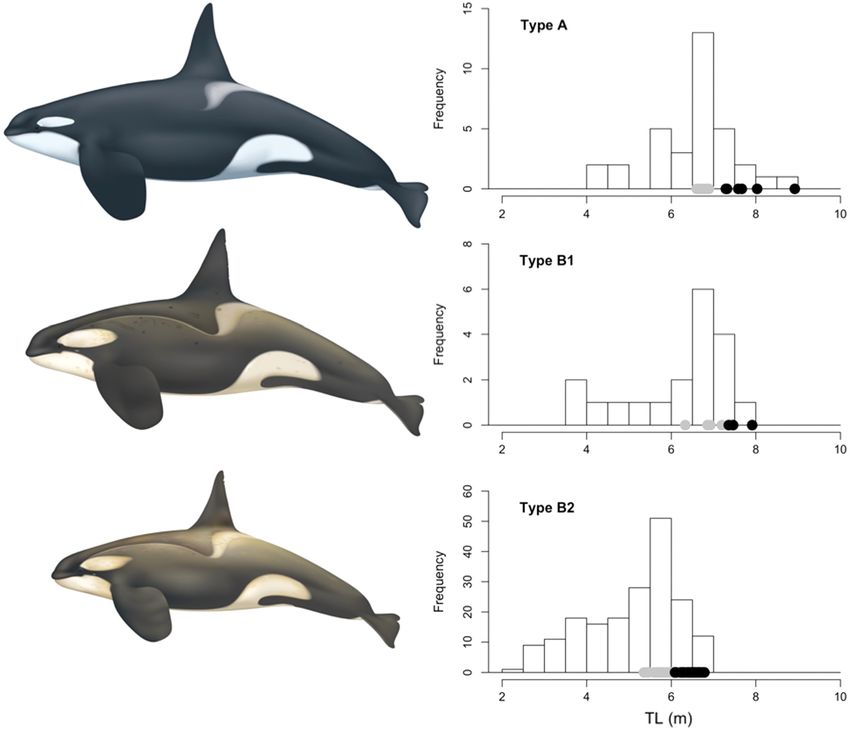
There were notable differences in TL estimates whales measured between 2016 and 2018 were iden-
between types (Table 2, Fig. 4). Confirmed adults of tified as significant outliers (Table 2), and 6 of these
Types A and B1 were of similar sizes, but the had anomalously lean heads with HW below the
ANOVA estimated moderate probabilities of 0.89 regression line (3 in 2016, 1 in 2017 and 2 in 2018;
Table 1. Summary of drone-derived aerial images collected in the coastal waters of the Antarctic Peninsula to estimate length
and body condition for Type A, B1 and B2 killer whales using photogrammetry analyses. Data shown for each year
(2016−2019) are the range (min−max) of sampling dates (month/day), range (min−max) of locations, number and total minutes
of drone flights and the number of different individuals imaged for each ecotype
Year Dates Latitude Longitude Flights Number of individuals
(°S) (°W) (min) Type A Type B1 Type B2
2016 1/12−1/25 64.1−64.6 61.1−62.8 7 (73) 0 0 59
2017 1/24−2/14 63.7−64.8 56.9−63.1 43 (389) 28 7 54
2018 1/20−2/3 64.6−68.3 63.5−67.2 18 (119) 0 5 22
2019 2/2−2/12 63.5−65.1 56.4−64.1 28 (226) 6 7 54214 Mar Ecol Prog Ser 677: 209–217, 2021
Fig. 4. Distributions of total length (TL) estimates for Type A, B1 and B2 killer whales from photogrammetry analysis of aerial
images collected in the coastal waters of the Antarctic Peninsula. TLs for adult males (females) are shown by black (gray)
circles. Illustrations by Uko Gorter, scaled to the mean TL estimates of adult males for each type (Table 1)
Table 2. Summary of length and body condition parameters for Type A, B1 and B2 killer whales from photogrammetry analysis
of aerial images collected in the coastal waters of the Antarctic Peninsula. The sample size n of all whales is shown, along with
the mean total length (TL), standard deviation (SD) and sample sizes for confirmed adult females (fem) and adult males of each
type. A linear model of head width (HW, proxy for body condition) against TL for all whales produced parameters for intercept
(HW_int) that represented HW at a TL = 6 m, a slope (HW_slope) and a residual SD about the trendline (HW_resid); these pa-
rameters are presented as medians of Bayesian posterior distributions along with 95% highest posterior probability intervals
(PI). Outliers are whales that had a high probability (p > 0.75) of a residual of > 2 SD on either side of the regression line
Type n TLfem (m) TLmale (m) HW_int HW_slope HW_resid Outliers
(total) (n, SD) (n, SD) (95% PI) (95% PI) (95% PI)
A 34 6.76 7.80 0.78 0.09 0.04 1
(10, 0.09) (6, 0.61) (0.77, 0.80) (0.08, 0.11) (0.04, 0.05)
B1 19 6.93 7.58 0.78 0.11 0.05 1
(6, 0.35) (3, 0.29) (0.76, 0.80) (0.09, 0.13) (0.04, 0.07)
B2 189 5.82 6.44 0.68 0.08 0.04 8
(35. 0.21) (24, 0.22) (0.67, 0.69) (0.08, 0.09) (0.03, 0.04)Durban et al.: Size and condition of Antarctic killer whales 215
Differences in body condition between the eco-
types informs nutritional health and provides impor-
tant insight into population health (Stewart et al.
2021a). In particular, Type B2 killer whales were sig-
nificantly leaner than the larger Types A and B1,
even after controlling for body length differences. Al-
though this may reflect natural shape differences be-
tween the ecotypes, divergent regression lines of
HW~TL indicated that this difference was becoming
even more pronounced at larger body sizes, with
some anomalously thin adult female B2s, high-
lighting that the adults with higher energetic re-
Fig. 5. Head width (HW, proxy for body condition) against
quirements (see Noren 2011, Fearnbach et al. 2018)
total length (TL) for individual killer whales of Types A, B1
and B2 measured around the Antarctic Peninsula using aer- were presenting in leaner body condition. This ini-
ial photogrammetry. Lines and equations show the model fit tially may seem contrary to recent abundance trends,
of a linear model for y = HW against x = TL centered on 6 m which have documented Type B1s declining over
(x–6), based on median estimates of Bayesian posterior dis- the past decade, Type As increasing and Type B2s
tributions. Outliers, shown by filled circles, are whales that
had a high probability (p > 0.75) of a residual of > 2 SD on
generally stable (Fearnbach et al. 2019, 2021). How-
either side of the regression line ever, Type B2s are present around the AP in much
higher abundance than the other killer whale types,
with a population size approaching 1000 in recent
Fig. 5). Three of these were adult females (Fig. 3) and years, compared to ~100 for B1s and ~150 for As
1 was a dependent calf of one of these females. (Fearnbach et al. 2019, 2021). As such, poorer body
condition and smaller body sizes may represent den-
sity-dependent responses (e.g. Kasuya 1991) of a
4. DISCUSSION population close to carrying capacity, or the result of
food limitation in a stable population as a result of
Data on body lengths are a key component for esti- acute environmentally driven changes in their carry-
mating the trophic requirements of killer whales and ing capacity (Moore et al. 2001).
can therefore help to fill key data gaps on apex pred- More information is required on the relative contri-
ators by parameterizing energetic models of trophic butions of different prey species to the diets of killer
dynamics (e.g. Guénette et al. 2006). Specifically, their whale types around the AP, particularly Type B2, so
food requirements depend on body mass (Noren we can better understand the predator−prey dynam-
2011), which scales non-linearly with body length ics that define carrying capacity. However, well-doc-
(Bigg & Wolman 1975). We measured large differ- umented environmental changes around the AP sup-
ences in body length between the killer whale eco- port the hypothesis of food limitation concurrent with
types found around the AP, with ecotype B2 being our study. In addition to longer-term climate warm-
diminutive in length compared to the other ecotypes ing around the AP (Convey & Peck 2019), our study
A and B1, which will translate into large differences overlapped with a period of acute sea ice reduction
in prey requirements. Adult females ranged in aver- and warmer ocean temperatures (Turner et al. 2020).
age size from 5.82 m in the small Type B2s to 6.93 m Tight relationships between sea ice, primary produc-
in the largest B1s, while adult males ranged in aver- tion and abundance of marine herbivores, notably
age size from 6.44 m (Type B2) to 7.80 m (Type A). Antarctic krill Euphausia superba, suggest that these
These differences are even greater if we convert changes likely had major impacts on the pelagic food
length to body mass due to the non-linear relation- web on which killer whales depend (Gutt et al. 2021).
ship (Bigg & Wolman 1975), which predicts that mass Direct effects of sea-ice changes have also been doc-
of average males would range from 3602 kg for umented for known or suspected prey of Type B2
Type B2 to 5902 kg for Type A, a difference of killer whales, including ice-obligate penguin and
2300 kg. However, this relationship was based on live- Weddell seal populations (e.g. Chambert et al. 2012,
captured killer whales in the eastern North Pacific Le Guen et al. 2018, Ropert-Coudert et al. 2018).
Ocean, and therefore does not fully account for the Similarly, the keystone fish species, the Antarctic sil-
significant variation in body condition reported here verfish Pleuragramma antarctica, uses the sub-ice
between AP killer whale types. platelet layer as a nursery ground (Vacchi et al.216 Mar Ecol Prog Ser 677: 209–217, 2021
2017), and large reductions in the distribution of LITERATURE CITED
these ice-dependent silverfish have occurred on the
Bestelmeyer BT, Ellison AM, Fraser WR, Gorman KB and
western AP shelf (Parker et al. 2015), even prior to others (2011) Analysis of abrupt transitions in ecological
the recent acute reduction in sea ice. systems. Ecosphere 2:1–26
Although Type B2 killer whales have generally Bigg MA, Wolman AA (1975) Live-capture killer whale
been stable in abundance over the last decade (Fearn- (Orcinus orca) fishery, British Columbia and Washington,
1962−73. J Fish Res Board Can 32:1213−1221
bach et al. 2021), our recent data on poor body condi-
Chaloner K, Brant R (1988) A Bayesian approach to
tion may be predictive of future mortalities. Similar outlier detection and residual analysis. Biometrika 75:
photogrammetry research has recently linked poor 651−659
body condition to a subsequent increase in mortality Chambert T, Rotella JJ, Garrott RA (2012) Environmental
extremes versus ecological extremes: impact of a mas-
for killer whales in the eastern North Pacific (Stewart
sive iceberg on the population dynamics of a high-
et al. 2021a), documented poor body condition and level Antarctic marine predator. Proc R Soc B 279:
constrained growth to be associated with declining 4532−4541
abundance of North Atlantic right whales Eubal- Christiansen F, Dawson SM, Durban JW, Fearnbach H and
aena glacialis (Christiansen et al. 2020, Stewart et others (2020) Population comparison of right whale body
condition reveals poor state of the North Atlantic right
al. 2021b) and revealed reduced body condition whale. Mar Ecol Prog Ser 640:1−16
associated with an unusual mortality event for east- Christiansen F, Rodríguez-González F, Martínez-Aguilar S,
ern North Pacific gray whales Eschrichtius robustus Urbán J and others (2021) Poor body condition associ-
(Christiansen et al. 2021). Of particular note, the ated with an unusual mortality event in gray whales. Mar
Ecol Prog Ser 658:237−252
anomalously low survival of Type B2 killer whales
Convey P, Peck LS (2019) Antarctic environmental change
between 2015/16 and 2016/17 reported by Fearn- and biological responses. Sci Adv 5:eaaz0888
bach et al. (2021) coincided with our documentation de Valpine P, Paciorek C, Turek D, Michaud N and others
of Type B2 killer whales in relatively poor body con- (2020) Nimble: MCMC, particle filtering, and program-
dition, including the anomalously lean outliers. An mable hierarchical modeling. R package version 0.9.1.
https://CRAN.R-project.org/package=nimble
extended time series of body condition data will fur- Durban JW, Pitman RL (2012) Antarctic killer whales make
ther elucidate this apparent link between condition rapid, round-trip movements to subtropical waters: evi-
and population dynamics (e.g. Stewart et al. 2021a). dence for physiological maintenance migrations? Biol
As such, the new photogrammetry measurements Lett 8:274−277
Durban JW, Fearnbach H, Barrett-Lennard LG, Perryman
presented here represent important baselines for WL, Leroi DJ (2015) Photogrammetry of killer whales
monitoring future changes in the nutritional health of using a small hexacopter launched at sea. J Unmanned
these apex predators in the face of climate-driven Veh Syst 3:131−135
ecosystem dynamics. Durban JW, Moore MJ, Chiang G, Hickmott LS and others
(2016) Photogrammetry of blue whales with an un-
manned hexacopter. Mar Mamm Sci 32:1510−1515
Acknowledgements. All field work was conducted from Durban JW, Fearnbach H, Burrows DG, Ylitalo GM, Pitman
small boat launches from Lindblad Expedition’s ship MV RL (2017) Morphological and ecological evidence for two
‘National Geographic Explorer’. We are extremely grateful sympatric forms of Type B killer whale around the
Antarctic Peninsula. Polar Biol 40:231−236
for support from the Lindblad-Expeditions-National Geo-
Fearnbach H, Durban JW, Ellifrit DK, Balcomb KC (2018)
graphic (LEX-NG) Conservation Fund, from Amy Berquist
Using aerial photogrammetry to detect changes in body
from LEX, and from all onboard officers, crew and expedi-
condition of endangered southern resident killer whales.
tion staff. Particular thanks go to Captains Oliver Kruess and
Endang Species Res 35:175−180
Leif Skog, and Expedition Leaders Lucho Verdesoto, Brent
Fearnbach H, Durban JW, Ellifrit DK, Pitman RL (2019)
Stephenson, Jimmy White, Russ Evans and Lisa Trotter.
Abundance of Type A killer whales (Orcinus orca) in the
Molly Groskreutz and Paige Casler assisted with laboratory coastal waters off the western Antarctic Peninsula. Polar
photogrammetry measurements. Trevor Joyce, Jessica Far- Biol 42:1477−1488
rer, Jimmy White, Doug Gaultieri, Paul North, Ian Tomcho, Fearnbach H, Durban JW, Barrett-Lennard LG, Ellifrit DK,
Eduardo Shaw and Bud Lehnhausen assisted ably in the Balcomb KC (2020) Evaluating the power of photogram-
field. The Pew Charitable Trusts and the LEX-NG Conser- metry for monitoring killer whale body condition. Mar
vation Fund supported image analysis. Wayne Perryman, Mamm Sci 36:359−364
Bob Pitman, George Watters and Dave Weller provided use- Fearnbach H, Durban JW, Ellifrit DK, Paredes A, Hickmott
ful comments on an earlier version of this manuscript. We LS, Pitman RL (2021) A decade of photo-identification
are grateful for the helpful reviews by 3 anonymous review- reveals contrasting abundance and trends of Type B
ers, and for extremely useful suggestions by the handling killer whales in the coastal waters of the Antarctic Penin-
editor, Robert Suryan. Research was authorized by Permits sula. Mar Mamm Sci, https://doi.org/10.1111/mms.12846
14097 and 19091 from the US National Marine Fisheries Foote AD, Morin PA, Durban JW, Pitman RL and others
Service and Antarctic Conservation Act Permits 2015-001 (2011) Positive selection on the killer whale mitogenome.
and 2017-029 from the US National Science Foundation. Biol Lett 7:116−118Durban et al.: Size and condition of Antarctic killer whales 217 Foote AD, Vijay N, Ávila-Arcos MC, Baird RW and others radiation and diversification in the killer whale. Mol Ecol (2016) Genome-culture coevolution promotes rapid di- 24:3964−3979 vergence of killer whale ecotypes. Nat Commun 7:11693 Noren DP (2011) Estimated field metabolic rates and prey Ford JK, Ellis GM, Olesiuk PF, Balcomb KC (2010) Linking requirements of resident killer whales. Mar Mamm Sci killer whale survival and prey abundance: food limita- 27:60−77 tion in the oceans’ apex predator? Biol Lett 6:139−142 Parker ML, Fraser WR, Ashford J, Patarnello T, Zane L, Tor- Gerrodette TM (1987) A power analysis for detecting trends. res JJ (2015) Assemblages of micronektonic fishes and Ecology 68:1364−1372 invertebrates in a gradient of regional warming along Groskreutz MJ, Durban JW, Fearnbach H, Barrett-Lennard the Western Antarctic Peninsula. J Mar Syst 152:18−41 LG, Towers JR, Ford JKB (2019) Decadal changes in Pitman RL, Durban JW (2010) Killer whale predation on adult size of salmon-eating killer whales in the eastern penguins in Antarctica. Polar Biol 33:1589−1594 North Pacific. Endang Species Res 40:183−188 Pitman RL, Durban JW (2012) Cooperative hunting behav- Guénette S, Heymans SJ, Christensen V, Trites AW (2006) ior, prey selectivity and prey handling by pack ice killer Ecosystem models show combined effects of fishing, pre- whales (Orcinus orca), type B, in Antarctic Peninsula dation, competition, and ocean productivity on Steller waters. Mar Mamm Sci 28:16−36 sea lions (Eumetopias jubatus) in Alaska. Can J Fish Pitman RL, Ensor P (2003) Three forms of killer whales (Orci- Aquat Sci 63:2495−2517 nus orca) in Antarctic waters. J Cetacean Res Manag 5: Gutt J, Isla E, Xavier JC, Adams BJ and others (2021) 131−140 Antarctic ecosystems in transition — life between stresses Pitman RL, Durban JW, Joyce T, Fearnbach H, Panigada S, and opportunities. Biol Rev (Camb) 96:798−821 Lauriano G (2020) Skin in the game: epidermal molt as a Kasuya T (1991) Density dependent growth in North Pacific driver of long-distance migration in whales. Mar Mamm sperm whales. Mar Mamm Sci 7:230−257 Sci 36:565−594 Kéry M (2010) Introduction to WinBUGS for ecologists: Ropert-Coudert Y, Kato A, Shiomi K, Barbraud C and others Bayesian approach to regression, ANOVA, mixed mod- (2018) Two recent massive breeding failures in an Adélie els and related analyses. Academic Press, Cambridge, MA penguin colony call for the creation of a marine protected Le Guen C, Kato A, Raymond B, Barbraud C and others area in D’Urville Sea/Mertz. Front Mar Sci 5:264 (2018) Reproductive performance and diving behaviour Stewart JD, Durban JW, Fearnbach H, Barrett-Lennard LG, share a common sea-ice concentration optimum in Adélie Casler PK, Ward EJ, Dapp DR (2021a) Survival of the fat- penguins (Pygoscelis adeliae). Glob Change Biol 24: test: linking body condition to prey availability and sur- 5304−5317 vivorship of killer whales. Ecosphere 12:e03660 Moore SE, Perryman WL, Gulland F, Wade PR, Rojas-Bracho Stewart JD, Durban JW, Knowlton AR, Lynn MS and others L, Rowles T (2001) Are gray whales hitting ‘K’ hard? Mar (2021b) Decreasing body lengths in North Atlantic right Mamm Sci 17:954−958 whales. Curr Biol 31:3174–3179.e3 Morin PA, Archer FI, Foote AD, Vilstrup J and others (2010) Turner J, Guarino MV, Arnatt J, Jena B and others (2020) Complete mitochondrial genome phylogeographic ana- Recent decrease of summer sea ice in the Weddell Sea, lysis of killer whales (Orcinus orca) indicates multiple Antarctica. Geophys Res Lett 47:e2020GL087127 species. Genome Res 20:908−916 Vacchi M, Pisano E, Ghigliotti L (2017) The Antarctic silver- Morin PA, Parsons KM, Archer FI, Ávila-Arcos MC and oth- fish: a keystone species in a changing ecosystem. Springer ers (2015) Geographic and temporal dynamics of a global International Publishing, Basel Editorial responsibility: Robert M. Suryan, Submitted: August 13, 2020 Juneau, Alaska, USA Accepted: August 9, 2021 Reviewed by: A. Friedlaender and 2 anonymous referees Proofs received from author(s): October 2, 2021
You can also read