Simultaneous removal of lead and copper from synthetic water by electrocoagulation and techno-economic evaluation: optimization through response ...
←
→
Page content transcription
If your browser does not render page correctly, please read the page content below

INTERNATIONAL
JOURNAL OF
International Journal of Engineering, Science and Technology ENGINEERING,
MultiCraft Vol. 13, No. 1, 2021, pp. 61-68 SCIENCE AND
TECHNOLOGY
www.ijest1-ng.com
www.ajol.info/index.php/ijest
2021 MultiCraft Limited. All rights reserved
Simultaneous removal of lead and copper from synthetic water by
electrocoagulation and techno-economic evaluation: optimization through
response surface methodology
A. K. Varma1, A. Chouhan2, R. Shankar3, P. Mondal4, A.K. Rathore5, L.S. Thakur 2*
1
Department of Chemical Engineering, Assam Energy Institute (A centre of RGIPT, Jais, Amethi) Sivasagar, Assam, INDIA
2
Department of Chemical Engineering Ujjain Engineering College Ujjain, Madhya Pradesh, INDIA
3
Department of Chemical Engineering, Madan Mohan Malviya University of Technology, Gorakhpur, Uttar Pradesh, INDIA
4
Department of Chemical Engineering, Indian Institute of Technology Roorkee, Roorkee, Uttarakhand, INDIA
5
Department of Chemical Engineering, Harcourt Butler Technical University, Kanpur, Uttar Pradesh, INDIA
*
Corresponding Author: e-mail: lokendrast@rediffmail.com, Tel +91-734-2511912, Fax.+91-734-2511912
https://orcid.org/0000-0002-8407-4503 (L.S.Thakur)
Abstract
In the present study, the electrocoagulation process using iron electrodes was used to treat synthetic water containing lead and
copper. Box-Behnken design of response surface methodology was applied to optimize the process variables namely initial pH,
current density and treatment time along with operating cost. At optimum conditions (initial pH: 5, current density: 50 A/m2,
treatment time: 40 min), the model predicted value for removal of lead and copper was found as 102.81% and 99.75%,
respectively with an operating cost of 0.481 USD/m3. Whereas, the actual or experimental values of lead and copper removal
were found as 99.98 % and 99.88 % as well as operating cost of 0.476 USD/m3, which signifies a good closeness between the
model predicted values and actual values. The concentration of lead and copper in treated water was found below the
permissible limits as per CPCB norms for industrial discharge.
Keywords: Electrocoagulation, lead, copper, operating cost, Box-Behnken design.
DOI: http://dx.doi.org/10.4314/ijest.v13i1.9S
Cite this article as:
Varma A. K., Chouhan A., Shankar R., Mondal P., Rathore A.K., Thakur L.S. 2021. Simultaneous removal of lead and copper from synthetic water by
electrocoagulation and techno-economic evaluation: optimization through response surface methodology, International Journal of Engineering, Science and
Technology, Vol. 13, No. 1, pp. 61-68. doi: 10.4314/ijest.v13i1.9S
Received: December 1, 2019; Accepted: February 5, 2021; Final acceptance in revised form: March 31, 2021
This paper was earlier presented at the International Conference on Energy, Environment & Material Sciences (ICE2M), 1-3 December 2019 and substantially
improved for this Special Issue. Guest Editor: Dr. Sri Niwas Singh, Professor (HAG), Department of Electrical Engineering, Indian Institute of Technology
Kanpur, 208016 (U.P.) India, former Vice-Chancellor, Madan Mohan Malviya University of Technology Gorakhpur (April 2017 to July 2020).
1. Introduction
Due to exponential increase in number of industries and human colonization in all parts of the world, ecosystem has been
devastatingly affected by release of toxic heavy metals in the water bodies. Even very less amount of toxic heavy metal can
lethally contaminate the water bodies, so the risk of impact of heavy metals cannot be ignored any more. Removal of toxic heavy
metal from water has become a topic of major concern in all parts of the world due to strict environmental laws (Yetilmezsoy et
al., 2009).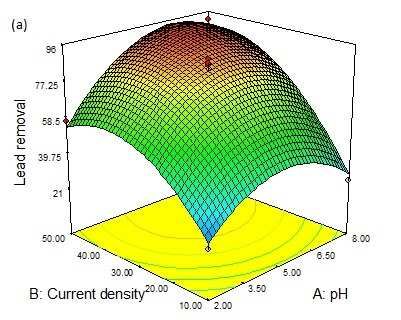
62         Varma et al./ International Journal of Engineering, Science and Technology, Vol. 13, No. 1, 2021, pp. 61-68

   Lead has been reported as one of the most hazardous heavy metals (Yetilmezsoy et al., 2009). It enters into the environment
through natural and anthropogenic process such as earth crust, volcanic activities, sulfide ore smelting, mining and fossil fuel
combustion (Rajput et al., 2016). Long term exposure of lead can be responsible for the general metabolic poison, blood and brain
disorder (Mohod and Dhote, 2013). Copper is an essential element for living beings. Industrial effluents of pulp, paperboard mills,
metal cleaning, plating baths etc are the major source of copper contamination in water (Boujelben et al., 2009). Copper toxicity
leads injury to red blood cells, lungs and damage the pancreatic and liver functions (Bailey et al., 1999). There are many industries
such as leather, paper and pulp, smelting, electrical, mining and electroplating in which both lead and copper are found in effluent
(Iqbal and Khera, 2015).
     Among the various available technologies such as chemical precipitation, ion exchange, membrane separation etc for the
treatment of wastewater, electrocoagulation (EC) process is the most efficient and cost effective technique (Adhoum et al., 2004;
Can et al., 2006). The process of electrocoagulation involves the formation of coagulant inside the cell as direct current is passed
in cell. Iron anode dissolves and releases metal ions in the solution simultaneously hydrogen gas is evolved at cathode which
thereby creates froth (Adhoum et al., 2004). This froth make the contaminants float on the upper surface (Fu and Wang, 2011).
Oxidation takes place at anode, whereas, reduction occurs at cathode. Removal of contaminants may occur due to adsorption,
charge neutralization, co-precipitation, sweep coagulation, sedimentation or floatation (Thakur and Mondal, 2016). Main reactions
occur in case of iron electrodes are as follows (Bazrafshan et al., 2011).
At anode:
                              Fe(s) → Fe3+ (aq) + 3e‒ (aq)                                          (1)
At cathode:
                              2H2O(I) + 2e‒ (aq) → H2(g) + 2OH‒(aq)                                 (2)
   3+        –
Fe and OH ions gets hydrolysed in solution and form ferric hydroxide:
                             Fe3+ + 3OH‒ → Fe(OH)3                                                  (3)
    There are many literatures available on the removal of lead and copper from wastewater (Mansoorian et al., 2014; Gatsios et
al., 2015; Bhagawan et al., 2014). However, there is limited research work found on the techno economic assessment of the
lead/copper removal by electrocoagulation process (Bhagawan et al., 2014). Nevertheless, no literature is available on
simultaneous removal of lead and copper as well as their techno economic evaluation by electrocoagulation using Response
Surface Methodology (RSM). RSM is an intelligent technique in terms of mathematical and statistical analysis used for
experimental design, building of model and to optimize the process parameters. RSM also reveals the relationship between the
input factors and response (Thakur and Mondal, 2016). The present research focused on a) To optimize the process parameters
such as current density, initial pH and treatment time for simultaneous treatment of lead and copper from synthetic water coupled
with the operating cost through electrocoagulation process by using Box-Behnken Design (BBD), b) To build input-output model
for EC process, c) To affirm the established model.

2. Materials and Methods

2.1 Material: All the chemicals were of analytical grade and solution was prepared with distilled water. 1N HCL and 1N NaOH
solution were used to attain the desired pH of the solution. All electrocoagulation experiments were done in a batch reactor, which
was made of Perspex with dimension of 15 cm × 10 cm × 12 cm. Iron (Fe) plates (8 cm × 8 cm) were used as anode and cathode.
Electrodes were coupled to DC power supply (0-10A and 0-30V). Anode and cathode was kept constant at 1 cm apart for all the
experiments.

2.2 Methods: Before start of experiment, electrodes were cleaned using sand paper, dilute nitric acid and finally with distilled
water, after that dried in a hot air oven and weighted. By the end of each experiment, electrodes were cleaned with tap water in
order to remove any solid residual particle from electrode surface. The electrodes were again dried and weighted. The
experimental solution is comprised of definite concentration of 10 mg/L of lead and 40 mg/L of copper and it was analysed under
various experimental conditions with stirring done at 400 RPM by magnetic stirrer. Fig. 1 represents the setup of
electrocoagulation process. Sodium chloride (1 gm/l) was added into the solution to increase the electrical conductivity. At the end
of each experiment, final sample was filtered with 0.45 micron Whatman filter to analyse the concentration of lead and copper by
using Atomic Absorption Spectrophotometer (AAS, Shimadzu, model-AA-6300). Removal efficiency of lead and copper was
computed by the following Equation:
                                    Removal efficiency (%) = (Ci ‒ Cf)/Ci ×100                   (4)
Where Ci and Cf are initial concentration and final concentration of contaminants in solution, respectively.
For the operating cost, only the cost of electrode & electricity was considered (Equation 5) [10].
                                   Operating cost = a × Celectrode + b × Cenergy                  (5)
    Where, Celectrode is electrode consumption used in the treatment of lead and copper (kg/m3), Cenergy is the electrical energy used
in the treatment of lead and copper (Kwh/m3), a is wholesale electrode material price = 0.62 USD/kg (Web link 1) and b is the
industrial electricity price = 0.11 USD/kwh (Web link 2).
Energy consume in EC process was computed by Equation 6:
              Energy consumption (Kwh/m3) = (voltage × current × runtime)/ (Working volume of reactor)                (6)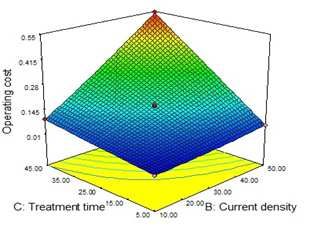
63         Varma et al./ International Journal of Engineering, Science and Technology, Vol. 13, No. 1, 2021, pp. 61-68

   The electrode material cost was considered in terms of weight loss during the experiment by subtracting the weight of anode
electrode before and after electrocoagulation process (Thakur and Mondal, 2016).

                                     Fig. 1 Experimental setup for electrocoagulation process
2.3 Box-Behnken Design: Box-Bhenken Design (BBD) is an independent quadratic design it does not comprise any embedded
factorial design. BBD uses three level factors and establishes quadratic models. BBD is rotatable or nearly rotatable used three
factors of each level to run (Ferreira et al., 2007). In the present work, three level BBD is applied to study the effect of process
variables (A: initial pH, B: current density, C: Treatment time) at three levels (−1, 0, +1) on the three responses (Y1: lead removal
(%), Y2: copper removal (%) and Y3: operating cost). To develop empirical model and to correlate the % removal of lead and
copper as well as operating cost with the process variables, the data generated through 17 numbers of experiments mentioned in
Table 1, have been processed using Design of expert software (DOE 7.0.0).

                                                      Table 1. Box Behnken Design
                                    Run      Initi   Curre      Treat     Lead      Coppe       Oper       Fin
                                    no.       al       nt       ment      remo         r        ating       al
                                              pH     density     time       val     remov        cost      pH
                                                     (A/m2)     (min)      (%)      al (%)     (USD/
                                                                                                 m3)
                                      1        5        30        25      85.88      75.01      0.171      6.9
                                      2        5        30        25       88.9      73.2      0.169       6.9
                                      3        5        50        45      99.99      99.99     0.545       7.0
                                      4        8        10        25      25.76      60.1      0.052       8.3
                                      5        2        50        25      57.11      80.8      0.293       5.4
                                      6        8        30        45      85.88      90.1      0.307       9.7
                                      7        5        10         5       9.89      22.01     0.010       5.2
                                      8        2        30         5       19.9      39.9      0.032       2.6
                                      9        5        10        45      43.45      68.2      0.094       5.4
                                     10        5        30        25      83.21      73.1      0.167       6.8
                                     11        5        50         5      30.11      84.1      0.060       5.3
                                     12        2        30        45       50.4      64.01     0.302       5.6
                                     13        5        30        25      86.56      75.5      0.166       6.9
                                     14        8        50        25      91.45      95.45     0.303       9.1
                                     15        2        10        25       21.3      29.01     0.051       3.2
                                     16        5        30        25      83.02      73.8      0.170       6.9
                                     17        8        30         5      24.12      49.9      0.033       8.4
                                          Range of pH: 2,5,8; Range of current density: 10, 30, 50 A/m2,
64 Varma et al./ International Journal of Engineering, Science and Technology, Vol. 13, No. 1, 2021, pp. 61-68
3. Results and Discussion
3.1 Development of Electrocoagulation Models: Using Design-Expert 7.0.0 software, all the responses such as linear, 2-factor
interaction, quadratic and cubic models were analyzed and suggested lowest p-value for the quadratic model only. The p-value was
low for all the three models which signifies that minimum one of the variable in each model has significant effect on the response.
The developed quadratic models given by Design of expert software are as follow:
Lead removal (Y1) = ‒ 69.07 + 17.05 × pH + 2.61 × Current density + 2.60 × Treatment time + 0.12 × pH × Current density +
0.13 × pH × Treatment time + 0.02 × Current density × Treatment time ‒ 2.07 ×pH2 ‒ 0.044 × Current density2 ‒ 0.05 ×
Treatment time2
Copper removal (Y2) = ‒ 42.80 + 12.33 × pH + 1.96 × Current density + 1.70 × Treatment time ‒ 0.068 × pH × Current density +
0.067 × pH × Treatment time ‒ 0.02 × Current density × Treatment time ‒ 0.85 × pH2 ‒ 2.3× 10‒4 × Current density2 ‒ 0.014 ×
Treatment time2
Operating cost (Y3) = 0.016 + 6.08 × 10‒4 × pH ‒ 1.37 × 10‒3 × Current density ‒ 7.8× 10‒4 × Treatment time + 3.62× 10‒5 × pH ×
Current density + 1.70× 10‒5 × pH × Treatment time + 2.5× 10‒4 × Current density × Treatment time ‒ 1.42 × 10‒4 × pH2 + 1.9 ×
10‒5 × Current density2 + 2.78× 10‒6 × Treatment time2
In the present study, for all the three responses lead removal (Y1), copper removal (Y2) and operating cost (Y3) R2 value are
recorded as 0.992, 0.997 and 0.999, respectively. The ANOVA results as listed in Table 2, whereas, the p value is < 0.0001. The
difference between predicted R2 and adjusted R2 for all three models are also in acceptable range (˂0.2) and the adequate
precisions are also high (29.88-165.19). Thus, it is concluded that the quadratic models correlating the three responses with process
parameters are appropriate.
Table 2. Anova results for lead, copper removal and operating cost
Response Lead removal (Y1) Copper removal (Y2) Operating cost (Y3)
Source p-value Remark p-value Remark p-value Remark
Model < 0.0001 Significant < 0.0001 Significant < 0.0001 Significant
A 0.0003 < 0.0001 0.1996
B < 0.0001 < 0.0001 < 0.0001
C < 0.0001 < 0.0001 < 0.0001
AB 0.008 0.0026 0.33
AC 0.0064 0.0029 0.6372
BC 0.003 < 0.0001 < 0.0001
A2 < 0.0001 < 0.0001 0.5455
B2 < 0.0001 0.9191 0.007
C2 < 0.0001 0.0004 0.5991
Lack of Fit 0.0752 Not significant 0.0746 Not significant 0.0666 Not significant
R2 = 0.992, R2(pred.) = 0.904,R2 = 0.997, R2 = 0.999, R2(pred.) = 0.995,
R2(adj.) = 0.983, A. P. = R2(pred.) = 0.961, R2(adj.) = R2(adj.) = 0.999, A. P. = 65.19
29.88 0.993,
A. P. = 55.73
Adj. – adjusted, Pred. - predicted, A. P. - Adequate precision
3.2 Analysis of Response Surfaces: Data generated through DOE are applied to plot the Fig.2 (a), (b) and (c) as well as also used to
describe the effect of pH, current density and treatment time, respectively on removal efficiency of lead and copper and operating
cost. It is display from Fig.2 (a) that the percentage removal of lead raises from 60.97% at initial pH 2 and complete removal is
found at pH of 5 and above. This observation can be explained on the basis of the solution phase chemistry of the lead species and
surface chemistry of the coagulant generated in situ. In the aqueous solution Pb(II) may exists in from of Pb2+, PbOH+, PbO2(s),
−
HPb O2 . At lower pH, the Pb(II) predominately present in positive charge species and iron (coagulant generated in situ) is also
present in positive charge species (Fe2+ & Fe3+) (Takeno 2005) and hence, due to charge repulsion these condition is not favor for
the chemisorption of Pb(II), in spite of that 60.97% removal is observed at initial pH 2. It is noticed that within 5 min of treatment
time along with current density of 30 A/m2, the solution pH increases from 2 to 2.6 (Run No. 8 in Table 2) and after 45 min it
reached upto 5.6 (Run No. 12 in Table 2). Similarly, at treatment time of 25 min, initial solution pH increases from 5 to 6.9 at 30
A/m2 current density (Run no.1 in Table 2). These increase in solution pH may also play a role in removal. The iron hydroxide is
produced in situ due to the dissociation of iron electrode during the electrocoagulation process. Several monomeric and polymeric
− −
species of iron having +ve, –ve and natural charges such as HFeO2(aq),Fe O2 , FeO(aq),Fe2+, Fe3+,FeOH+, FeOH2+, HFe O2 , FeO+,
+ + − − 4+ 5+
FeO, Fe2O3, Fe3O4, Fe(OH) 2 , Fe(OH)2, Fe(OH) 2 , Fe(OH) 3 , Fe(OH) 4 , Fe(OH)2, Fe(OH) 2 , Fe(OH) 2 ,FeOH2+ etc are formed
during electrocoagulation (Takeno 2005; Kobya et al., 2003). Further the iron hydroxide species, as stated above may convert into
amorphous Fe(OH)3(s) as per the complex precipitation kinetics (Lakshmanan et al., 2009).65 Varma et al./ International Journal of Engineering, Science and Technology, Vol. 13, No. 1, 2021, pp. 61-68
(a) (b)
(c)
Fig. 2. Effect of process variables on Y1, Y2 and Y3 response on (a) Initial pH, (b) Current density, (c) Treatment time.
These freshly formed amorphous Fe(OH)3 has minimum solubility, which results the formation of dense flocs, the dense flocs
having a large surface area that provide entrapment of colloidal lead particles and hence the removal of lead takes place, which is
known as sweep coagulation (Ghernaout and Ghernaout. 2012). Hence, at initial acidic and alkaline pH range, the elevation in
solution pH with time and entrapment of lead in flocs (sweep coagulation) are accountable for lead removal. At initial pH of 2, the
copper removal of around 83.93% found and it increase with increase in initial pH, total removal occur at pH of 5. These removals
can be explained on similar way as describe above for lead removal. In the aqueous solution, copper may exists in from of Cu2+,
Cu(OH)2 , Cu2O(s), CuO2(2-), HCuO2- (Takeno 2005). It is predominantly present in positive charge species up to pH of 9.5 and
above this pH it present in negative charge species. Similarly, iron is also presents in positive charge species in these range, hence,
chemisorption is less effective. Thus, sweep coagulation is also found accountable for high copper removal. Since, in the present
study consider only electrode loss and power used thus the effect of initial pH is negligible on cost of operation.
Current density plays an vital role in the removal of lead and copper through EC process as it decides the rate of in situ
coagulant generation (coagulant dose), which influences the removal efficiency. Current density is a measure of the amount of
current passed through unit cross section area of the electrode. As per Faraday law, loss in weight of material is proportional to
electricity passed in solution. It is clear that the increase in current density accelerate the liberation rate of iron coagulant, which
finally helps to accelerate removal of lead and copper, thus removal % of lead and copper increase with increase in current density.
It is observed from Fig.2 (b) that at current density of 10 A/m2, removal of lead and copper are obtained as 44.62% and 65.86%,
respectively under the above mention conditions. The lead and copper concentration in treated water are observed as 5.65 mg/l and
12.72 mg/l, respectively, which are above their respective permissible limits according to Indian standards (lead: 0.1 mg/l, copper:
3 mg/l) (Web link 3). Further, at current density of 50 A/m2, % removal of copper is found to be 99.75%, while, complete removal
of lead is found at same current density. The residual concentration of lead and copper are found as 0 mg/l and 0.1 mg/l,
respectively. With the increase in current density the operating cost of process also increases. It is ascertained from (Equation 5)
that the operating cost is the sum of cost of electrode consumption during the treatment and electricity that used in the treatment.
Therefore, as the current density increases the consumption of electrode dissolution as well as energy consumption also increases,
consequently, the operating cost of electrocoagulation process increase.
The percentage removal of lead and copper both raises with rise in treatment time. Removal of 34.6% lead is attained in first 5
min operation and it improves further and get completely removed in 45 min. It is also found that 82.97% of copper removal is
attained in first 5 min of process and then rises gradually with treatment time. In treatment time of 40 min it reaches to its
maximum removal of 99.75%. Quick removal of copper is found as compare to lead. The concentration of both lead and copper in66 Varma et al./ International Journal of Engineering, Science and Technology, Vol. 13, No. 1, 2021, pp. 61-68
treated water found below the discharge limit of waste water according to Indian standard (lead: 0.1mg/l, copper: 3mg/l) (Web link
3). The operating cost of process is also increases with the increase in treatment time as the operating cost is proportional to
treatment time (as per Equation 6). The sludge and scum produced during electrocoagulation process can also be sustainably
utilized by using solidification techniques (Thakur et al., 2019). For the better explanation response surface parametric interaction
for lead and copper removal as well as operating cost are shown in Fig. 3 (a), (b) & (c), respectively which shows that lead and
copper removals are responsive to variation of current density, pH and run time, respectively.
(a) (b)
(c)
Fig. 3. 3D surface plots of lead removal, copper removal and operating cost with pH and current density (A/m2) (a), pH and
current density (A/m2) (b), current density (A/m2) and treatment time (min) (c), respectively.
3.3 Process Optimization: The optimum values of initial pH, current density and treatment time for the removal of lead and copper
coupled with the operating cost are evaluated by the developed models obtained from the experimental data. The optimum values
are observed as initial pH: 5, current density: 50 A/m2 and treatment time: 40 min according to BBD design. Under this optimum
condition, removal of lead and copper are found as 102.81% and 99.75 %, respectively with an operating cost of 0.481 USD/m3 of
treated water at the desirability of 0.999. For the validation of model, the actual experiments were performed at these optimum
conditions determined by Design Expert software, which found in good agreement with the model predicted value (lead removal:
99.98 %, copper removal: 99.88%, operating cost: 0.476 USD/m3). Results revealed that lead and copper concentration in treated
water reaches below WHO drinking water norms 0.01mg/l and 0.05 mg/l, respectively.
4. Conclusions
In this study, simultaneous removal of lead and copper from synthetic wastewater through electrocoagulation was done in a
batch reactor, it is found that the three factors (initial pH, current density and treatment time) play an vital role for the removal of
lead and copper, The optimum conditions for simultaneous removal of lead and copper are observed as; initial pH: 5, current
density: 50 A/m2 and treatment time: 40 min. At these optimum conditions, removal of lead and copper are observed as 99.98%
and 99.88%, respectively with an operating cost of 0.476 USD/m3. Design Expert software is suitable for the prediction of lead and
copper removal coupled with operating cost for electrocoagulation process. The treated water comes under WHO and Indian
standard for drinking water as well as CPCB norms for discharge of heavy metal in environment with the initial lead and copper
concentration of 10 mg/l and 40 mg/l, respectively.67 Varma et al./ International Journal of Engineering, Science and Technology, Vol. 13, No. 1, 2021, pp. 61-68 References Adhoum N., Monser L., Bellakhal N. and Belgaied J.E. 2004. Treatment of electroplating wastewater containing Cu2+, Zn2+ and Cr (VI) by electrocoagulation. Journal of Hazardous Materials, Vol. 112, pp. 207–213. https://doi.org/10.1016/j.jhazmat.2004.04.018 Bailey S.E., Olin T.J., Bricka R.M. and Adrian D.D. 1999. A review of potentially low-cost sorbents for heavy metals. Water Research, Vol. 33, pp. 2469–2479. https://doi.org/10.1016/S0043-1354(98)00475-8 Bazrafshan E., Mahvi A.H. and Zazouli M.A. 2011. Removal of zinc and copper from aqueous solutions by electrocoagulation technology using iron electrodes. Asian Journal of Chemistry, Vol. 23, pp. 5506. Bhagawan D., Poodari S., Pothuraju T., Srinivasulu D., Shankaraiah G., Rani M.Y., Himabindu V. and Vidyavathi S. 2014. Effect of operational parameters on heavy metal removal by electrocoagulation. Environmental Science and Pollution Research, Vol. 21, pp.14166–14173. https://doi.org/10.1007/s11356-014-3331-8 Boujelben N., Bouzid J. and Elouear Z. 2009. Adsorption of nickel and copper onto natural iron oxide-coated sand from aqueous solutions: study in single and binary systems. Journal of Hazardous Materials, Vol. 163, pp. 376–382. https://doi.org/10.1016/j.jhazmat.2008.06.128. Can O.T., Kobya M., Demirbas E. and Bayramoglu M. 2006. Treatment of the textile wastewater by combined electrocoagulation. Chemosphere, Vol. 62, pp. 181–187. Ferreira S.C., Bruns R.E., Ferreira H.S., Matos G.D., David J.M., Brandao G.C., Silva E.P., Portugal L.A., Dos Reis P.S., Souza A.S. and Dos Santos W.N.L. 2007. Box-Behnken design: an alternative for the optimization of analytical methods. Analytica Chimica Acta, Vol. 597, pp. 179–186. https://doi.org/10.1016/j.aca.2007.07.011 Fu F. and Wang Q. 2011. Removal of heavy metal ions from wastewaters: a review. Journal of Environmental Management, vol. 92, pp. 407–418. Gatsios E., Hahladakis J.N. and Gidarakos E. 2015. Optimization of electrocoagulation (EC) process for the purification of a real industrial wastewater from toxic metals. Journal of Environmental Management, Vol. 154, pp.117–127. https://doi.org/10.1016/j.jenvman.2015.02.018. Ghernaout D. and Ghernaout B. 2012. Sweep flocculation as a second form of charge neutralization- A review. Desalination and Water Treatment, Vol. 44, pp. 15–28. https://doi.org/10.1080/19443994.2012.691699 Iqbal M. and Khera R.A. 2015. Adsorption of copper and lead in single and binary metal system onto Fumaria indica biomass. Chemistry International, vol. 1, pp. 157b–163b. Kobya M., Can O.T., and Bayramoglu M. 2003. Treatment of textile wastewaters by electrocoagulation using iron and aluminum electrodes. Journal of Hazardous Materials, Vol. 100, pp. 163–178. https://doi.org/10.1016/S0304-3894(03)00102-X Lakshmanan D., Clifford D.A. and Samanta G. 2009. Ferrous and ferric ion generation during iron electrocoagulation. Environmental Science & Technology, Vol. 43, pp. 3853–3859. https://doi.org/10.1021/es8036669 Mansoorian H.J., Mahvi A.H. and Jafari A.J. 2014. Removal of lead and zinc from battery industry wastewater using Electrocoagulation process: Influence of direct and alternating current by using iron and stainless steel rod electrodes. Separation and Purification Technology, Vol. 135, pp. 165–175. https://doi.org/10.1016/j.seppur.2014.08.012 Mohod C.V. and Dhote J. 2013. Review of heavy metals in drinking water and their effect on human health. International Journal of Innovative Research in Science, Engineering and Technology, Vol. 2, pp. 2992–2996. Rajput S., Pittman Jr C.U. and Mohan D. 2016. Magnetic magnetite (Fe3O4) nanoparticle synthesis and applications for lead (Pb2+) and chromium (Cr6+) removal from water. Journal of Colloid and Interface Science, vol. 468, pp. 334–346. https://doi.org/10.1016/j.jcis.2015.12.008 Takeno N. 2005. Atlas of Eh-pH diagrams. Geological survey of Japan open file report, Vol. 419, pp.102. Thakur L.S. and Mondal P. 2016. Techno-economic evaluation of simultaneous arsenic and fluoride removal from synthetic groundwater by electrocoagulation process: optimization through response surface methodology. Desalination and Water Treatment, Vol. 57, pp. 28847–28863. http://dx.doi.org/10.1080/19443994.2016.1186564 Thakur L.S., Goyal H. and Mondal P. 2019. Simultaneous removal of arsenic and fluoride from synthetic solution through continuous electrocoagulation: Operating cost and sludge utilization. Journal of Environmental Chemical Engineering, Vol. 7, pp. 102829. https://doi.org/10.1016/j.jece.2018.102829 Web link 1 (Available at https://www.indiamart.com/proddetail/ms-sheet-13220081688.html, access date: 13/09/2018). Web link 2 (Availableathttp://wss.mpcz.co.in/ShowProperty/UCMRepository/Contribution%20Folders/Ujjain/PDF/MPERCRegulations/Ta rrif%20order/Tariff_LT_HT_Year_17_18.pdf, accessdate: 13/09/2018) Web link 3 Indian Standard water specification 1986 (Available at https://cpcb.nic.in/uploads/GeneralStandards.pdf access date: 10/09/2018). Yetilmezsoy K., Demirel S. and Vanderbei R.J. 2009. Response surface modeling of Pb (II) removal from aqueous solution by Pistacia vera L.: Box–Behnken experimental design. Journal of Hazardous Materials, Vol. 171, pp. 551–562. https://doi.org/10.1016/j.jhazmat.2009.06.035
68           Varma et al./ International Journal of Engineering, Science and Technology, Vol. 13, No. 1, 2021, pp. 61-68

Biographical notes

A. K. Varma received M. Tech. and Ph.D. from Indian Institute of Technology Roorkee, India. He is working as an Assistant Professor in the Department of
Chemical Engineering, Assam Energy Institute (A centre of RGIPT, Jais, Amethi) Sivasagar, Assam, INDIA.

A. Chouhan is doing his M.Tech. degree from Department of Chemical Engineering Ujjain Engineering College Ujjain, Madhya Pradesh, INDIA.

R. Shankar received M. Tech. and Ph.D. from Indian Institute of Technology Roorkee, India. He is working as an Assistant Professor in the Department of
Chemical Engineering, Madan Mohan Malviya University of Technology, Gorakhpur, Uttar Pradesh, INDIA.

P. Mondal is a Professor in Department of Chemical Engineering, Indian Institute of Technology Roorkee, Roorkee, Uttarakhand, INDIA.

A.K. Rathore is an Associate Professor in the Department of Chemical Engineering, Harcourt Butler Technical University, Kanpur, Uttar Pradesh, INDIA.

L.S. Thakur is an Assistant Professor in the Department of Chemical Engineering Ujjain Engineering College Ujjain, Madhya Pradesh, INDIA.
You can also read


