SIGL: Securing Software Installations Through Deep Graph Learning
←
→
Page content transcription
If your browser does not render page correctly, please read the page content below
S IGL: Securing Software Installations Through Deep Graph Learning∗

                                               Xueyuan Han                Xiao Yu                Thomas Pasquier             Ding Li
                                             Harvard University   NEC Laboratories America     University of Bristol    Peking University
                                                      Junghwan Rhee             James Mickens                 Margo Seltzer
                                                 NEC Laboratories America     Harvard University     University of British Columbia
                                                                                  Haifeng Chen
arXiv:2008.11533v1 [cs.CR] 26 Aug 2020

                                                                            NEC Laboratories America

                                                                           Abstract                               as Google, Microsoft, and Samsung, before being detected
                                                                                                                  and removed [40].
                                         Many users implicitly assume that software can only be ex-                  Unfortunately, there are no strong defenses against ma-
                                         ploited after it is installed. However, recent supply-chain at-          licious installation. Fingerprint-based malware detection is
                                         tacks demonstrate that application integrity must be ensured             easy to evade by tweaking a few bytes of installation data [39].
                                         during installation itself. We introduce S IGL, a new tool for de-       Content-agnostic tools try to blacklist the untrusted servers
                                         tecting malicious behavior during software installation. S IGL           and web pages that host malicious software [8, 85]; however,
                                         collects traces of system call activity, building a data prove-          as the CCleaner attack demonstrates, corrupted supply chains
                                         nance graph that it analyzes using a novel autoencoder archi-            provide malicious content via trusted sources. More sophisti-
                                         tecture with a graph long short-term memory network (graph               cated detection algorithms assign dynamic reputation scores
                                         LSTM) for the encoder and a standard multilayer perceptron               to file servers [67, 73]. Unfortunately, properly calculating
                                         for the decoder. S IGL flags suspicious installations as well            reputation scores is difficult, requiring labeled malware sam-
                                         as the specific installation-time processes that are likely to           ples [73] or a priori knowledge about the characteristics of
                                         be malicious. Using a test corpus of 625 malicious installers            malicious files [67].
                                         containing real-world malware, we demonstrate that S IGL                    To improve detection accuracy, server reputation scoring
                                         has a detection accuracy of 96%, outperforming similar sys-              can be augmented with client-side anomaly detection. For
                                         tems from industry and academia by up to 87% in precision                example, data provenance frameworks observe causal inter-
                                         and recall and 45% in accuracy. We also demonstrate that                 actions between kernel-level objects, such as processes, files,
                                         S IGL can pinpoint the processes most likely to have triggered           and network sockets [10]. Malicious installers will manipulate
                                         malicious behavior, works on different audit platforms and op-           these objects in ways that are statistically unlikely (and thus
                                         erating systems, and is robust to training data contamination            detectable using statistical analysis). However, approaches us-
                                         and adversarial attack. It can be used with application-specific         ing data provenance [28, 49] are designed for long timescales
                                         models, even in the presence of new software versions, as well           and unpredictable exploit timings: a provenance log spans
                                         as application-agnostic meta-models that encompass a wide                weeks or months of system activity, with threats potentially
                                         range of applications and installers.                                    arriving at any moment during the logging period. To reduce
                                                                                                                  log sizes, provenance systems reduce high-fidelity event logs
                                                                                                                  to lower-fidelity summarizations, performing intrusion detec-
                                         1     Introduction                                                       tion on the summaries. Unfortunately, summarizations hurt
                                                                                                                  diagnostic ability; they omit important contextual informa-
                                         Software installation is risky. Installer programs often execute         tion about, for example, the specific processes that malware
                                         with administrative privileges, providing installation-time at-          launched, and the specific files that malware accessed. When
                                         tackers with powerful capabilities to immediately corrupt                they correctly detect an anomaly, reconstructing the low-level
                                         a system or establish longer-term persistent threats. Signed             details of how the attack unfolded requires manual work that is
                                         installation packages verify a package’s origin, but not its se-         difficult and error-prone, but critical for understanding which
                                         mantic integrity—installers can be corrupted before they are             attack vectors need to be patched.
                                         signed. Thus, as post-installation malware detection has be-                S IGL reduces the manual effort needed to (1) detect mali-
                                         come more sophisticated, corruption of digital supply chains             cious installations and (2) identify the malicious processes.
                                         increased by 78% in the one year from 2018 to 2019 [2]. For              We observe that once a malicious installation begins, a ma-
                                         example, CCleaner is a popular application for removing un-              chine typically exhibits anomalous behavior (§ 3). Thus, S IGL
                                         used files on desktop computers. In 2017, attackers breached             can afford to collect high-fidelity (but short-term) provenance
                                         several workstations belonging to CCleaner developers, insert-           graphs, discarding old ones if no malicious installations are
                                         ing bot software into the official CCleaner application. The             detected. S IGL analyzes provenance data using a novel form
                                         compromised installer was downloaded by 2.27 million users,              of unsupervised deep learning, which means that human ana-
                                         including employees from major technology companies such                 lysts do not have to label training sets with both benign and
                                                                                                                  malicious graphs. Instead, given a machine which is known to
                                             ∗ S IGL   is pronounced as “seagull”.                                be malware-free, S IGL automatically featurizes provenance

                                                                                                              1
graphs using a novel component-based embedding technique                                                                                                     AVRemover.exe
tailored for system graphs (§ 4.3). It then applies long short-                                                                  File Read File Read File Read File Read

term memory networks (LSTMs) [64] to extract the graph                                                                                           AVRemover.exe

features corresponding to normal behavior. These features do                                                                                      File Write File Read               File Write

not rely on any particular malware; therefore, they are general                                                                  Process Start       taskhost.exe           Process Start         AVRemover.exe

                                                                                                                                                                                                                File Read
                                                                                                                                                                                                                               cabinet.dll

                                                                                                                                                                                                                              File Read      File Read
and robust against malicious behavior. When deployed on                                                                          taskhost.exe                                                              AVRemover.exe

in-the-wild machines, S IGL uses anomaly scores (§ 4.5) to                                                                         IP Write IP Read                                                                         File Write

calculate how far a machine deviates from the baseline fea-                                                                            x.y.z.s:t                                                    Process Start        AVRemover.exe

tures (and thus how likely it is that a machine is experiencing
                                                                                                                                                                                             AVRemover.exe
a malicious installation).                                                                                                                                                                                File Write                 File Read

    We evaluate S IGL by collecting baseline data from an en-                                                                                                                     Process Start      AVRemover.exe

terprise database storing system events from 141 machines                                                                                        File Read File Read File Read

at NEC Labs America. Using malicious installers from the                                                           IP Write
                                                                                                                                                                  AVRemover.exe

                                                                                                                              IP Read File Write File Read File Write File Read        File Write File Read     File Write File Read      File Write File Read
wild (as well as ones that we created ourselves), we tested
                                                                           sensAPI.dll         Process Start      a.b.c.d:e              libwaheap.dll              eset.dat           libwautils.dll               exclusions.txt            AVRSrv.exe
S IGL’s ability to detect malicious installation activity. S IGL
                                                                                   File Read                                                                   File Read File Read    File Read         File Read
achieved precision, recall, accuracy, and F-score values all                                                                                                     AVRSrv.exe

greater than 0.94; in contrast, competing systems that we                                                  File Write   File Read File Write      File Read File Write File Read IP Write      IP Read File Write       File Write        File Write

tested were unable to achieve better than 0.9 on more than                                                                                                                       m.n.i,j:k            rm.exe             libwaheap.dll             libwautils.dll

a single metric, producing substantially worse scores on the
remaining metrics (§ 5.4). We also found that S IGL’s ranking           Figure 1: The software installation graph from the attack scenario described
                                                                        in § 2. The shaded area shows malicious activities not observed in a legitimate
system typically produces a small set of candidate processes            installation. We omit some edges, nodes, and node labels for clarity.
responsible for the attack, including the one actually respon-
sible (§ 5.5). To demonstrate the applicability and robustness
of our approach, we further evaluate S IGL on different plat-
forms (i.e., Windows and Linux) and with various adversarial            virus remover, ESET AV Remover, creating a new version of
scenarios (e.g., data contamination and evasion).                       the software package. The attackers then launch a phishing
In summary, we make the following contributions:                        attack, impersonating Microsoft, urging enterprise employ-
• We formalize the problem of detecting malicious soft-                 ees to upgrade their anti-virus tool. When an unsuspecting
   ware installation. In particular, we introduce a new kind of         employee runs the installer, Dharma runs in the background,
   provenance graph, called a software installation graph, that         encrypting user files, while the employee interacts with the
   records the short-term (but high-fidelity) provenance infor-         ESET AV Remover installer 1 . Neither existing malware de-
   mation needed to capture malicious installation activity.            tection tools nor newer log- or provenance-based analysis
• We are the first to apply deep graph learning to the auto-            systems are a good match for these kinds of attacks for the
   matic detection of anomalies in software installation graphs         following reasons.
   (SIGs). Our approach uses a novel autoencoder architecture           Limitations of Malware Detection Tools. The Dharma sce-
   layered atop a long short-term memory network.                       nario poses several challenges to existing malware detec-
• We present a novel node featurization model for system-               tion solutions. First, customized variants of Dharma will ef-
   level provenance entities that is generalizable to applica-          fectively evade signature-based malware analysis, including
   tions beyond our current project.                                    commercial anti-virus detection [48]. In fact, many variants
• We build and thoroughly evaluate S IGL, an unsupervised de-           of ransomware families, including Dharma, leverage popular
   tection system, that identifies malicious installations. S IGL       installation frameworks (§ 5.1) to circumvent anti-virus de-
   creates SIGs using information provided by lightweight               tection without even changing the malware signature [16]. A
   audit frameworks such as Windows ETW or Linux Audit.                 recent incident demonstrates that, similar to our motivating
   Thus, S IGL requires no additional infrastructure on end             scenario, malware can safely hide in those installation frame-
   hosts, besides a daemon that collects audit data and sends it        works, bypassing all anti-virus products on VirusTotal [69].
   to a centralized analysis machine. S IGL outperforms current         Second, bundling malicious software with legitimate software
   state-of-the-art malware detectors, while also providing the         thwarts conventional file reputation analysis [67, 73].
   unique ability to identify the set of processes potentially             Downloader graph analysis [46] or malware distribution
   involved in malicious installation activity.                         infrastructure analysis [8] might have proven effective in this
• To the best of our knowledge, we are the first to investigate         instance if it were possible to notice the suspicious origin
   graph-based adversarial attacks [80, 88] given realistic and         of the bundled installer. However, if the attackers infiltrated
   practical systems constraints faced by the attackers.                trusted software vendors to distribute the compromised soft-
                                                                        ware package [15] (as in the recent CCleaner incident), then,
                                                                        even those approaches would have been rendered ineffective
2   Background & Motivation                                             [8, 85].
                                                                           In summary, these types of exploits can successfully evade
We simulate the following real-world enterprise attack sce-             detection from existing solutions.
nario [53] to illustrate the limitations of existing tools and          Limitations of Log and Provenance Analysis Solutions.
motivate S IGL’s design. Our scenario uses the Dharma ran-              Today’s enterprises are rich in commercial threat detection
somware, also known as CrySIS, which has become increas-                tools and log data; however, as we show in § 5.3, the log-based
ingly prevalent in enterprises [4]. One important factor that           commercial TDS [61] deployed in our enterprise produces a
contributes to its popularity is its continuous evolution to            large number of false positive alarms, because it is strict in
avoid detection. We simulate a recent Dharma variant where
the adversary bundles the ransomware tool with a benign anti-              1 We      evaluate S IGL in this scenario in § 5.

                                                                    2
matching predefined, single-event signatures (e.g., a process
should not write to an unknown file). Newer research proto-
types use provenance for intrusion detection [28, 29, 49, 63],
which provides more contextual analysis, but these systems
value time and space efficiency over fine-grain learning preci-
sion. As such, they tend to over-generalize statistical graph
features with constrained graph exploration. For example,
Fig. 1 depicts the graph structure surrounding the malicious
process (taskhost.exe). Rectangles, ovals, and diamonds
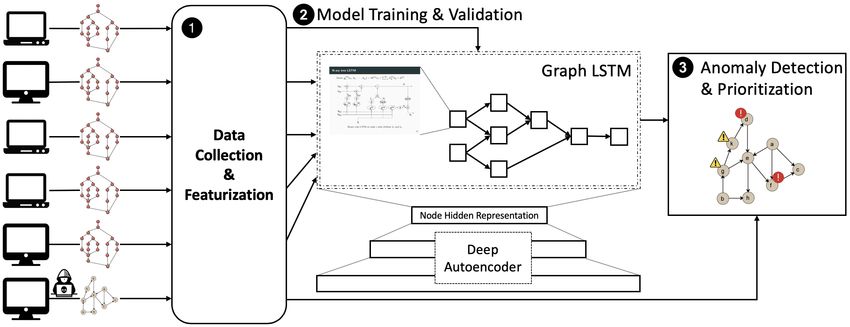
represent processes, files, and sockets, respectively; edges rep- Figure 2: S IGL collects existing audit data from enterprise workstations and
constructs software installation graphs to train a deep autoencoder using a
resent relationships between these objects. The shaded area graph LSTM as its encoder. The resulting model is used to detect anomalous
represents the malicious activity that does not exist in normal test graphs and rank nodes within the graph based on their anomaly scores.
ESET AV Remover installations. These malicious activities
comprise only a small portion of the entire graph, essentially
hiding among the greater number of normal events that take anomalous behavior.
place during benign installation. Notice that the graph struc- We assume that the attacker’s attempt to infiltrate an enter-
ture surrounding the malicious process (taskhost.exe) is prise network through malicious software installation is the
similar to that around the benign AVRemover.exe, both of initial system breach. The attacker may distribute malicious
which start a new process and communicate with an outside installers using phishing emails, through legitimate software
IP address. Existing IDS cannot distinguish these similar distribution channels (i.e., by compromising the integrity of
structures, because those systems use localized graph anal- such channels or acting as a man-in-the-middle), or by direct
ysis (e.g., 1-hop neighborhoods) that limits their ability to access to the network (i.e., an insider attack).
explore more distant relationships that provide a richer pic- S IGL’s threat model assumes the integrity of the under-
ture of host behavior. Thus, they produce a large number of lying OS and audit framework, as is standard for existing
false alarms. Even when the alarms are real, it is difficult provenance-based systems [28, 63, 66]. We further assume the
to pinpoint the cause of an alarm, because existing systems integrity of provenance records, which can be guaranteed by
summarize features, thereby losing details. using existing secure provenance systems [31, 62].
These existing systems make rational tradeoffs, because
their goal is whole-system realtime detection over a long
time period. Consequently, they must handle large and fast- 4 S IGL Framework
growing provenance graphs. In contrast, S IGL focuses on
the detection of malicious installation and thus requires a We begin with an overview of S IGL’s architecture and then
different set of trade-offs. present the technical details of each major component.
S IGL Insight. The key insight behind S IGL is that software
installation is generally a well-defined, multi-staged process
that can be represented as a bounded, static graph. The 4.1 System Overview
bounded nature of the graph means that we can analyze the
graph in its entirety rather than having to summarize it. The S IGL uses abnormal system behavior to detect installation of
multiple stages of installation suggest that we use models that malicious software. Its operation consists of three stages: 1
are inherently temporal. S IGL learns both the structure and se- data collection & featurization, 2 model training & validation,
quencing of installation without manual feature engineering. and 3 anomaly detection & prioritization. Fig. 2 illustrates
S IGL’s architecture and workflow.
1 Data Collection & Featurization. For each software in-
3 Problem Formulation and Threat Model stallation considered, S IGL gathers audit logs from a col-
lection of machines in the enterprise and transforms each
machine’s audit logs into a graphical representation called a
We formalize the software installation malware detection software installation graph (SIG, § 4.2). It then divides the
problem as a graph-based outlier detection problem. Software complete set of graphs (G) into training (GT ) and validation
installation begins when installer execution begins, e.g., the (GV ) sets, with approximately 80% in the training set and 20%
user double clicks on the downloaded package; it terminates in the validation set. Thus, G represents a benign software
when the installer process and all its descendants exit. installation graph for a particular install. S IGL then learns two
We characterize the installation behavior of a software node embedding models (§ 4.3) from GT .
package as a chain of system events leading to its binary files 2 Model Training & Validation. Given the features learned
being written to a host system. We then define a software in 1 , S IGL trains a deep graph learning model (§ 4.4), which
installation graph G = (V, E), an attributed directed acyclic is a deep autoencoder with a graph LSTM component as
graph (DAG), to represent this event chain. Nodes V represent its encoder and a multilayer perceptron as its decoder. The
system subjects (i.e., processes) and objects (e.g., files, sock- autoencoder learns to reconstruct normal process nodes in
ets), and edges E record interactions between them. Given a G ∈ GT from their latent representations encoded by the graph
number of benign installations L = {G (s1 ) , G (s2 ) , . . . , G (s j ) } LSTM, minimizing reconstruction errors. S IGL then uses the
on endpoint systems s1 , s2 , . . . , s j , our goal is to learn a model validation data GV to verify the performance of the learned
M of the installation behavior that classifies a new instal- model and, using the reconstruction errors, determine the
lation graph G (sk ) , k 6∈ {1, 2, . . . , j} as benign or malicious. threshold for anomaly detection.
Given an abnormal graph G , we also want to rank process 3 Anomaly Detection & Prioritization. Given a trained
nodes Vp ⊂ V to identify which processes exhibit the most model and threshold (§ 4.5), S IGL takes audit logs from a new
3Subject Object Event Relationship
process start; end
A good embedding approach for system-level prove-
process file rename; read; write; execute; delete nance nodes must satisfy two important properties. First,
socket send; receive given a system entity that plays a particular role in a sys-
Table 1: System entities and dependency relationships. tem, its embedding must be close to that of other entities
if and only if their roles are similar. For example, both
system DLLs c:\windows\system32\ntdll.dll and c:
software installation, generates its corresponding SIG, embeds \windows\system32\kernel32.dll contain kernel func-
its nodes using the trained node embedding models, and uses tions. Their embeddings should be close to each other in
the autoencoder model to reconstruct all process nodes. The the embedding space to facilitate downstream graph learning
resulting reconstruction losses are the anomaly scores for each that captures behavioral similarity of processes loading and
node. If the overall anomaly score exceeds the threshold, S IGL executing these two DLLs.
classifies the installation as abnormal and reports a list, sorted Second, the embedding approach must generalize to sys-
by anomaly score, of the most suspicious processes. System tem entities not in the training dataset. Such entities are espe-
administrators can analyze process behavior through the SIG, cially common in software installation, because the installa-
prioritizing the ones with the highest anomaly scores. tion almost always introduces temporary files and processes
that have semi-random path names. Mishandling such enti-
ties (e.g., assigning random embeddings) would cause down-
4.2 Software Installation Graphs stream graph learning to produce excessive false positives for
lack of meaningful features.
Similar to prior systems [23, 32], S IGL builds SIGs using We satisfy both of these properties by featurizing SIG
common logging frameworks (e.g., Windows ETW and Linux nodes in an embedding space such that node embeddings
Audit) based on standard provenance models [79]. S IGL trans- encode semantic meanings of the system entities they repre-
forms each audit log event into an edge, whose source rep- sent, while effectively leveraging the classic word2vec [57]
resents the subject of the event (i.e., the entity responsible learning model. To the best of our knowledge, we are the
for creating the log record) and whose destination represents first to use a neural-network-based approach to meaningfully
the object being acted upon (e.g., files, socket connections). featurize system-level provenance nodes.
The edge itself represents a dependency relationship between Node Embedding in S IGL. In NLP, word2vec embeds words
these entities. Table 1 shows the dependency relationships into a low-dimensional continuous vector space, where words
that we consider in our work. with similar context map closely together. Given a sequence
S IGL produces the SIG by backtracking [44] from the in- of words, word2vec employs a skip-gram model whose ob-
stalled software executable(s), represented as file node(s). jective is to maximize the log probability of predicting the
Given a file node, S IGL adds all edges having that node as context around a given target word. A fixed size sliding win-
their destination. It then recursively repeats this procedure dow on the text sequence determines the context. Assuming
for each newly added node, backtracking to the download the likelihood of observing each context word is independent
given the target word, word2vec maximizes:
of the installation package. The resulting graph includes all
processes involved in the installation as well as any e.g., T T
dynamically linked libraries (DLL) that were executed. We max ∑ logP(wt−C , ..., wt+C |wt ) = max ∑ logP(wt+c |wt )
apply an adjustable time bound on how far back we track ∑
t=1 t=1 −C≤c≤C
generic system services (represented as process nodes) that
are commonly invoked during software installation, thereby P(wt+c |wt ) is defined by a softmax function: P(wt+c |wt ) =
minimizing dependency explosion [47]. If the installation exp(wt+c ·wt )
produced more than one installed executable, we combine the V exp(w ·w ) where C is the window size, wt+c and wt are
∑i=1 i t
backtraces into a single SIG. As is done in existing prove- the embeddings of the context word wt+c and the target word
nance based analysis work [58, 62, 63], we produce acyclic wt , and V is the vocabulary size.
SIGs by creating multiple node versions as the state of the We apply word2vec as a basis for our embedding ap-
corresponding subject/object changes [60]. proach to featurize path names associated with SIG nodes.
Each node in a SIG, whether file, process, or socket, corre-
sponds to a file system path name. These path names en-
4.3 Node Embedding for System Entities code important semantic relationships. Using the same ex-
Machine learning tasks depend on having a set of informative, ample from earlier, c:\windows\system32\ntdll.dll and
discriminative, and independent features [25]. Thus, node c:\windows\system32\kernel32.dll reside in the same
featurization is an important building block in graph represen- directory, because they both contain kernel functions.
tation learning. To map semantically related nodes close in the embedding
Popular network representation learning frameworks, such space, we use a component-based node embedding model,
where S IGL learns the embedding of each component of a
as node2vec [25], DeepWalk [65], and metapath2vec [18], path and then follows an additive method [35] to embed a
apply natural language processing (NLP) techniques, most no- node as the normalized summation of its path components.
tably word2vec [57], to derive latent embeddings that capture S IGL performs directed random walks of fixed length l to
contextual information encoded in the networks. However, construct the causal context for each node: Given a source
these approaches are not designed in the context of repre- node c0 in the SIG, S IGL traverses the graph following the
senting system entities; in particular, their node features do direction of the edges. If a node has more than one outgoing
not encode relationships between system entities and their edge, S IGL randomly picks an edge to continue the walk. Let
functionality within the system, which are important for down- ci denote the ith node in the walk. The causal context C for
stream graph learning and anomaly detection. c0 is {ci |i = 1, . . . , l}, where ci is generated by the following
4distribution:
1
N if (u, v) ∈ E
P(ci = v|ci−1 = u) =
0 otherwise
where N is the number of outgoing edges from ci−1 . S IGL
generates multiple causal contexts (i.e., multiple walks) for
each node.
Unlike existing embedding frameworks [18, 25, 65], our
approach does not consider each node label as an atomic
individual whose meaning can be derived only from neighbor-
ing nodes through random walks along the network; instead,
each path component essentially becomes part of the context. Figure 3: S IGL’s autoencoder architecture.
If we treat the pathname as a single attribute, such context
information is lost in the resulting embedding.
Embedding Unseen Nodes. The approach described so far The standard LSTM architecture learns sequential informa-
produces embeddings for only those nodes that have been tion propagation only; tree-structured LSTMs [75] and the
observed in the training graphs (GT ). As mentioned above, more general graph LSTMs [64] are two natural extensions
software installation often creates temporary folders with that incorporate richer network topologies. Graph LSTMs
meaningless base path names, sometimes containing machine- allow for flexible graph structures (e.g., DAGs) and consider
specific variations. In these cases, S IGL uses the à la carte distinct edge types. As in standard LSTMs, each graph LSTM
embedding model [42], which follows the distributional hy- unit j contains input and output gates i j and o j , a memory
pothesis [30] to efficiently infer the embeddings for out-of- cell c j , and the hidden state h j . A graph LSTM unit might
vocabulary (OOV) words via a linear transformation of ad- have multiple child units C( j). For each child unit k, there is a
ditive context embedding (i.e., the average embeddings of forget gate f jk and a type-specific weight matrix U e jk , where
context words). Given the contexts Cw of a word w in a vocab-
ulary and assuming a fixed context window size |c|, a linear e jk denotes the edge type that connects j and k. Given the
transformation is learned through input vector for unit j, the transition equations are [64]:
1 e
vw ≈ Avadditive = A( vw0 ) i j = σ(Wi x j + ∑ Ui jk hk + bi )
w ∑ ∑
|Cw | c∈C 0 k∈C( j)
w w ∈c
e
o j = σ(Wo x j + ∑ Uo jk hk + bo )
where vw are existing high-quality word embeddings. After k∈C( j)
learning the matrix A, any OOV word f can be embedded in e
the same semantic space by c˜j = tanh(Wc x j + ∑ Uc jk hk + bc )
k∈C( j)
1 e jk
v f = Avadditive
f = A( ∑ ∑ vw ) f jk = σ(W f x j +U f hk + b f )
|C f | c∈C f w∈c
cj = ij c˜j + ∑ f jk ck
à la carte complements the component-based embedding k∈C( j)
approach, because it uses the same context-aware and additive hj = oj tanh(c j )
mechanism. Thus, we produce meaningful embeddings using
both random walks and pathname components. For example, where x j is the input feature vector, W ’s are the input weight
given an unseen DLL c:\windows\system32\wow64.dll, matrices, b’s are the bias vectors, σ is the sigmoid func-
our component-based approach allows à la carte to take into tion, tanh is the hyperbolic tangent function, and is the
consideration its parent directories (which are the same as Hadamard product.
those learned for the ntdll.dll and kernel32.dll nodes), S IGL’s Autoencoder. Intuitively, S IGL’s autoencoder mod-
in addition to any random walks that pass through the node. els process nodes as a function of those nodes that came
S IGL trains the à la carte model using GT and uses the before them (temporally) in the SIG. The intuition underlying
trained model to featurize unseen nodes in the validation this encoder-decoder architecture (i.e., autoencoder) is that
graphs GV and during live deployment. anomalous nodes are inherently difficult to be represented
accurately in the embedding space, so trying to reconstruct
4.4 Deep Graph Learning on SIGs them produces much larger reconstruction losses. S IGL uses
those losses to distinguish abnormal installations from normal
S IGL uses an autoencoder (Fig. 3) to learn a robust representa- ones (§ 4.5).
tion of the process nodes in a SIG for both anomaly detection Although an alternative solution would be to use a binary
and prioritization. The autoencoder consists of two parts: an classifier to determine if a SIG represents a normal installation
encoder, for which we use a graph long short-term memory or not, training such a classifier would require more labeled
network (graph LSTM), and a decoder, for which we use a data (both normal and anomalous SIGs) than can easily be
multilayer perceptron (MLP). collected [5]. A set of SIGs dominated by normal installations
Graph LSTM. An LSTM [33] captures long-term depen- produces class imbalance, and imbalanced two-class training
dencies of linear sequences. Originally developed for NLP often results in poor model performance [83]. Additionally,
tasks, LSTMs have been successfully adapted to a variety as an attacker’s modus operandi changes over time, keeping
of sequence modeling and prediction tasks, such as program the trained classifier up-to-date becomes impractical [71].
execution [87] and attack prediction [71]. Binary classification also provides no insight on the cause of
5the attack. A system administrator would have to manually Algorithm 1: Normality Threshold
compare a problematic SIG to one or more known good SIGs Input :Validation graph set GV
to identify potentially malicious processes. Output :Normality threshold T
Variables :thresholdList ← list of largest average losses from GV
S IGL’s autoencoder addresses limitations of binary classifi- 1 thresholdList ← []
cation through unsupervised one-class learning that requires 2 for G ∈ GV do
3 nodeLosses = GraphAutoEncoder(G )
only normal SIGs. It jointly trains the graph LSTM, as the 4 largestAverageLoss = JenksMaxZoneAvg(nodeLosses)
encoder, with a MLP as the decoder. As illustrated in Fig. 3, 5 thresholdList.append(largestAverageLoss)
the encoder learns the hidden representation of each process 6 std ← standardDeviation(thresholdList)
7 mean ← mean(thresholdList)
node through the graph LSTM, taking into account the node’s 8 T ← mean + 3 * std
attributes (i.e., feature embedding) and the hidden representa- 9 return T
tions of all its source nodes (i.e., temporality) distinguished by 10 Func JenksMaxZoneAvg(nodeLosses):
the connection types (i.e., heterogeneity). The decoder then 11 zone1 , zone2 , . . . = JenksNaturalBreaks(nodeLosses)
12 return max(mean(zone1 ), mean(zone2 ), . . . )
learns to reconstruct the original node embedding from the
hidden representation (h j ). The objective is to minimize the
Software Installer Version Installation Framework #T #V # BT #M
reconstruction loss in the training dataset GT , which consists FireFox N 18.1.0 Mozilla Installer 86 12 24 20
of only normal SIGs (i.e., unsupervised learning). FileZilla N 3.35.1 Nullsoft Scriptable Install System 88 12 24 40
PWSafe 3.48.0 Nullsoft Scriptable Install System 88 12 24 40
MP3Gain 1.2.5 Nullsoft Scriptable Install System 88 11 23 40
ShotCut 18.12.23 Nullsoft Scriptable Install System 85 12 24 40
TeamViewer N 14.4.2669 Nullsoft Scriptable Install System 84 12 24 40
4.5 Anomaly Detection Foobar
7Zip
1.4.6
18.5.0
Nullsoft Scriptable Install System
SFX
85
88
12
12
24
24
40
40
TurboVNC 2.1.2 Inno Setup 88 12 24 40
WinMerge 2.14.0 Inno Setup 85 11 23 40
The autoencoder’s neural network architecture learns to recon- Launchy 2.5 Inno Setup 151 21 42 40
Skype N 8.50.0 Inno Setup 80 11 22 40
struct process nodes. Nodes that show significant topological WinRAR 5.71.0 SFX 84 12 24 20
difference from those encountered during training correspond DropBox N 79.4.143 DropBox Installer 84 11 23 20
Slack N 4.0.1 NuGet Package 84 12 24 20
to unexpected changes in installation behavior, which signals Flash N 32.0.0.223 Flash Installer 84 12 24 20
OneDrive N 19.103.527 SFX 84 12 24 20
malware activity and will lead to large reconstruction errors. NotePad++
ICBC Anti-Phishing
7.7.1
1.0.8
NotePad Installer
ICBC Installer
85
85
11
11
23
23
20
20
S IGL is a deviation-based anomaly detection system [3], in ESET AV Remover F 1.4.1 ESET Installer 75 10 21 20
that it treats process nodes with high reconstruction loss as T: Training V: Validation BT: Benign Test M: Malicious Installer
anomalies. By ranking process nodes in a SIG by their re- Table 2: Software installers used in the experiments. Popular software instal-
lations in the enterprise are marked with N. The software discussed in § 2 is
construction losses (i.e., anomaly scores), S IGL helps system marked with F. Note that malicious installers are included only in the test
administrators prioritize analysis of anomalous nodes and dataset.
quickly eliminate false alarms.
S IGL determines a normality threshold from the reconstruc-
tion losses observed during validation. We typically observe administrators with a list of its process nodes sorted by their
that a small number of process nodes (e.g., those with a large anomaly scores.
number of descendants) are inherently much more difficult to
reconstruct than the rest of the process nodes in a SIG. These
nodes have orders of magnitude higher reconstruction losses. 5 Evaluation
If we arrange the losses in descending order, we observe “nat-
ural breaks” that partition nodes into ranges. The losses in the We present a number of experiments to evaluate S IGL as a
first range, i.e., the ones with the largest values, represent the behavior-based malware detection system for secure software
“limits” of S IGL’s representational capability, thus providing installation on enterprise end-point systems and an experimen-
us with a reasonable baseline to determine the threshold of tal testbed. In particular, we focus on the following research
normal software installation. questions:
S IGL uses Jenks’ natural breaks [37], a statistical map- Q1. What is the performance of S IGL in detecting malicious
ping method, to systematically discover class intervals of the software installation, and how does it compare to existing
natural breaks in the data series (i.e., reconstruction losses). commercial TDS and other anomaly-based detection systems
Jenks’ natural breaks is an iterative optimization method that that leverage data provenance? (§ 5.3, § 5.4)
minimizes intra-class variance while maximizing inter-class Q2. Can S IGL effectively guide cyber-analysts to quickly
variance by moving one value from the class with the largest identify abnormal processes and potential malware? (§ 5.5)
deviations from the mean to the class with the lowest until the Q3. Can S IGL be realistically used in an enterprise setting?
sum of the intra-class deviations reaches its minimum [38]. (§ 5.6, § 5.7, § 5.8, § 5.10, § 5.11)
Using Jenks’ natural breaks, which separates reconstruc- Q4. How robust is S IGL against adversarial attackers? (§ 5.9)
tion losses of a SIG’s process nodes into multiple “zones”, Q5. Can S IGL generalize to a large variety of software pack-
S IGL identifies the zone with the largest average loss for each ages and different platforms? (§ 5.12)
validation graph and constructs a threshold list that contains
those average losses for all the validation graphs. The nor- 5.1 Datasets
mality threshold in our experiments (§ 5) is set to be three
standard deviations above the average value of the threshold We describe our methodology to collect audit data from be-
list. However, system administrators can easily adjust this nign and malware-infected software installations from all the
threshold according to their needs (e.g., to optimize towards workstations at NEC Labs America using Windows ETW. We
a low false positive/negative rate). Alg. 1 shows the pseu- also generated additional datasets on our Linux testbed us-
docode for setting the threshold. ing Linux Audit. All experiments related to the testbed are
Given the normality threshold, S IGL considers any SIG discussed in § 5.12, while other sections focus on real-world
exceeding this threshold as abnormal and provides system Windows logs from the enterprise.
6Installer Name Malware Signature (MD5) Malware Type Malware Family
TeamViewer a2fd7c92f1fb8172095d8864471e622a Win32/Agent Trojan Inno Setup (631)
TeamViewer a538439e6406780b30d77219f86eb9fc Win32/Skeeyah.A!rfn Trojan
ESET AV Remover F d35fa59ce558fe08955ce0e807ce07d0 Win32/Wadhrama.A!rsm Ransomware
Flash ab6cef787f061097cd73925d6663fcd7 Win32/Banload TrojanDownloader Other (171)
Flash 7092d2964964ec02188ecf9f07aefc88 Win32/Rabased HackTool
Flash 5a9e6257062d8fd09bc1612cd995b797 Win32/Offerbox PUA 51.0% 13.8%
Table 3: Malicious installers found in the wild. The malware discussed in § 2
is marked with F. 11.4%
23.8% SFX (141)
Malware Signature (MD5) Malware Type Malware Family
03d7a5332fb1be79f189f94747a1720f Win32/VBInject.AHB!bit VirTool
02c7c46140a30862a7f2f7e91fd976dd Win32/VBInject.ACM!bit VirTool
1243e2d61686e7685d777fb4032f006a Win32/CeeInject.ANO!bit VirTool Nullsoft (294)
056a5a6d7e5aa9b6c021595f1d4a5cb0 Win32/Prepscram SoftwareBundler Figure 4: Popularity of installation frameworks for Windows applications.
0f0b11f5e86117817b3cfa8b48ef2dcd Win32/Prepscram SoftwareBundler Other frameworks include UPX, InstallShield, PEncrypt, CreateInstall, etc..
c649ac255d97bd93eccbbfed3137fbb8 Win32/Unwaders.C!ml SoftwareBundler
02a06ad99405cb3a5586bd79fbed30f7 Win32/Fareit.AD!MTB PasswordStealer
1537083e437dde16eadd7abdf33e2751 Win32/Fareit.AD!MTB PasswordStealer Method Precision Recall Accuracy F-Score FP Percentage
01abfaac5005f421f38aeb81d109cff1 Win32/Primarypass.A PasswordStealer
c622e1a51a1621b28e0c77548235957b Win32/Fareit!rfn PasswordStealer S IGL 0.94 0.99 0.96 0.96 0.06
04e8ce374c5f7f338bd4b0b851d0c056 Win32/DownloadGuide PUA Commercial TDS [61] 0.07 0.59 0.90 0.12 0.93
c62ced3cb11c6b4c92c7438098a5b315 Win32/Puwaders.A!ml PUA StreamSpot [49] 0.97 0.52 0.72 0.68 0.03
73717d5d401a832806f8e07919237702 Win32/KuaiZip PUA Frappuccino [28] 0.95 0.12 0.51 0.21 0.05
05339521a09cef5470d2a938186a68e7 Win32/Adload TrojanDownloader Table 5: Overall S IGL experimental results compared to other approaches.
0e8cce9f5f2ca9c3e33810a2afbbb380 Win32/Gandcrab.E!MTB Ransomware
0f030516266f9f0d731c2e06704aa5d3 MSIL/Boilod.C!bit HackTool
0ed7544964d66dc0de3db3e364953346 Win32/Emotet.A!sms Trojan
c60947549042072745c954f185c5efd5 Win32/Delpem.A Trojan
02346c8774c1cab9e3ab420a6f5c8424 Win32/Occamy.C!MTB Trojan popular software installers. Fig. 4 shows the market share of
0314a6da893cd0dcb20e3b46ba62d727 Win32/Occamy.B!bit Trojan
Table 4: Real malware used in the experiments to create malicious installers. those frameworks based on our survey of 1,237 Windows
applications hosted on Softpedia.
Benign Data. We collected benign data from the enterprise 5.2 Implementation & Experimental Setup
event database where system administrators store and monitor
company-wide system activity. We constructed software in- We implement S IGL’s data collection and graph generation
stallation graphs (§ 4.2) for popular software in the enterprise. module in Java 8 so that we can use the existing audit event
Software versions are consistent across different machines. server deployed in our enterprise, which provides APIs only in
Administrators carefully monitor installations to ensure their Java. S IGL’s core analytic algorithms, including node embed-
authenticity. We installed additional legitimate and popular ding, modeling, and anomaly detection, are implemented in
software packages in the market [20] to increase the size of Python 3.5 and PyTorch 1.1.0 with CUDA 9.0 toolkit. Specifi-
our dataset. We also included benign versions of malicious cally, we use the Gensim [68] library to generate node embed-
installers found in the wild (Table 3). Table 2 shows the com- dings for training graphs and Deep Graph Library (DGL) [1]
plete list of software installers used in our evaluation. to implement deep graph neural networks on top of PyTorch.
Malware Data. We collected malware data from malicious For all experiments, we partition the benign input data
installers discovered in the wild (Table 3). We also created into a training set (70%), a validation set (10%), and a false
more than 600 malicious installers by combining benign soft- positive test set (20%). Table 2 shows the exact number of
ware installers in Table 2 with real malware from VirusShare. software installation graphs used for training, validation, and
Table 4 lists the malware samples we used in our evaluation. testing for each experiment.
We randomly selected malware samples from a wide range of We parameterize the node context for node embedding
malware families that exhibit diverse behavior. For example, with window size 5, 10 random walks, each of length 10,
trojan attacks and ransomware typically communicate with a and 128 dimensions. The same window size is used in à la
remote server, while malware of the PUA family downloads carte. We use the skip-gram training algorithm with negative
and installs potentially unwanted applications. sampling [26] and run 20 epochs over the corpus.
We investigated past real-world security incidents (e.g., [41, S IGL performs unsupervised learning; therefore, we need
53, 54]) that involve malicious installers as the entry point to only benign installers during training. We train S IGL’s deep
high profile attacks and observed two general approaches to graph neural network on a system with a NVIDIA GTX 1080
designing malicious installers: Ti graphics card with 12 GiB GPU memory. We train the
Bundle malware with legitimate installers. The attackers cre- model for 100 epochs with the training batch size set to 25,
ate a “wrapper installer” that simultaneously runs an unmod- validate model performance after every epoch, and choose the
ified benign installer in the foreground and malware in the model that produces the best performance on validation data.
background. We bundle each legitimate installer with every
malware sample in Table 4 to create malicious installers. 5.3 S IGL Experimental Results
Embed malware in legitimate installers. The attackers modify
an existing benign installer and embed malware in the installer. We evaluate S IGL’s detection performance on 625 malicious
The installer executes the malware during the installation installers across a variety of software packages (Table 2).
process. This approach requires us to decompile existing Table 5 shows that S IGL achieves over 90% precision, recall,
installers and recompile them with malware. accuracy, and F-score in identifying abnormal installation
To make our malicious installers representative, we select behavior. It correctly identified all malicious installers found
software (Table 2) using three popular installation frame- in the wild. In § 6, we discuss two attack cases from Table 3 to
works: Nullsoft Scriptable Install System (NSIS), Inno Setup, further illustrate S IGL’s ability to detect real-world malicious
and SFX, and insert every malware sample in Table 4 to create installers.
malicious installers. Those frameworks are popular vehicles S IGL shares a common characteristic with many anomaly-
to spread malware [16, 69]; they are also widely used among based detection systems in that it produces more false pos-
7Software Installer Precision Recall Accuracy F-Score
VirusTotal reports only 42.4% on average, and a minimum
FireFox 0.78 0.70 0.77 0.74 detection rate of 10.8%. Therefore, we do not further evalu-
FileZilla 0.98 1.0 0.98 0.99
PWSafe 0.98 1.0 0.98 0.99 ate S IGL against commercial anti-virus tools, because their
MP3Gain 0.98 1.0 0.98 0.99 limitations are well-known in the literature [67].
ShotCut 0.98 1.0 0.98 0.99 We briefly describe each evaluated system and discuss the
TeamViewer 0.87 1.0 0.91 0.93
Foobar 1.0 1.0 1.0 1.0 results in the remainder of this section. Table 5 summarizes
7Zip 0.98 1.0 0.98 0.99 the overall results for all the systems in this study.
TurboVNC 0.95 1.0 0.97 0.98 Commercial TDS. The commercial TDS [61] inspects every
WinMerge 0.98 1.0 0.98 0.99 event between a process and a file and determines its potential
Launchy 0.8 1.0 0.88 0.89
Skype 1.0 1.0 1.0 1.0 to be a threat based on two factors: A) the familiarity of a file
WinRAR 0.95 1.0 0.98 0.98 – if the TDS has some knowledge of the file in the past (based
DropBox 0.91 1.0 0.95 0.95 on the file name in the training data), then it is less likely to be
Slack 0.91 1.0 0.95 0.95 malicious; B) the diversity of a process – if a process writes to
Flash 1.0 1.0 1.0 1.0
OneDrive 0.74 1.0 0.84 0.85 many different files, then the write event itself is less likely
NotePad++ 1.0 1.0 1.0 1.0 to be malicious, even if the file is unfamiliar to the TDS.
ICBC Anti-Phishing 0.95 1.0 0.98 0.98 Frappuccino. Frappuccino [28] detects program anomalies
ESET AV Remover 0.95 1.0 0.98 0.98 by analyzing whole-system provenance graphs [62]. It ex-
Table 6: S IGL experimental result breakdown for each software installer. plores the graph’s local neighborhood structures using a
vertex-centric label propagation algorithm to compare the
similarity between two provenance graphs. Based on the as-
itives (FPs) than false negatives (FNs), as reflected by its sumption that normal behavior of a program produces similar
higher recall (99%) than precision (94%). However, precision provenance graphs when it runs on different host systems, it
and recall are well balanced, meaning that S IGL does not tend clusters normal provenance graphs of many running instances
to reduce the number of FPs by compromising its ability to of the program as its model and detects abnormal program
detect actual malicious installers. In § 5.4, we study two other runs when their graphs cannot fit into any existing clusters.
anomaly-based detection systems that succumb to this pitfall. We compare S IGL against Frappuccino, because both sys-
Table 6 further details the experimental results for each tems make similar assumptions on the ability to distinguish
software installer. It shows that S IGL delivers consistent per- abnormality from normalcy using provenance graphs.
formance over a wide range of software that exhibit vastly StreamSpot. StreamSpot [49] detects host-system intrusions
different installation behaviors on host systems. We investi- based on information flow graphs. Similar to Frappuccino,
gate two, FireFox and OneDrive, that have slightly lower it leverages a clustering-based approach using a similarity
precision and recall. We notice that the installation process of function that compares two graphs based on their statistics. It
these two applications sometimes includes software updates represents each graph as a vector of local substructure frequen-
that are also captured in SIGs. S IGL therefore has difficulty cies and further approximates the vector using a similarity-
generalizing both installation and update behavior from only preserving hashing scheme. The hashing scheme reduces the
a few instances of training graphs, resulting in lower perfor- dimensionality of the vector while preserving discriminatory,
mance than that of other applications. principal features that better generalize the learned model.
Since StreamSpot claims to detect any anomalies on the host
system, we expect it to identify abnormal installation activity.
5.4 Comparison Study Experimental Results. Table 5 shows the overall results for
We compare S IGL against our in-house commercial TDS [61] all the baseline systems. For StreamSpot and Frappuccino,
and two existing research anomaly detection systems, we use the same experimental setups as described in their
StreamSpot [50] and Frappuccino [28], that analyze prove- respective papers or as implemented in their publicly avail-
nance graphs. We do not evaluate S IGL against other com- able code repositories. We notice that StreamSpot’s original
mercial TDS, because they typically require intelligence ser- implementation analyzes only small local substructures in the
vice subscriptions and customized deployment from external graph. Such a constrained graph exploration tends to make
vendors. Similarly, we exclude evaluation against academic graphs look overly similar to each other, thus resulting in high
systems (such as Mastino [67] and Dropper Effect [46], see FNs and low true positives (TPs). We therefore reimplement
§ 8) that leverage proprietary information from security ven- StreamSpot to analyze larger graph neighborhoods. We re-
dors that is unavailable to us. S IGL enables an enterprise to port the reimplementation results (i.e., better performance)
detect threats using local, enterprise-wide information readily in Table 5.
available to system administrators; additional protection from We see from Table 5 that S IGL significantly outperforms
global security services such as Symantec is complementary all baseline systems in terms of recall, accuracy, and F-score.
to S IGL. It reported only 42 FPs among over 1,000 software installa-
We conducted a preliminary experiment to show that our tions in three months. On the contrary, the commercial TDS
malicious installers (created using real malware in Table 4) produces an overwhelmingly large number of FPs (9,240
can already significantly reduce the efficacy of commercial events are considered potential threats during the experiment),
anti-virus tools, even without changing malware signatures. resulting in exceedingly low precision 2 . The commercial
We upload the original malware samples (Table 4) to Virus-
2 The commercial TDS’s performance values are computed on a per-event
Total, which scans the samples and reports the number of
anti-virus engines that detect them. On average, 80.8% of basis, rather than a per-graph basis, because it has no notion of causality.
To understand an alarm, however, system administrators typically resort to
the engines detect the malware listed in Table 4; the lowest causal analysis, which requires them to inspect benign events in addition to
detection rate was 70.0%. Testing on our malicious installers, the alarm-triggering event.
8TDS results are consistent with a recent study that shows that 1
many enterprises receive at least 300 alerts per day with more
than 50% being FPs [21]. StreamSpot marginally outperforms
% of malicious installers
S IGL in precision by only 3%, at the expense of a much lower 0.8
recall (by 47%). A low recall is typically a product of low TPs
and high FNs. Both StreamSpot and Frappuccino suffer from 0.6
low recall because they have limited graph analytical capabil-
ity. They use a vertex-centric approach to explore local graph
0.4
neighborhoods, but such exploration ignores temporal rela-
tionships among those substructures and provides only limited
views of graph evolution. As a result, they are unable to dis- 0.2
tinguish malicious installers from benign ones, producing few
FPs (i.e., higher precision) but many FNs (i.e., lower recall). 0
Although S IGL reports slightly more FPs, we show in § 5.5
that it provides auxiliary information that allows rapid inspec-
ox
Fi Fox
PW illa
P3 e
Te Sho in
Vi ut
Fo er
Tu 7Z r
rb ip
in C
La erge
S y
in e
ro R
k
h
eP e
AV I +
Re BC
er
tion and dismissal of FPs, which is absent in both StreamSpot
a
ot iv
M Saf
W kyp
ch
ac
O Flas
+
W N
RA
ov
a
am tC
ew
ob
pB
ad
N eD r
G
Z
C
oV
Sl
un
re
M
m
le
Fi
n
D
and Frappuccino. Reducing FPs from the hundreds per day
of a typical commercial TDS [21] to fewer than one per day Basic Guidance Improved Guidance Targeted Guidance
is a significant step at mitigating “alert fatigue” [32]. Exist- Figure 5: Prioritization of anomalous processes.
ing techniques, such as whitelisting trusted processes during
backtracking, can further reduce these FPs. The performance
of our StreamSpot reimplementation demonstrates the impor- scores the list. Note that S IGL assigns every process and
tance of incorporating structural information in the analysis. its versions (§ 4.2) an anomaly score. If S IGL identifies a
StreamSpot outperformed Frappuccino, because Frappuccino process among the top 10 in the list that is fewer than 3
is unable to retain just the relevant information; it overgener- hops away from the target (Fig. 5, checks), we consider S IGL
alizes its model with “noise” in the dataset. successfully having provided basic guidance. If the process
S IGL benefits from three important features of graph is ranked among the top 5 and is less than or equal to 3 hops
neural networks. First, they effectively filter noise. S IGL away (Fig. 5, stripes), S IGL has provided improved guidance.
learns to capture relevant information during training, a data- Finally, if S IGL identifies the target among the top 5 in the
oriented approach different from the hashing technique used list or the target is only 1 hop away from a top-5 process
in StreamSpot. Second, they preserve long-term memory. (Fig. 5, solid), we say that S IGL offered targeted guidance.
S IGL memorizes the sequential procedure of a software in- These three levels of guidance are based on typical behavior
stallation and uses this long-term memory to determine the of system administrators, trying to understand the sequence
legitimacy of a process during different stages of the instal- of steps that produced an attack [44], and the value (e.g., time
lation. StreamSpot and Frappuccino consider only “bag-of- savings) that S IGL brings to the human analysts.
subgraphs” when analyzing provenance graphs. Third, they Fig. 5 shows that S IGL is able to provide at least basic guid-
consider non-linear encoding of graph structures. Graph struc- ance to identify almost all malicious processes or files for
tures are contexts that help distinguish normal and abnormal all software installers in the experiment. In fact, it provides
process nodes. S IGL learns graph structure via its unique neu- targeted guidance for at least 10% of malicious installers in
ral network architecture, while the commercial TDS isolates all cases and more than 50% of them in the majority (75%) of
each event from its broader execution context. the cases. We investigate two specific examples, Foobar and
OneDrive, as they have distinctive results. S IGL has difficulty
5.5 Prioritizing Anomalous Processes providing effective guidance for about half of the malicious
Foobar installers. We inspected the SIGs of those installers
Many existing provenance-based detection systems [28, 49, manually and discovered that S IGL identifies many versions
63] lack support for postmortem attack investigation, because of a process that originally connects to the malware file as
their contextual analysis typically requires a holistic under- the most anomalous. It is likely that anomaly scores “accu-
standing of a large provenance (sub)graph. It is therefore diffi- mulate” as later versions of the process are being analyzed.
cult to pinpoint the exact nodes/edges responsible when a deci- Concrete investigation of how provenance graph versioning
sion is made based on the entire (sub)graph. Others [32,34,58] affects graph analysis is left for future work.
instead focus on using data provenance to correlate alerts from S IGL is not able to provide targeted guidance for OneDrive,
simple edge-based detection systems (e.g., commercial TDS) because OneDrive frequently identifies the update processes
to reduce false alarms and provide attack attribution. How- in the SIG as among the most anomalous. As mentioned
ever, they depend on the underlying threat detection system in § 5.3, a small number of OneDrive training SIGs include
to reliably report all possible threats, assuming a 100% de- both installation and update processes. S IGL cannot accu-
tection rate [32]. S IGL conducts contextual graph analysis rately learn update behavior from only a small number of
to maintain high detection accuracy. Meanwhile, we show samples and therefore incurs high reconstruction losses for
in Fig. 5 that it also assists attack attribution by accurately those processes. The same situation is less severe in Fire-
identifying anomalous processes within the graph. Fox, because the update process occurs more frequently in its
We consider three levels of attribution that provide cyber- training data. However, it does result in lower recall (Table 6)
analysts with increasing degrees of guidance. We call the as the FireFox model attempts to generalize both behaviors
malware process (and its associated file) the target and the using a small number of training samples.
ranked list generated by S IGL based on processes’ anomaly Overall, we show that S IGL can effectively guide cyber-
9You can also read