Shoreline Change at Gulf Islands National Seashore, Florida and Mississippi - 2018-2021 Data Summary Natural Resource Data Series ...
←
→
Page content transcription
If your browser does not render page correctly, please read the page content below

National Park Service
U.S. Department of the Interior

Natural Resource Stewardship and Science

Shoreline Change at Gulf Islands National Seashore,
Florida and Mississippi
2018–2021 Data Summary
Natural Resource Data Series NPS/GULN/NRDS—2022/1348

ON THE COVER
A surveyor records shoreline position at the west end of Fort Pickens in Florida. NPS photo / GULN staff.

Shoreline Change at Gulf Islands National Seashore,
Florida and Mississippi
2018–2021 Data Summary

Natural Resource Data Series NPS/GULN/NRDS—2022/1348

Jeff Bracewell

National Park Service
Gulf Coast Inventory and Monitoring Network
646 Cajundome Blvd
Lafayette, LA 70506

March 2022

U.S. Department of the Interior
National Park Service
Natural Resource Stewardship and Science
Fort Collins, Colorado
The National Park Service, Natural Resource Stewardship and Science office in Fort Collins, Colorado, publishes a range of
reports that address natural resource topics. These reports are of interest and applicability to a broad audience in the National
Park Service and others in natural resource management, including scientists, conservation and environmental constituencies,
and the public.

The Natural Resource Data Series is intended for the timely release of basic data sets and data summaries. Care has been taken to
assure accuracy of raw data values, but a thorough analysis and interpretation of the data has not been completed. Consequently,
the initial analyses of data in this report are provisional and subject to change.

All manuscripts in the series receive the appropriate level of peer review to ensure that the information is scientifically credible
and technically accurate.

This report is available from the Gulf Coast Network website and the Natural Resource Publications Management website. If you
have difficulty accessing information in this publication, particularly if using assistive technology, please email irma@nps.gov.

Please cite this publication as:

Bracewell, J. 2022. Shoreline change at Gulf Islands National Seashore, Florida and Mississippi: 2018–2021 data summary..
Natural Resource Data Series NPS/GULN/NRDS—2022/1348. National Park Service, Fort Collins, Colorado.
https://doi.org/10.36967/nrr-2293103.

NPS 635/179861, March 2022

                                                                   ii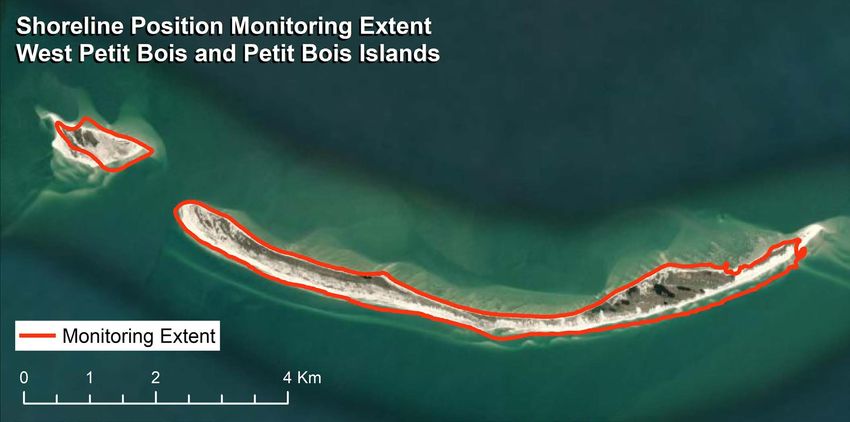
Contents
                                                                                                                                                                             Page
Figures . . . . .��������������������������������������������������������������������������������������������������������������������������������������������������������������� iv
Tables . . . . . ����������������������������������������������������������������������������������������������������������������������������������������������������������������v
Summary and Key Findings . . . . . ������������������������������������������������������������������������������������������������������������������������������� vi
Introduction . . . . .������������������������������������������������������������������������������������������������������������������������������������������������������ 1
Study Area . . . . .��������������������������������������������������������������������������������������������������������������������������������������������������������� 2
Methods . . . . .������������������������������������������������������������������������������������������������������������������������������������������������������������ 3
        Standard Operating Procedure . . . . . ������������������������������������������������������������������������������������������������������������������ 6
        Timing of the Shoreline Position Survey . . . . . ������������������������������������������������������������������������������������������������������ 6
        Natural and Anthropegenic Events Affecting Shoreline Position . . . . . ��������������������������������������������������������������� 11
Results . . . . .������������������������������������������������������������������������������������������������������������������������������������������������������������� 13
        Shoreline Position Data Quality . . . . . ���������������������������������������������������������������������������������������������������������������� 13
        Annual Shoreline Change Analysis . . . . . ���������������������������������������������������������������������������������������������������������� 14
        Areas of Special Interest . . . . . �������������������������������������������������������������������������������������������������������������������������� 14
        Problems and Concerns . . . . . �������������������������������������������������������������������������������������������������������������������������� 14
        Protocol Changes . . . . . ������������������������������������������������������������������������������������������������������������������������������������� 14
        Additional Information . . . . . ���������������������������������������������������������������������������������������������������������������������������� 14
Literature Cited . . . . .����������������������������������������������������������������������������������������������������������������������������������������������� 15
Appendix A. End Point and Island Width Rate Histograms . . . . .�������������������������������������������������������������������������������� 16
Appendix B. Change Rate Maps . . . . .����������������������������������������������������������������������������������������������������������������������� 22

                                                                                        iii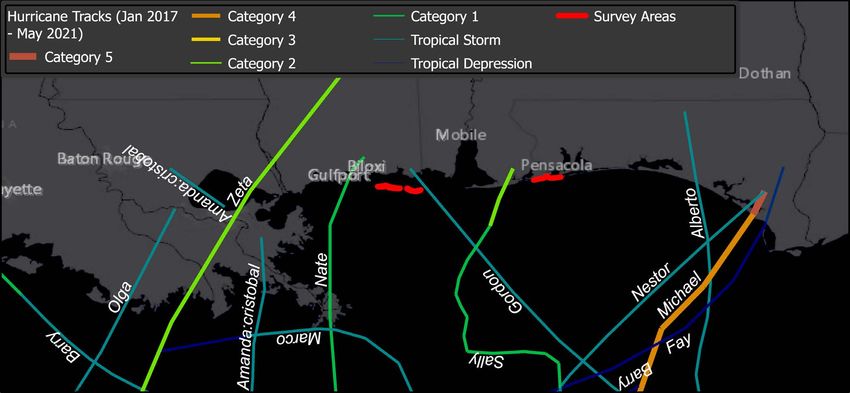
Figures
Page
Figure 1. Shoreline Position monitoring extent—Horn Island. . . . . . ��������������������������������������������������������������������� 3
Figure 2. Shoreline Position monitoring extent—West Petit Bois Island, Petit Bois Island. . . . . . ��������������������������� 4
Figure 3. Shoreline Position monitoring extent—Perdido Key, Fort Pickens. . . . . . ������������������������������������������������ 4
Figure 4. End Point Rate calculation is performed on distance between the first year and the current
year. The result is then divided by the time interval between surveys. . . . . . ���������������������������������������� 5
Figure 5. Island width rate calculation is performed on cross-shore width. . . . . . . ���������������������������������������������� 5
Figure 6. Water levels recorded at Pensacola FL NOAA monitoring station before and during the
2018 Florida shoreline survey. . . . . . ������������������������������������������������������������������������������������������������������ 7
Figure 7. Water levels recorded at Pascagoula NOAA Lab MS before and during the 2018 Mississippi
shoreline survey. . . . . . ������������������������������������������������������������������������������������������������������������������������� 8
Figure 8. Water levels recorded at Pensacola FL NOAA waether station before and during the 2021
Florida shoreline survey. . . . . . ��������������������������������������������������������������������������������������������������������������� 9
Figure 9. Water levels recorded at Pascagoula NOAA Lab MS before and during the Mississippi
shoreline survey. . . . . . ������������������������������������������������������������������������������������������������������������������������� 10
Figure 10. Map showing tropical storms making landfall near Gulf Islands National Seashore from
January 2017 through May 2021. . . . . . ���������������������������������������������������������������������������������������������� 11
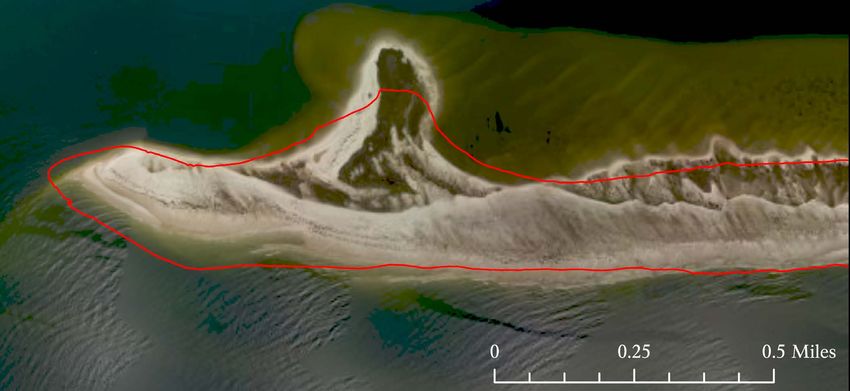
Figure 11. This image is provided by NOAA Remote Sensing Division and was taken October 10, 2017
after Hurricane Nate. . . . . . . ���������������������������������������������������������������������������������������������������������������� 12
Figure 12. This image is provided by NOAA Remote Sensing Division and was taken September 18,
2021 after Hurricane Sally. . . . . . . ����������������������������������������������������������������������������������������������������� 12
Figure 13. Crowded shoreline at the east end of Perdido Key. . . . . . �������������������������������������������������������������������� 13
Figure A-1. Distribution of the End Point Rates calculated for transects at Fort Pickens. . . . . . ������������������������������� 17
Figure A-2. Distribution of the End Point Rates calculated for transects at Perdido Key. . . . . . ������������������������������� 18
Figure A-3. Distribution of the End Point Rates calculated for transects at Petit Bois Island. . . . . . ������������������������� 19
Figure A-4. Distribution of the End Point Rates calculated for transects at West Petit Bois Island. . . . . . ���������������� 20
Figure A-5. Distribution of the End Point Rates calculated for transects at Horn Island. . . . . . ������������������������������� 21
Figure B-1. End Point Rate for Fort Pickens and Perido Key 1 of 6. . . . . . ������������������������������������������������������������� 23
Figure B-2. End Point Rate for Fort Pickens and Perido Key 2 of 6. . . . . . ������������������������������������������������������������� 24
Figure B-3. End Point Rate for Fort Pickens and Perido Key 3 of 6. . . . . . ������������������������������������������������������������� 25
Figure B-4. End Point Rate for Fort Pickens and Perido Key 4 of 6. . . . . . ������������������������������������������������������������� 26
Figure B-5. End Point Rate for Fort Pickens and Perido Key 5 of 6. . . . . . ������������������������������������������������������������� 27
Figure B-6. End Point Rate for Fort Pickens and Perido Key 6 of 6. . . . . . ������������������������������������������������������������� 28
Figure B-7. Island Width Rate for Petit Bois, West Petit Bois and Horn Islands 1 of 9. . . . . . ���������������������������������� 29
Figure B-8. Island Width Rate for Petit Bois, West Petit Bois and Horn Islands 2 of 9. . . . . . ���������������������������������� 30
Figure B-9. Island Width Rate for Petit Bois, West Petit Bois and Horn Islands 3 of 9. . . . . . ����������������������������������� 31
iv
Figure B-10. Island Width Rate for Petit Bois, West Petit Bois and Horn Islands 4 of 9. . . . . . ���������������������������������� 32
Figure B-11. Island Width Rate for Petit Bois, West Petit Bois and Horn Islands 5 of 9. . . . . . ����������������������������������� 33
Figure B-12. Island Width Rate for Petit Bois, West Petit Bois and Horn Islands 6 of 9 . . . . . ������������������������������������ 34
Figure B-13. Island Width Rate for Petit Bois, West Petit Bois and Horn Islands 7 of 9 . . . . . ������������������������������������ 35
Figure B-14. Island Width Rate for Petit Bois, West Petit Bois and Horn Islands 8 of 9 . . . . . ������������������������������������ 36
Figure B-15. Island Width Rate for Petit Bois, West Petit Bois and Horn Islands 9 of 9. . . . . . ����������������������������������� 37

Tables
                                                                                                                                                                 Page

Table 1. 	Standard operating procedures used for shoreline position data collection, processing, and
           reporting. . . . . .������������������������������������������������������������������������������������������������������������������������������������� 6
Table 2. 	List of verified high tide water levels occurring before shoreline position surveys were
           conducted [m—meters; *— NAVD 88]. . . . . .���������������������������������������������������������������������������������������� 6
Table 3.           Tropical storms making landfall near GUIS from January 2017 through May 2021. . . . . .���������������������� 11
Table 4.           Summary of GNSS accuracy during the shoreline position surveys. . . . . .���������������������������������������������� 13
Table 5. 	Summary of End Point Rate (EPR) for the Florida Units. . . . . . .������������������������������������������������������������� 13
Table 6. 	Summary of Island Width Rate (IWR) for the Mississippi Units. . . . . . .������������������������������������������������� 13

                                                                                  v
Summary and Key Findings
In May and June 2018, and April 2021, the Gulf Coast               •   In Mississippi, the mean change in island width from
Network (GULN) surveyed shoreline position at Gulf Islands             2018 to 2021 was -7.46 meters/year (-24.5 ft/year) with
National Seashore (GUIS) as a part of the NPS Vital Signs              a standard deviation of 12.49 meters (41.0 ft) with
Monitoring Program. Monitoring was conducted following                 approximately 73% of transects exhibiting a loss in
methods detailed in Monitoring Shoreline Position at Gulf              width.
Coast Network Parks: Protocol Implementation Plan (PIP;
Bracewell 2017). Shoreline change was calculated using             This project is in the early phases of implementation and
the Digital Shoreline Analysis System developed by USGS            will benefit from future surveys to better understand the
(Theiler et al. 2008).                                             influence of slight changes in survey timing and other
                                                                   environmental variations.
Key findings from this effort are as follows:

•   In Florida, the mean shoreline change rate from 2018
    to 2021 was -7.10 meters/year (-23.3 feet[ft]/year)
    with a standard deviation of 5.01 meters (16.4 ft) with
    approximately 95% of transects exhibiting landward
    retreat.

                                                              vi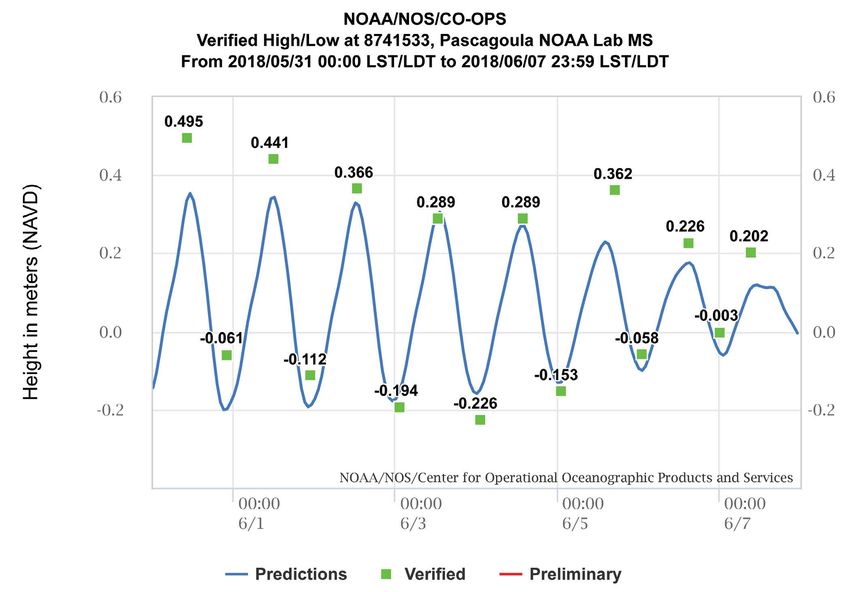
Introduction
As stated by Psuty et al. (2010)                                      Seashore (PAIS) using modified procedures developed
                                                                      for the Northeast Coastal and Barrier Network (NCBN).
    Changes in shoreline position are recognized as interacting       Handheld and utility task vehicle (UTV)-mounted Global
    with many other elements of the ocean beach-dune                  Positioning Systems (GPS) or Global Navigation Satellite
    ecosystem and are thus both driving and responding to the         Systems (GNSS) are used to record shoreline position by
    variety of natural and cultural factors active at the coast       walking or driving the high tide swash line. The Gulf Coast
    at a variety of temporal and spatial scales. The direction        Network’s monitoring objective is to identify the biennial
    and magnitude of shoreline change can be monitored                and long-term trends and variability of shoreline position in
    through the application of a protocol that tracks the             network seashore parks.
    spatial position of the neap-tide, high tide swash line
    under conditions of temporal sampling.                            This report provides a summary of shoreline monitoring data
                                                                      collected to address this objective at Gulf Islands National
The Gulf Coast Network monitors shoreline position at                 Seashore from April 2018 through May 2021.
Gulf Islands National Seashore and Padre Island National

                                                                  1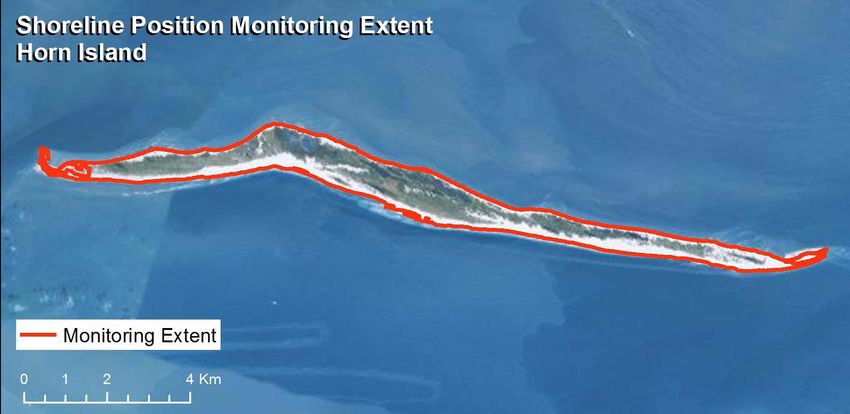
Study Area
Gulf Islands National Seashore (GUIS) consists of several           is submerged land (Anderson et al. 2005). The mainland
units in Florida and Mississippi. The Mississippi section           portion of the GUIS-FL park section consists of live oak,
(GUIS-MS) consists of five islands and a small mainland             sandhill, and marsh communities; the mainland portion
headquarters area. The authorized boundary includes not             of the GUIS-MS park section consists of pine/palmetto
only the barrier islands themselves, but also portions of           flatwoods, mixed pine/hardwood, lowland hardwood, and
the Gulf of Mexico and Misssissippi Sound. From the west            tidal marsh.
to east, the islands of GUIS-MS are: Cat, Ship, Horn, West
Petit Bois, and Petit Bois Islands and are only accessible by       Hurricanes are one of the biggest concerns for the park, as
boat. Horn Island is the largest and Cat is the most recently       they can have devastating effects on biological communities
acquired of the GUIS-MS islands. Davis Bayou is the only            as well as park structures and facilities and cause rapid
mainland area in the GUIS-MS park section.                          morphological shoreline changes through erosion and
                                                                    overwash of the islands. Hydrologic alternations (e.g., jetties
The Florida section (GUIS-FL) consists of portions of two           and navigation channels) alter sediment input and transport,
islands (Santa Rosa Island and Perdido Key) and two small           limiting the ability of these systems to recover on their own
mainland areas. Three park units are located on Santa Rosa          between storms. To combat erosion, the beaches of Gulf
Island: Fort Pickens, Santa Rosa Area, and Okaloosa Area.           Islands National Seashore have been regularly nourished
The Naval Live Oaks Reservation is on a peninsula forming           with sand, which generally comes from the dredging of
part of the eastern mouth of Pensacola Bay. Unlike the GUIS-        navigation channels. Although these nourishment projects
MS park section, all areas of the GUIS-FL park section,             are beneficial for the reduction of erosion, there is concern
including the islands, are accessible to vehicles. The water        regarding the rates of revegetation, adverse effects on
bodies surrounding the Florida section include Santa Rosa           macroinvertebrates, and reduction of the vegetative seed
Sound, Big Lagoon, Pensacola Bay, Choctawhatchee Bay, and           bank (Cooper et al. 2005).
the Gulf of Mexico (Cooper et al. 2005).
                                                                    The purpose of this document is to report the most recently
There are a number of aquatic and terrestrial ecosystems in         collected data from within the park as part of an ongoing
Gulf Islands National Seashore, including Gulf, bay, dunes,         long-term shoreline-change monitoring program. Other data
salt marsh, maritime forest, barrier islands, seagrass beds,        collected during this survey are available at the Gulf Coast
and other marine systems. Hydrology and water-related               Network Shoreline Monitoring Project.
issues are of central importance because 80% of the park

                                                                2
Methods
The position of selected GUIS shorelines, are mapped in GIS format. Digital Shoreline Analysis System (DSAS; Theiler
the spring of every other year using methods developed by et al. 2008) is used to analyze the shoreline change along
National Park Service Northeast Coast Barrier Network spatially fixed cross-shore transects distributed every 20
(Psuty et al. 2010) and adapted by the Gulf Coast Network meters (65.6 ft). Annual shoreline change rates are calculated
(Bracewell 2017). Due to COVID 19 related travel for the Florida Units using the End Point Rate (EPR) method,
restrictions, the Gulf Coast Network was not able to survey which addresses the change in shoreline by determining the
Gulf Islands National Seashore in 2020 as prescribed in the distance between two shorelines and dividing the distance
protocol implementation plan. As an adaptive measure, by the time between the shoreline surveys (Figure 4). In
the the network surveyed Gulf Islands National Seashore in Mississippi, island width rate is calculated instead of EPR
2021 and will resume the normal even-year schedule with a because of large amounts of variation in shoreline position
survey in 2022. Figures 1–3 show the extent of the shoreline on both Gulf and Sound sides of these islands. Figure 5
mapping effort at Gulf Islands National Seashore. The high describes how the island width rate is calculated. This report
tide swash line is mapped using a GNSS (GPS) unit, then addressed shoreline change between spring 2018 and spring
differentially corrected results are exported into a standard 2021.
Figure 1. Shoreline Position monitoring extent—Horn Island.
3Figure 2. Shoreline Position monitoring extent—West Petit Bois Island, Petit Bois Island.
Figure 3. Shoreline Position monitoring extent—Perdido Key, Fort Pickens.
4Figure 4. End Point Rate calculation is performed on distance between the first year and the current year. The result is then divided
by the time interval between surveys. In the case of the transect measured in this figure, the shoreline retreated a total of 31 meters
(101.7 ft), or 10.3 meters (33.8 ft) per year.
Figure 5. Island width rate calculation is performed on cross-shore width. The first year is subtracted from the current year, then
the difference is divided by the time interval between surveys. In this figure, the island narrowed 12.7 meters (41.7 ft) per year;
calculated as (177–215 meters) / 3 years = -12.7 meters per year or (580.7–705.4 ft) / 3 years = 41.6 ft per year.
5Standard Operating Procedure sets across many surveys so results are comparable. No
Table 1 presents the standard operation procedures significant changes were made to SOPs between 2017 and
considered critical to maintaining continuity between data 2021, and version numbers in the table apply to all datasets.
Table 1. Standard operating procedures used for shoreline position data collection, processing, and reporting.
SOP number SOP title SOP version
SHR03 Survey Timing and GPS Mission Planning 1.0
SHR04 Basic GPS Settings for Position Collection 1.0
SHR05 Conducting the Survey 1.0
SHR06 Initial Post Survey Processing 1.0
SHR07 Change Calculation, Data Analysis and Reporting 1.0
Timing of the Shoreline Position Survey closest NOAA monitoring stations: Pascagoula NOAA Lab
Shoreline surveys of the high tide swash line are conducted MS in Mississippi and Pensacola FL in Florida (NOAA
during neap tides in April and May. Neap tides are the 2018). The verified water levels occurring before the 2018
two periods per month when high and low tides are least and 2021 surveys are listed in Table 2. Graphs of verified
different. For a given survey season, these neap tide periods versus predicted water levels for the survey periods and the
are determined based on predicted water levels using the prior week are presented in Figures 6 through 9.
Table 2. List of verified high tide water levels occurring before shoreline position surveys were conducted [m—meters; *— NAVD 88].
Season Survey Collection Survey Area Previous Previous
Date and Time High-Tide High-Tide Date
Height* (m) and Local Time
Spring 4/26/2018 14:40–16:00 Perdido Key (Johnsons Beach) 0.160 4/26/2018 11:00
Spring 4/27/2018 10:45–15:10 Perdido Key (Pensacola Pass to Johnsons Beach) 0.146 4/27/2018 11:12
Spring 4/28/2018 13:40–16:00 Fort Pickens 0.174 4/28/2018 11:00
Spring 6/06/2018 08:30–12:00 Petit Bois Island/ West Petit Bois Island? 0.362 6/05/2018 17:18
Spring 6/06/2018 14:30–16:30 Horn Island 0.362 6/05/2018 17:18
Spring 6/07/2018 08:20–12:45 Horn Island 0.226 6/06/2021 15:00
Spring 4/10/2021 17:40–19:10 Fort Pickens 0.523 4/10/2021 06:36
Spring 4/11/2021 13:00–15:25 Perido Key 0.406 4/11/2021 11:48
Spring 4/25/2021 09:55–16:00 Horn Island 0.455 4/24/2021 12:48
Spring 4/26/2021 10:30–16:00 Petit Bois Island 0.326 4/25/2021 12:00
Spring 4/28/2021 10:00–12:00 Petit Bois Island/ West Petit Bois Island 0.514 4/27/2021 10:48
6Figure 6. Water levels recorded at Pensacola FL NOAA monitoring station before and during the 2018 Florida shoreline survey.
7Figure 7. Water levels recorded at Pascagoula NOAA Lab MS before and during the 2018 Mississippi shoreline survey.
8Figure 8. Water levels recorded at Pensacola FL NOAA monitoring station before and during the 2021 Florida shoreline survey.
9Figure 9. Water levels recorded at Pascagoula NOAA Lab MS before and during the Mississippi shoreline survey.
10Natural and Anthropegenic Events stations. Figure 10 shows storm tracks for these and other
Affecting Shoreline Position storms in the northern Gulf of Mexico for the same period.
Table 3 lists tropical storms that made landfall near Gulf These storms caused island overwash and breeching in some
Islands National Seashore from January 2017 to May 2021 parts of the surveyed areas like those shown in Figures 11
with the associated water levels recorded at nearby tide and 12.
Table 3. Tropical storms making landfall near GUIS from January 2017 through May 2021.
Storm Water Level Water Level Tide Station Proximity of Landfall to Park
(Meters NAVD88) Date
Nate 2.159 Oct 8 Pascagoula NOAA Lab, MS About 12 miles west of the Davis Bayou Unit
Gordon 0.942 Sept 5 Pensacola FL About 20 miles east of the Davis Bayou Unit
Sally 1.972 Sept 16 Pensacola FL About 23 miles west of the Naval Live Oaks Unit
Figure 10. Map showing tropical storms making landfall near Gulf Islands National Seashore from January 2017 through May 2021.
11Figure 11. This image is provided by NOAA Remote Sensing Division and was taken October 10, 2017 after Hurricane Nate. This
scene shows storm overwash at the west end of Horn Island, Miss. Red line represents the shoreline position in spring 2021.
Figure 12. This image is provided by NOAA Remote Sensing Division and was taken September 18, 2021 after Hurricane Sally. This
scene shows breeching at the east end of Perdido Key, near Pensacola Pass, Fla. Red line represents the shoreline position in spring
2021.
12Results
Shoreline Position Data Quality gap in coverage on the east end of Perdido Key at Pensacola
Shoreline position was recorded in the spring of 2018 and Pass due to heavy visitation including boats moored along
2021. There was an approximate 2.5-kilometer (1.6 miles) the shore (Figure 13). The average post-processed horizontal
gap in data coverage on the western Gulf shoreline of Horn precision remained near or below 10 centimeters (3.9 inches;
Island due to equipment operator error. There was also a Table 4).
Figure 13. Crowded shoreline at the east end of Perdido Key.
Table 4. Summary of GNSS accuracy during the shoreline position surveys.
Area Year Horizontal Accuracy (meters)
Florida 2018 0.015
Mississippi 2018 0.042
Florida 2021 0.048
Mississippi 2021 0.130
Tables 5 and 6 present grouped summary statistics for the or island narrowing. End point and island width rate
2018 to 2021 shoreline position change rates and includes: histograms, grouped by unit, are presented in Appendix A
transect count, minimum, maximum, average, and standard and related change rate maps are presented in Appendix B.
deviation. All groups showed overall landward retreat
Table 5. Summary of End Point Rate (EPR) for the Florida Units. Distances are reported in meters per year. Positive numbers indicate an
advance seaward and negative numbers indicate landward retreat.
Group Transect Count Minimum Maximum Average Standard
Deviation
Fort Pickens 582 -19.01 26.46 -6.02 5.28
Perdido Key 539 -23.11 12.71 -8.28 4.41
Table 6. Summary of Island Width Rate (IWR) for the Mississippi Units. Change is width is reported in meters per year. The negative
numbers indicate island narrowing, while positive numbers indicate island widening over the three-year interval.
Group Transect Count Minimum Maximum Average Standard
Deviation
Petit Bois Island 484 -28.46 22.55 -7.70 9.16
West Petit Bois Island 73 -69.00 61.62 -18.90 23.67
Horn Island 826 -44.90 34.45 -8.00 12.38
13Annual Shoreline Change Analysis horizontal displacement of shoreline position. Even slight
Table 5 reports EPR for Fort Pickens and Perdido Key. The changes in water level will expose or inundate large areas
average rates of retreat are much higher than the short-term where the slope is shallow. A technical report summarizing
losses (1978 to 2018) reported in Kratzmann et. al (2021), the influence of slope and tidal variation can be found in
where Perdido Key retreated 2.14 meters/year (7.0 ft/year) Appendix B of Bracewell (2019). It is important to keep in
and Fort Pickens retreated 0.93 meters/year (3.1 ft/year) with mind that what may seem like a dramatic change in shoreline
a standard deviation of 1.03 meters (3.4 ft) and 1.55 meters position could be attributed to a slight beach slope and
(5.1 ft) respectively. Results of EPR used in Florida are not tidal variation between surveys. It is anticipated that linear
directly comparable to Island Width Rates used in Misssippi regression models used in trend analyses will lessen the
because EPR only accounts for change on one shoreline. impact from tidal variation.
Even so, the changes reported for the Mississippi islands in
Tropical storm Alberto formed in late May 2018 and caused
Table 6 likely parallel the pattern of increased rates of retreat
the park to close on May 26, forcing postponement of the
shown in Florida. Himmelstoss et al. (2017), which does not
GULN’s survey work. Although the storm veered east and
include West Petit Bois Island, reports rates of -2.88 meters/
had virtually no impact on the Mississippi barrier islands, it
year (-9.4 ft/year) at Petit Bois Island and -1.69 meters/
served as a reminder that early season tropical systems may
year (-5.5 ft/year) at Horn Island from 1966 to 2001 with a
challenge completion of surveys within the April/May survey
standard deviation of 5.32 meters (17.5 ft) and 6.63 meters
window.
(21.8 ft) respectively.
Areas of Special Interest Protocol Changes
No major changes occurred to the GULN PIP (Bracewell
During scoping meetings for this project, GUIS Resource
2017) between its initial publication in 2017 and
Management staff expressed targeted interest in the areas
composition of this report.
adjacent to Pensacola Pass. The most western 1-kilometer
(.62 miles) stretch of Fort Pickens retreated 0.55 meter/year
(1.8 ft/year) while the most eastern 1-kilometer (.62 miles) Additional Information
stretch of Perdido Key lost 7.0 meters/year (23.0 ft/year). For data and information related to this report please visit
the Gulf Coast Network Shoreline Monitoring Project. For
information about the GULN’s complementary coastal
Problems and Concerns
dynamics project on topographic change, see the Gulf Coast
When interpreting change in shoreline position, it is
Network Coastal Topography Monitoring Project.
important to consider the influence of beach slope on
14Literature Cited
Anderson, S. M., A. Feldmen, A. James, C. Katin, and W. R. Wise. 2005. Assessment of coastal water resources and watershed
conditions at Gulf Islands National Seashore (Florida and Mississippi). Technical Report NPS/NRWRD/NRTR-2005/330.
Bracewell, J. 2017. Monitoring shoreline position at Gulf Coast Network parks: Protocol implementation plan. Natural Resource
Report NPS/GULN/NRR—2017/1501. National Park Service, Fort Collins, Colorado. Available at: https://irma.nps.gov/
DataStore/Reference/Profile/2243708 (last accessed December 2021).
Bracewell J. 2019. Shoreline change at Padre Island National Seashore, Texas: 2017–2019 data summary. Natural Resource Data
Series. NPS/GULN/NRDS—2019/1238. National Park Service. Fort Collins, Colorado. Available at: https://irma.nps.gov/
DataStore/Reference/Profile/2266899 (last accessed December 2021).
Cooper, R. J., G. Sundin, S. B. Cederbaum, and J. J. Gannon. 2005. Natural resource summary for Gulf Islands National Seashore
(GUIS). Final report to National Park Service Gulf Coast Network.
Himmelstoss, E. A., M. G. Kratzmann, and E. R. Thieler. 2017. National assessment of shoreline change – A GIS compilation of
updated vector shorelines and associated shoreline change data for the Gulf of Mexico: U.S. Geological Survey data release,
https://doi.org/10.5066/F78P5XNK (last accessed December 2021).
Kratzmann, M. G., A. S. Farris, K. M. Weber, R. E. Henderson, and E. A. Himmelstoss. 2021. USGS National Shoreline Change:
A GIS compilation of Updated Vector Shorelines (1800s–2010s) and Associated Shoreline Change Data for the Georgia
and Florida Coasts: U.S. Geological Survey data release. Available at: https://doi.org/10.5066/P9J3CVN4 (last accessed
December 2021).
National Oceanic and Atmospheric Administration (NOAA). 2018. The Center for Operational Oceanographic Products and
Services. Available at: tidesandcurrents.noaa.gov (last accessed December 2021).
Psuty, N. P., T. M. Silveira, M. Duffy, J. P. Pace, and D. E. Skidds. 2010. Northeast Coastal and Barrier Network geomorphological
monitoring protocol: Part I—ocean shoreline position. National Park Service, Fort Collins, Colorado. Available at: https://
irma.nps.gov/DataStore/Reference/Profile/664308 (last acessed December 2021).
Thieler, E. R., E. A. Himmelstoss, J. L. Zichichi, and A. Ergul. 2008. The digital shoreline analysis system (DSAS) version 4.0—an
ArcGIS extension for calculating shoreline change. Open-File Report 2008-1278. U.S. Geological Survey. Available at:
https://cmgds.marine.usgs.gov/publications/DSAS/of2008-1278/ (last accessed December 2021).
15Appendix A. End Point and Island Width Rate Histograms
1617
Figure A-1. Distribution of the End Point Rates calculated for transects at Fort Pickens.18
Figure A-2. Distribution of the End Point Rates calculated for transects at Perdido Key.19
Figure A-3. Distribution of the End Point Rates calculated for transects at Petit Bois Island.20
Figure A-4. Distribution of the End Point Rates calculated for transects at West Petit Bois Island.21
Figure A-5. Distribution of the End Point Rates calculated for transects at Horn Island.Appendix B. Change Rate Maps
22FDEP, CONANP, Esri, HERE, Garmin, SafeGraph, GeoTechnologies, Inc, METI/NASA, USGS, EPA, NPS, US Census Bureau, USDA, NOAA NGDC, Esri, DeLorme, NaturalVue, FDEP, CONANP, Esri, HERE, Garmin, SafeGraph, GeoTechnologies, Inc, METI/NASA, USGS, EPA, NPS, USDA, Esri, DeLorme, NaturalVue
Shoreline Position 2021
Shoreline Position 201 8
Shoreline Position
Transect
Change / Yr 201 8 to 2021
- 23. 1 m - - 1 5 . 0 m
- 1 4. 9 m - - 1 0. 0 m
- 9. 9 m - - 5 . 0 m
- 4. 9 m - 5 . 0 m
Pa rk Bo un da ry
5 . 1 m - 1 0. 0 m
1 0. 1 m - 1 5 . 0 m
1 5 . 1 m - 26. 5 m
Elevation Meters
NAVD- 8 8 ( Oct 2020)
0. 2 - 0. 8
23
0. 9 - 1 . 2
1 .3 - 1 .9
2-3
0 0. 25 0. 5 1 Miles
3. 1 - 4. 9
0 25 0 5 00 1 ,000 Meters R 5 - 7. 9
Map Index
d o Ke y Fo r t Pic ke n s
Pe rd i
R
Figure B-1. End Point Rate for Fort Pickens and Perido Key 1 of 6.FDEP, CONANP, Esri, HERE, Garmin, SafeGraph, GeoTechnologies, Inc, METI/NASA, USGS, EPA, NPS, US Census Bureau, USDA, FDEP, CONANP, Esri, HERE, Garmin, SafeGraph, GeoTechnologies, Inc, METI/NASA, USGS, EPA, NPS, USDA, Esri, DeLorme, NaturalVue
Shoreline Position 2021
Shoreline Position 201 8
Shoreline Position
Transect
Change / Yr 201 8 to 2021
- 23. 1 m - - 1 5 . 0 m
a B a y - 1 4. 9 m - - 1 0. 0 m
Pe n s a c o l
- 9. 9 m - - 5 . 0 m
- 4. 9 m - 5 . 0 m
5 . 1 m - 1 0. 0 m
1 0. 1 m - 1 5 . 0 m
1 5 . 1 m - 26. 5 m
Elevation Meters
NAVD- 8 8 ( Oct 2020)
0. 2 - 0. 8
24
0. 9 - 1 . 2
1 .3 - 1 .9
2-3
0 0. 25 0. 5 1 Miles
3. 1 - 4. 9
0 25 0 5 00 1 ,000 Meters
R 5 - 7. 9
Map Index
d o Ke y Fo r t Pic ke n s
Pe rd i
R
Figure B-2. End Point Rate for Fort Pickens and Perido Key 2 of 6.FDEP, CONANP, Esri, HERE, Garmin, SafeGraph, GeoTechnologies, Inc, METI/NASA, USGS, EPA, NPS, US Census Bureau, USDA, FDEP, CONANP, Esri, HERE, Garmin, SafeGraph, GeoTechnologies, Inc, METI/NASA, USGS, EPA, NPS, USDA, Esri, DeLorme, NaturalVue
Shoreline Position 2021
Shoreline Position 201 8
Shoreline Position
Transect
Change / Yr 201 8 to 2021
- 23. 1 m - - 1 5 . 0 m
Pe n s a c o l a B a y
- 1 4. 9 m - - 1 0. 0 m
- 9. 9 m - - 5 . 0 m
- 4. 9 m - 5 . 0 m
5 . 1 m - 1 0. 0 m
1 0. 1 m - 1 5 . 0 m
1 5 . 1 m - 26. 5 m
s s
Elevation Meters
Pa
NAVD- 8 8 ( Oct 2020)
0. 2 - 0. 8
25
a
o l
0. 9 - 1 . 2
a c
1 .3 - 1 .9
s
2-3
n
0 0. 25 0. 5 1 Miles
Pe
3. 1 - 4. 9
R
5 - 7. 9
0 25 0 5 00 1 ,000 Meters
Map Index
d o Ke y Fo r t Pic ke n s
Pe rd i
R
Figure B-3. End Point Rate for Fort Pickens and Perido Key 3 of 6.FDEP, CONANP, Esri, HERE, Garmin, SafeGraph, GeoTechnologies, Inc, METI/NASA, USGS, EPA, NPS, US Census Bureau, USDA, FDEP, CONANP, Esri, HERE, Garmin, SafeGraph, GeoTechnologies, Inc, METI/NASA, USGS, EPA, NPS, USDA, Esri, DeLorme, NaturalVue
Shoreline Position 2021
Shoreline Position 201 8
Shoreline Position
Transect
Change / Yr 201 8 to 2021
B i g - 23. 1 m - - 1 5 . 0 m
L a g
o o n
- 1 4. 9 m - - 1 0. 0 m
- 9. 9 m - - 5 . 0 m
- 4. 9 m - 5 . 0 m
5 . 1 m - 1 0. 0 m
1 0. 1 m - 1 5 . 0 m
ss
1 5 . 1 m - 26. 5 m
Pa
Elevation Meters
a
NAVD- 8 8 ( Oct 2020)
o l
0. 2 - 0. 8
a c
26
0. 9 - 1 . 2
n s
1 .3 - 1 .9
Pe
2-3
0 0. 25 0. 5 1 Miles
3. 1 - 4. 9
0 25 0 5 00 1 ,000 Meters R 5 - 7. 9
Map Index
d o Ke y Fo r t Pic ke n s
Pe rd i
R
Figure B-4. End Point Rate for Fort Pickens and Perido Key 4 of 6.FDEP, CONANP, Esri, HERE, Garmin, SafeGraph, GeoTechnologies, Inc, METI/NASA, USGS, EPA, NPS, US Census Bureau, USDA, FDEP, CONANP, Esri, HERE, Garmin, SafeGraph, GeoTechnologies, Inc, METI/NASA, USGS, EPA, NPS, USDA, Esri, DeLorme, NaturalVue
Shoreline Position 2021
Shoreline Position 201 8
Shoreline Position
Transect
Change / Yr 201 8 to 2021
- 23. 1 m - - 1 5 . 0 m
o n
B i g L a g -o1 4. 9 m - - 1 0. 0 m
- 9. 9 m - - 5 . 0 m
- 4. 9 m - 5 . 0 m
5 . 1 m - 1 0. 0 m
1 0. 1 m - 1 5 . 0 m
1 5 . 1 m - 26. 5 m
Elevation Meters
NAVD- 8 8 ( Oct 2020)
0. 2 - 0. 8
27
0. 9 - 1 . 2
1 .3 - 1 .9
2-3
0 0. 25 0. 5 1 Miles
3. 1 - 4. 9
0 25 0 5 00 1 ,000 Meters R 5 - 7. 9
Map Index
d o Ke y Fo r t Pic ke n s
Pe rd i
R
Figure B-5. End Point Rate for Fort Pickens and Perido Key 5 of 6.FDEP, CONANP, Esri, HERE, Garmin, SafeGraph, GeoTechnologies, Inc, METI/NASA, USGS, EPA, NPS, US Census Bureau, USDA, FDEP, CONANP, Esri, HERE, Garmin, SafeGraph, GeoTechnologies, Inc, METI/NASA, USGS, EPA, NPS, USDA, Esri, DeLorme, NaturalVue
Shoreline Position 2021
Shoreline Position 201 8
Shoreline Position
Transect
Change / Yr 201 8 to 2021
- 23. 1 m - - 1 5 . 0 m
- 1 4. 9 m - - 1 0. 0 m
d ar y
- 9. 9 m - - 5 . 0 m
- 4. 9 m - 5 . 0 m
B o un
5 . 1 m - 1 0. 0 m
P a rk
1 0. 1 m - 1 5 . 0 m
1 5 . 1 m - 26. 5 m
Elevation Meters
NAVD- 8 8 ( Oct 2020)
0. 2 - 0. 8
28
0. 9 - 1 . 2
1 .3 - 1 .9
2-3
0 0. 25 0. 5 1 Miles
3. 1 - 4. 9
0 25 0 5 00 1 ,000 Meters R 5 - 7. 9
Map Index
d o Ke y Fo r t Pic ke n s
Pe rd i
R
Figure B-6. End Point Rate for Fort Pickens and Perido Key 6 of 6.CONANP, Esri, HERE, Garmin, SafeGraph, GeoTechnologies, Inc, METI/NASA, USGS, EPA, NPS, US Census Bureau, USDA, Esri, DeLorme, NaturalVue, CONANP, Esri, HERE, Garmin, SafeGraph, METI/NASA, USGS, EPA, NPS, USDA
Shoreline Position 2021
Shoreline Postition 201 8
Reference Transect
Island Width Transect
Change / Yr 201 8 to 2021
- 69. 0 - - 30. 0
- 29. 9 - - 1 5 . 0
- 1 4. 9 - - 5 . 0
- 4. 9 - 5 . 0
5.1 - 1 5.0
1 5 . 1 - 30. 0
30. 1 - 61 . 6
Elevation Meters
NAVD- 8 8 ( Oct 2020)
29
0. 2 - 0. 8
0. 9 - 1 . 2
1 .3 - 1 .9
2-3
0 0. 25 0. 5 1 Miles
3. 1 - 4. 9
0 25 0 5 00 1 ,000 Meters R 5 - 7. 9
Petit Bois
Island
West Petit
R
Horn Island Bois Island
Figure B-7. Island Width Rate for Petit Bois, West Petit Bois and Horn Islands 1 of 9.CONANP, Esri, HERE, Garmin, SafeGraph, GeoTechnologies, Inc, METI/NASA, USGS, EPA, NPS, US Census Bureau, USDA, Esri, DeLorme, NaturalVue, CONANP, Esri, HERE, Garmin, SafeGraph, METI/NASA, USGS, EPA, NPS, USDA
Shoreline Position 2021
Shoreline Postition 201 8
Reference Transect
Island Width Transect
Change / Yr 201 8 to 2021
- 69. 0 - - 30. 0
- 29. 9 - - 1 5 . 0
- 1 4. 9 - - 5 . 0
- 4. 9 - 5 . 0
Mi s s i s
s i ppi 5.1 - 1 5.0
S o u n d
1 5 . 1 - 30. 0
30. 1 - 61 . 6
Elevation Meters
NAVD- 8 8 ( Oct 2020)
30
0. 2 - 0. 8
0. 9 - 1 . 2
1 .3 - 1 .9
2-3
0 0. 25 0. 5 1 Miles
3. 1 - 4. 9
R
5 - 7. 9
0 25 0 5 00 1 ,000 Meters
Petit Bois
Island
West Petit
R
Horn Island Bois Island
Figure B-8. Island Width Rate for Petit Bois, West Petit Bois and Horn Islands 2 of 9.CONANP, Esri, HERE, Garmin, SafeGraph, GeoTechnologies, Inc, METI/NASA, USGS, EPA, NPS, US Census Bureau, USDA, Esri, DeLorme, NaturalVue, CONANP, Esri, HERE, Garmin, SafeGraph, METI/NASA, USGS, EPA, NPS, USDA
Shoreline Position 2021
Shoreline Postition 201 8
Reference Transect
Island Width Transect
Change / Yr 201 8 to 2021
n d - 69. 0 - - 30. 0
pi S o u
s s i p - 29. 9 - - 1 5 . 0
i s s i
- 1 4. 9 - - 5 . 0
- 4. 9 - 5 . 0
5.1 - 1 5.0
1 5 . 1 - 30. 0
30. 1 - 61 . 6
Elevation Meters
NAVD- 8 8 ( Oct 2020)
31
0. 2 - 0. 8
0. 9 - 1 . 2
1 .3 - 1 .9
2-3
0 0. 25 0. 5 1 Miles
3. 1 - 4. 9
R
5 - 7. 9
0 25 0 5 00 1 ,000 Meters
Petit Bois
Island
West Petit
R
Horn Island Bois Island
Figure B-9. Island Width Rate for Petit Bois, West Petit Bois and Horn Islands 3 of 9.CONANP, Esri, HERE, Garmin, SafeGraph, GeoTechnologies, Inc, METI/NASA, USGS, EPA, NPS, US Census Bureau, USDA, Esri, DeLorme, NaturalVue, CONANP, Esri, HERE, Garmin, SafeGraph, METI/NASA, USGS, EPA, NPS, USDA
Shoreline Position 2021
Shoreline Postition 201 8
Reference Transect
Island Width Transect
Change / Yr 201 8 to 2021
d - 69. 0 - - 30. 0
n
u - 29. 9 - - 1 5 . 0
o
S
i - 1 4. 9 - - 5 . 0
p
p
s si - 4. 9 - 5 . 0
si 5.1 - 1 5.0
is
M 1 5 . 1 - 30. 0
30. 1 - 61 . 6
Elevation Meters
NAVD- 8 8 ( Oct 2020)
32
0. 2 - 0. 8
0. 9 - 1 . 2
1 .3 - 1 .9
2-3
0 0. 25 0. 5 1 Miles
3. 1 - 4. 9
5 - 7. 9
0 25 0 5 00 1 ,000 Meters
R
Petit Bois
Island
West Petit
R
Horn Island Bois Island
Figure B-10. Island Width Rate for Petit Bois, West Petit Bois and Horn Islands 4 of 9.CONANP, Esri, HERE, Garmin, SafeGraph, GeoTechnologies, Inc, METI/NASA, USGS, EPA, NPS, US Census Bureau, USDA, Esri, DeLorme, NaturalVue, CONANP, Esri, HERE, Garmin, SafeGraph, METI/NASA, USGS, EPA, NPS, USDA
Shoreline Position 2021
Shoreline Postition 201 8
Reference Transect
Island Width Transect
Change / Yr 201 8 to 2021
- 69. 0 - - 30. 0
- 29. 9 - - 1 5 . 0
- 1 4. 9 - - 5 . 0
- 4. 9 - 5 . 0
5.1 - 1 5.0
1 5 . 1 - 30. 0
30. 1 - 61 . 6
Elevation Meters
NAVD- 8 8 ( Oct 2020)
33
0. 2 - 0. 8
0. 9 - 1 . 2
1 .3 - 1 .9
2-3
0 0. 25 0. 5 1 Miles
3. 1 - 4. 9
0 25 0 5 00 1 ,000 Meters R 5 - 7. 9
Petit Bois
Island
West Petit
R
Horn Island Bois Island
Figure B-11. Island Width Rate for Petit Bois, West Petit Bois and Horn Islands 5 of 9.CONANP, Esri, HERE, Garmin, SafeGraph, GeoTechnologies, Inc, METI/NASA, USGS, EPA, NPS, US Census Bureau, USDA, Esri, DeLorme, NaturalVue, CONANP, Esri, HERE, Garmin, SafeGraph, METI/NASA, USGS, EPA, NPS, USDA
Shoreline Position 2021
Shoreline Postition 201 8
Reference Transect
Island Width Transect
Change / Yr 201 8 to 2021
- 69. 0 - - 30. 0
Mi s s i s s i ppi - 29. 9 - - 1 5 . 0
S o u n d
- 1 4. 9 - - 5 . 0
- 4. 9 - 5 . 0
5.1 - 1 5.0
1 5 . 1 - 30. 0
30. 1 - 61 . 6
Elevation Meters
NAVD- 8 8 ( Oct 2020)
34
0. 2 - 0. 8
0. 9 - 1 . 2
1 .3 - 1 .9
2-3
0 0. 25 0. 5 1 Miles
3. 1 - 4. 9
R
5 - 7. 9
0 25 0 5 00 1 ,000 Meters
Petit Bois
Island
West Petit
R
Horn Island Bois Island
Figure B-12. Island Width Rate for Petit Bois, West Petit Bois and Horn Islands 6 of 9.CONANP, Esri, HERE, Garmin, SafeGraph, GeoTechnologies, Inc, METI/NASA, USGS, EPA, NPS, US Census Bureau, USDA, Esri, DeLorme, NaturalVue, CONANP, Esri, HERE, Garmin, SafeGraph, METI/NASA, USGS, EPA, NPS, USDA
Shoreline Position 2021
Shoreline Postition 201 8
Reference Transect
Island Width Transect
Change / Yr 201 8 to 2021
- 69. 0 - - 30. 0
- 29. 9 - - 1 5 . 0
- 1 4. 9 - - 5 . 0
- 4. 9 - 5 . 0
D a t a 5.1 - 1 5.0
G a p
D a t a G a p 1 5 . 1 - 30. 0
30. 1 - 61 . 6
Elevation Meters
NAVD- 8 8 ( Oct 2020)
35
0. 2 - 0. 8
0. 9 - 1 . 2
1 .3 - 1 .9
2-3
0 0. 25 0. 5 1 Miles
3. 1 - 4. 9
R
5 - 7. 9
0 25 0 5 00 1 ,000 Meters
Petit Bois
Island
West Petit
R
Horn Island Bois Island
Figure B-13. Island Width Rate for Petit Bois, West Petit Bois and Horn Islands 7 of 9.CONANP, Esri, HERE, Garmin, SafeGraph, GeoTechnologies, Inc, METI/NASA, USGS, EPA, NPS, US Census Bureau, USDA, Esri, DeLorme, NaturalVue, CONANP, Esri, HERE, Garmin, SafeGraph, METI/NASA, USGS, EPA, NPS, USDA
Shoreline Position 2021
Shoreline Postition 201 8
Reference Transect
Island Width Transect
Change / Yr 201 8 to 2021
- 69. 0 - - 30. 0
d - 29. 9 - - 1 5 . 0
u n
i S o
- 1 4. 9 - - 5 . 0
s s i pp
s s i - 4. 9 - 5 . 0
Mi
5.1 - 1 5.0
D a
t a 1 5 . 1 - 30. 0
G a
p 30. 1 - 61 . 6
Elevation Meters
NAVD- 8 8 ( Oct 2020)
36
0. 2 - 0. 8
0. 9 - 1 . 2
1 .3 - 1 .9
2-3
0 0. 25 0. 5 1 Miles
3. 1 - 4. 9
0 25 0 5 00 1 ,000 Meters R 5 - 7. 9
Petit Bois
Island
West Petit
R
Horn Island Bois Island
Figure B-14. Island Width Rate for Petit Bois, West Petit Bois and Horn Islands 8 of 9.CONANP, Esri, HERE, Garmin, SafeGraph, GeoTechnologies, Inc, METI/NASA, USGS, EPA, NPS, US Census Bureau, USDA, Esri, DeLorme, NaturalVue, CONANP, Esri, HERE, Garmin, SafeGraph, METI/NASA, USGS, EPA, NPS, USDA
Shoreline Position 2021
Shoreline Postition 201 8
Reference Transect
Island Width Transect
Change / Yr 201 8 to 2021
- 69. 0 - - 30. 0
- 29. 9 - - 1 5 . 0
- 1 4. 9 - - 5 . 0
- 4. 9 - 5 . 0
5.1 - 1 5.0
1 5 . 1 - 30. 0
Dog Keys 30. 1 - 61 . 6
Pass Elevation Meters
NAVD- 8 8 ( Oct 2020)
37
0. 2 - 0. 8
0. 9 - 1 . 2
1 .3 - 1 .9
2-3
0 0. 25 0. 5 1 Miles
3. 1 - 4. 9
0 25 0 5 00 1 ,000 Meters R 5 - 7. 9
Petit Bois
Island
West Petit
R
Horn Island Bois Island
Figure B-15. Island Width Rate for Petit Bois, West Petit Bois and Horn Islands 9 of 9.The Department of the Interior protects and manages the nation’s natural resources and cultural heritage; provides scientific and other information about those resources; and honors its special responsibilities to American Indians, Alaska Natives, and affiliated Island Communities. NPS 635/179861, March 2022
National Park Service
U.S. Department of the Interior

Natural Resource Stewardship and Science
1201 Oak Ridge Drive, Suite 150
Fort Collins, Colorado 80525

E X P E R I E N C E Y O U R A M E R I C A™
You can also read