Ship Domain Variations in the Strait of Istanbul - GDMC
←
→
Page content transcription
If your browser does not render page correctly, please read the page content below
Ship Domain Variations
                     in the Strait of Istanbul
                 Yigit Can Altan1                          Martijn Meijers

           Department of Civil Engineering       Chair of GIS-technology, Section Digital
                Faculty of Engineering               Technologies, Department AE+T
             Ozyegin University, Turkey             Faculty of Architecture and the Built
            yigitcan.altan@ozyegin.edu.tr                       Environment
                                             Delft University of Technology, The Netherlands
                                                          b.m.meijers@tudelft.nl

Abstract
The aim of this study is to analyze and understand the clear distance of the ship
encounters in the Strait of Istanbul. According to a GIS analysis, the site-specific ship
domain is calculated. The maritime traffic is gathered from long-term AIS data. The
Spatio-temporal analyzes are conducted with the aid of geographic database
management software. The output of the analysis gives the distance between the
ships during their encounters. Based on the clear distance, statistical analysis is
conducted for creating the shape and size of the ship domain. Besides the clear
distance, relative velocity, ship sizes are also recorded to find out the inside
information for the ship domain.
The size and shape of the ship domain are found and the effect of parameters such
as relative velocity and ship length on the ship domain is discussed. The parameters
that are affecting the ship domain are discussed and inside information is given.
The ship domain variations are found out for the Strait of Istanbul. The relationship
between the parameters and the ship domain can give inside information for
congested waterways.

Keywords: ship domain, AIS, big data analysis, Strait of Istanbul, vessel movement
analysis, massive movement data, restricted waterways

Introduction
Waterway transport constitutes 90% of the world trade, and cargo volumes represent
a higher increase than the world economic growth rate (Kaluza et al., 2010). Also,
the policy initiatives such as Green Deal encourage usage of waterway
transportation in order to decrease the emission rates due to freight transport. As a
result, the traffic load on waterways will increase and this increase will especially
1
    Corresponding author.

                                                                                               1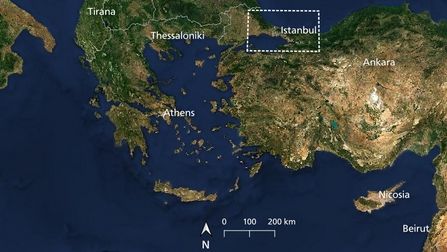
affect the narrow passages such as straits and inland waterways due to restricted
navigational conditions.

In this study, the complex ship encounter mechanism is studied via long-term traffic
data analysis. The end-product of this analysis will give us the general ship domain
and the variations of ship domain according to parameter changes such as ship
speed, length, relative velocity, day/night condition and ship type in the Strait of
Istanbul (SoI), cf. Figure 1. During the analysis one month traffic data for August
2015 is used and the statistical calculation methodology of the ship domain is
conducted with some certain improvements to reflect the real navigational
conditions. One of most important ones is the usage of physical sizes of the ships to
find out the clear area between the ships. It allows to understand the behavior of the
captains during an encounter. Because, during the encounters captains make their
assessments according to ship’s physical sizes and clear distance between the ships
perimeter rather than ship centers.

The remaining part of this paper is organized as follows. Section 2 gives related
work. Section 3 explains the methodology, the source of data and tools used for
processing the data. Section 4 presents results with associated discussion. Finally,
Section 5 covers the conclusions of the study and describes future work.

                    (a)                                        (b)
Figure 1: (a) Study area: Strait of Istanbul (Bosporus) (b) Vessel movement intensity
                     in the Strait of Istanbul during August, 2015

Related work
The traffic density increase will have a direct effect on the number of encounters
which can cause risky situations. The approaches to evaluate the encounter risk
level of the waterway can be classified in two sub-groups. One of the sub-groups use
the collision diameter to quantify the encounter of the ships (Altan and Otay, 2018;
Christian and Kang, 2017; Kujala et al., 2009; Lušić and Čorić, 2015; Montewka et
al., 2010; Pedersen, 1995; Silveira et al., 2013). The physical contact distance
between the ships are calculated for the given approach geometry and with the aid

                                                                                       2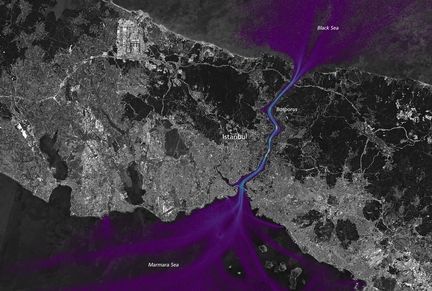
of traffic data, the collision frequency of the waterway is calculated. The other group
uses the risky encounter of the ships as near miss (Yoo, 2018; Zhang et al., 2016,
2015) and ship domain (Hansen et al., 2013; Hsu, 2014; Pietrzykowski and Uriasz,
2009; Szlapczynski et al., 2018; Szlapczynski and Szlapczynska, 2017; Wang et al.,
2009; Wang and Chin, 2016).

The advantage of the collision diameter approach is its robust calculation
methodology. It only depends on the geometric conditions of the two ships that are
approaching each other (Altan, 2019). The disadvantage of the collision diameter is
its under-estimation of the risky encounters in day-to-day navigation conditions. This
lack is covered by the risky encounter approaches. However, application of risky
encounter calculation methodologies is not straight forward. The calculation
methodologies are changing according to certain parameters (such as traffic density,
relative velocity, sizes of the ships, etc.) and have to be investigated according to
site-specific navigational conditions.

When the risky encounter methodologies are tried to be applied to congested
waterways the complications increase. In the case of the Strait of Istanbul (SoI), the
local traffic creates nearly 75% of the total passages (Altan and Otay, 2017). Thus,
they dominate the traffic density and their familiarity to the waterway affects the
behaviour during an encounter. On the other hand, transit vessels have the right of
way during an encounter. In addition to these facts, there is strong current variation
along the SoI. This situation shows that it is not straightforward to calculate the risky
encounters of the vessels in the SoI.

Considering the listed complications, this study focused on developing the basis for
the risky encounter calculation methodology. As a first step the ship domain for the
SoI is calculated based on statistical methods and long-term AIS data.

Methodology
We perform a statistical calculation of the ship domain. Using geographic information
technology and AIS data, we present our methodology to calculate how the space
around ships is used (or kept free) during their movements. The approach is similar
to the known approach of Hörteborn et al., (2018), but differs in the sense that it
takes into account the real size of the ships.

The Automatic Identification System (AIS) broadcasts navigation-related information
over Very High Frequency (VHF) radio and can be received as National Marine
Electronics Association (NMEA) sentences. When NMEA sentences are parsed, AIS
messages related to navigation are obtained. The source of the navigation-related
messages can be ship-based or shore-based and messages can be received by
ships, coastal stations and satellites over AIS devices.

                                                                                            3
Figure 2: Number of AIS messages (position reports - message types 1, 2, 3)
received in the study area during August, 2015, per ship type
There are 27 different types of AIS messages. Type 1, 2, 3 and 5 messages
transmitting maritime traffic information are included in the analysis. The first three
types are the dynamic messages carrying automatically updated position and motion
information of a ship. Type 5 messages include static data describing the vessel type
and its dimensions. For the SoI AIS messages are gathered by means of an VHF
antenna and a receiver. Figure 2 shows the coverage of the AIS messages. The
messages that are used in this study were collected during August 2015.
4Figure 3: Analysis workflow overview The received messages were stored in the standardized NMEA text format and are parsed (using Python) and loaded in a geographic database management system (PostgreSQL extended with PostGIS) for analysis (Figure 3, white boxes). Using the position, the ship identifier (MMSI) and timestamp (which was added by the receiving station) obtained from the position reports (AIS type 1,2,3 messages), we construct a trajectory for each vessel and store this as 3D line segments, where two dimensions are used for the position (x, y) and the third dimension is the time in seconds since January 1970 (unix timestamp). A segment is only created if it looks reasonable (i.e.
position messages. Per segment we also have access to the original movement
attributes in the position report, like course over ground, speed and heading of the
ship. The 3D segments are then indexed and physically clustered on disk using an
R-tree, allowing to search efficiently for space-time segments that occur close in
space and time (Figure 3, blue boxes; this step has been executed fully within the
database using SQL).

While iterating over all starting points of all segments, a 3D square positioned with its
center on the starting point of the segment is created, where the z-coordinate is set
to the time of the space-time segment. We used a size of 5x5km for each search
square. All segments intersecting this square for ships in the vicinity of the own ship
are found. The ships in the vicinity that we find are what we call the ‘target ships’.
This leads to a new database table with pairs of own and target ships that have been
in each other’s vicinity (Figure 3, orange box, executed within the database, using
SQL).

The table of co-occuring vessels forms the basis for the further analysis. Per found
ship pair, we enrich the table with their relative velocity, the encouter type (head-on,
overtaking, crossing) and we interpolate the position of the target ship and its GPS
receiver to the time of the own ship.

Subsequently, we use the information from the AIS static reports (type 5 messages)
to get a description of the rectangular geometry of the ship (as the GPS receiver
giving the location of the vessel might be placed excentric on the ship). We orient
(rotate) this rectangle using the course over ground value found in the position report
of the target ship. We have ignored the pairs, for which no ship size information has
been present.

Next, we translate and rotate the geometry of all target ships their oriented
rectangles to a local coordinate system, where the center of the own ship is defining
the new local origin and the course over ground of the own ship is set northwards,
while preserving the relative position of the ship pair its geometries (Figure 3, yellow
boxes; this step has been executed with SQL in the database).

Relevant oriented rectangles of the target ships (in the local coordinate system of the
own ship, with the course over ground of the own ship set to north) are rasterized to
a count raster having 1x1m cell resolution. Note that for this raster we can either use
all ship pairs, or first make a subselection to analyse if there is an influence of this
subset on the ship domain contours (see Results and discussion). From the center of
the raster (which corresponds with the center of all own ships), we cast finite rays
outwards, with an angular resolution of 1 degree, while setting a maximum distance
on the ray (1km, 2.5km). We intersect every ray with the raster cells, obtaining a
count and position for every intersection. Moreover, we record for every point to
which ray the point belongs. This then allows us to compute a cumulative distribution

                                                                                           6
of the counts along each ray, giving us a description of how space around the own
ship is used along this ray. By thresholding the distribution along the ray (e.g. 10%
and 25%) and connecting the locations found in a circular manner, we obtain the
ship domain contour. Finally, we can visualize the obtained ship domain contours
(Figure 3, green boxes; this step has been executed using GDAL for rasterization,
the functionality “Profiles from Lines” provided by Saga GIS, a custom Python script
to compute the cumulative distribution and contours and QGIS for visualizing the
resulting information).
Results and discussion
By using the long-term AIS data analysis, the occupied area around the own ship
with the usage frequency is determined. According to usage percentage along the
constructed rays the ship domain is developed. The main outcome of the analysis
shows a ship domain with an ellipsoid shape.
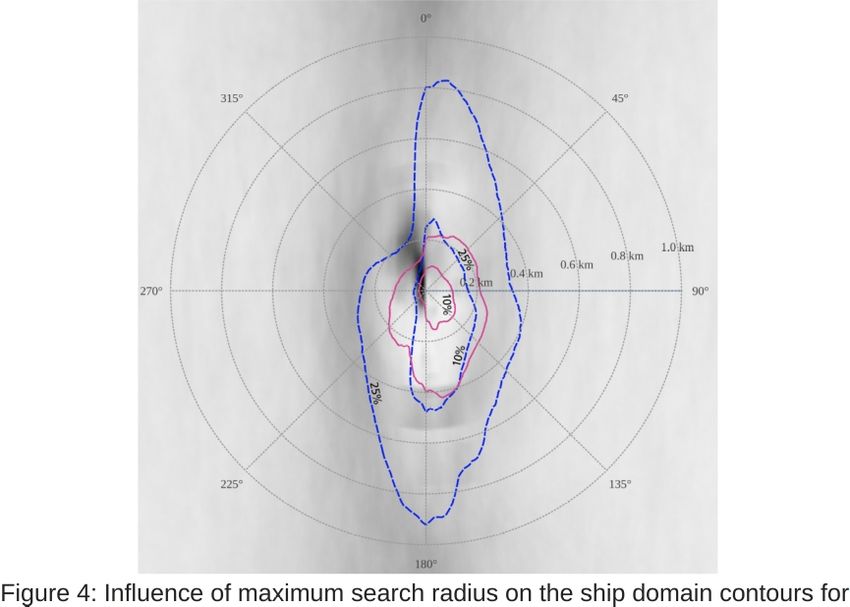
10% and 25% usage (maximum search radius for blue: 2.5km, red: 1.0km)
The search radius around the own ship determines the number of encounters. Two
different search radii are used for the general ship domain analysis. Figure 4 shows
the influence of choosing the parameter of the maximum search radius. Blue lines
and red lines indicate the search radius for the target ships with a value of 2.5km and
1.0 km, respectively. As explained in the methodology section 10% and 25% usage
along the rays are indicated in the figure. Shapes are similar for both 2.5km and 1.0
7km search radius. The ships approaching from starboard side keep more distance
when compared to ones that are approaching from port side which is in alignment
with the Collision Regulations (COLREG).
Hörteborn et al., (2018) used 5% for the inner limit of the ship domain, since it
represents 2σ in a normal distribution. When 5% usage is found for the SoI, the ship
domain is a quite small polygon around the origin. There are two explanations for
this outcome. One of them is the congestion level of the SoI. Due to congestion
ships are passing closer to each other compared to open sea conditions. The
second one is the usage of physical dimensions of the ships at the ship domain
methodology. Since we use the physical sizes of the ships they occupy larger areas
in the search radius. Also, the pair of own ship and target ship will appear more than
once in the resulting raster for each pair when compared to representing each target
ship with just one point. As a result 5% usage will be closer to the own ship. With
these outcomes, the following results are found for 1.0km search radius and 10%
and 25% usage areas.
The first parametric analysis is the day/night condition. In the analysis, day and night
are chosen as 07h00-19h00, 19h00-07h00 next day, respectively. As can be seen in
Figure 5, during day ships keep less distance than during the night. During the day
time ship domain displays a more ellipsoid shape when compared to night time’s
circular shape. The result indicates that captains’ clear distance changes according
to visibility conditions. Also, we suspect that during the day time local ships are
traveling more frequently and their familiarity to the waterway decreases the clear
distance between the ships.
8Figure 6: Approach angles: crossing, takeover, head-on (ΔCOG).
The third parametric analysis is conducted for the approach types according to
Course Over Ground difference (ΔCOG) as listed below (in alignment with Chang,
Hsiao and Wang, 2014):
● Head-on: 170° < ΔCOG < 190°;
● Overtaking: 0° < ΔCOG < 67.5° or 292.5° < ΔCOG < 360°;
● Crossing ΔCOG outside the range of the above cases.
Figure 6 shows that the encounter type changes the shape and size of the ship
domain. Opposite from head-on encounter, takeover vessels move back to their
original lane after takeover has finished. Crossing vessels show a circular pattern for
the ship domain.
The vessels are approaching to each other according to their relative velocities.
Therefore, it is expected that the relative velocity changes the risk perception during
the navigation. In this analysis two different relative classes are used as low relative
velocity: 14.4 knots, with relative velocity
defined as in Equation 1, (Silveira et al., 2014).
92
√v own + v target 2−2 ⋅ v own ⋅ v target ⋅ cos(co g own−co gtarget ) (1)
As Figure 7 clearly shows vessels with high relative velocity keep more distance,
than vessels with low relative velocity.
Figure 8: Own velocities
Similar to relative velocity, own ship’s velocity affects the risk perception. To analyze
the own ship velocity effect, three different groups are created as given:
● low: speed < 5.6 knots;
● medium: 5.6 knots = 10.2 knots.
Figure 8 shows that as the own ship speed increases not only the size of the ship
domain increases but also the pattern of the domain changes. This change can
especially be observed as an increase of the ship domain at the bow part clearance
area.
Figure 9: Length Over-All (LOA)
10The effect of the ship size on ship domain is analyzed based on the Length Overall
(LOA) of the vessels. Therefore two groups with small LOA 157m are defined. As given in Figure 9, the LOA of the own ship affects the size
and shape of the ship domain. For large LOA, at 10% usage area there are two
notches at the stern side of the own ship. The main reason is the ships passing from
the stern part of the ships keep away from the large ship’s wake zone. Also, the ship
domain for large LOA, represents a more clear area in the bow part of the own ship.
It shows that ships do not prefer to pass from the bow side of the ship when the own
ship’s LOA is large.
Figure 10: Vessel Type: Cargo versus Towing
As the last parametric analysis is conducted for the ship type as cargo and tug boats
(Figure 10). The ship types are determined according to shiptype information from
static AIS messages. The shiptype with 31 and 32 is taken as towing and between
70 and 79 is taken as cargo. Ship domain is found as a nearly perfect ellipsoid shape
for cargo, with minor and major axis length for 10% and 25% of 400m by 1,000m and
600m by 1,200m respectively. Towing vessels show big differences according to
their position with respect to the target ship. When towing vessels are at the front of
the target ship they keep close to target ships but when they are the stern part they
keep away from the target ship. Also, 10% and 25% showing close lines which
indicates they are showing similar behavior during their encounters.
Conclusions
We have given a ship domain definition by analysing large volume of AIS data for
different parameters (day/night condition, approach angle, relative velocity, own
velocity, LOA and ship type). An important contribution is that in the analysis we
consider the space the vessels occupy on the water way by taking into account their
physical size. The outcome of the encounter analysis shows that the ship domain
shape and size changes according to navigational conditions during the encounter.
11The comparison between day and night shows that visibility has a limited, but
noticable effect on the ship domain. The approach angle of the vessel pairs has an
influence on the size and shape of the ship domain. The domain follows an ellipsoid
shape for head-on and takeover encounters, while a circular pattern is observed for
crossing encounters. According to parametric analysis, the risk perception is
changing with the speed of the ships. One of the analyzed parameters is the own
ship speed, the other one is the relative velocity of the ships. The analysis shows
that ship domain is sensitive to these parameters.
Unlike the earlier result of Hörteborn, et al., (2018), we found that LOA is affecting
the ship domain in terms of size and shape. Target ships keep more distance to
ships with larger LOA. Also, navigational patterns are different when compared with
small LOA ships. One more important effect on the ship domain in terms of size and
shape is observed at the ship type. The ship domain around the cargo ships is
ellipsoid however, for the tug boats it is a complex shape.
Although not looked at in detail in this study, the maximum radius to search for close
vessels has an effect on the final ship domain its size (the larger the radius, the
larger the size of the found ship domains). The visual comparison that we carried out
of 2.5km and 1.0 km search radius, did not show that the shapes of the ship domains
differ enormously. However, a more in-depth analysis should be carried out what is
the effect of the search radius parameter in connection to the geography of the study
area (is it different for a different location, what is the correct search radius).
To understand the ship domain and parametric effect further analysis can be
conducted with combined parameters (e.g. analyse the combination of large LOA
combined with approach angle, in comparison with small LOA plus approach angle).
The result of the analysis will help to understand the parameter clusters that affect
the ship domain. With the usage of these clusters a further analysis can be
conducted for the risk level of the encounters.
In addition to combined parameter analysis, using the ship domain risky encounters
can be quantified and we can find the hotspot locations on the water way via AIS
data. The data model of ship pairs we have used also keeps for every pair of ships
the original location on the water way. Those pairs for which the target ship occurs
inside the ship domain contour give the locations for further investigation. Last but
not least, the methodology can be applied to other waterways to make comparative
analysis.
12References
Altan, Y.C., 2019. Collision Diameter for Maritime Accidents Considering the Drifting
of Vessels. Ocean Eng. 187, 106158.
https://doi.org/10.1016/j.oceaneng.2019.106158
Altan, Y.C., Otay, E.N., 2018. Spatial mapping of encounter probability in congested
waterways using AIS. Ocean Eng. 164, 263–271.
https://doi.org/10.1016/j.oceaneng.2018.06.049
Altan, Y.C., Otay, E.N., 2017. Maritime Traffic Analysis of the Strait of Istanbul based
on AIS data. J. Navig. 70. https://doi.org/10.1017/S0373463317000431
Christian, R., Kang, H.G., 2017. Probabilistic risk assessment on maritime spent
nuclear fuel transportation (Part II: Ship collision probability). Reliab. Eng. Syst.
Saf. 164, 136–149. https://doi.org/10.1016/j.ress.2016.11.017
Hansen, M.G., Jensen, T.K., Lehn-Schioler, T., Melchild, K., Rasmussen, F.M.,
Ennemark, F., 2013. Empirical ship domain based on AIS data. J. Navig. 66,
931–940. https://doi.org/10.1017/S0373463313000489
Hörteborn, A., Ringsberg, J.W., Svanberg, M., Holm, H., 2018. A Revisit of the
Definition of the Ship Domain based on AIS Analysis. J. Navig. 1–18.
https://doi.org/10.1017/S0373463318000978
Hsu, H.-Z., 2014. Safety Domain Measurement for Vessels in an Overtaking
Situation. Int. J. e-Navigation Marit. Econ. 1, 29–38.
https://doi.org/10.1016/j.enavi.2014.12.004
Kaluza, P., Kölzsch, A., Gastner, M.T., Blasius, B., Kaluza, P., Ko, A., Gastner, M.T.,
2010. The complex network of global cargo ship movements The complex
network of global cargo ship movements. https://doi.org/10.1098/rsif.2009.0495
Kujala, P., Hänninen, M., Arola, T., Ylitalo, J., 2009. Analysis of the marine traffic
safety in the Gulf of Finland. Reliab. Eng. Syst. Saf. 94, 1349–1357.
https://doi.org/10.1016/j.ress.2009.02.028
Lušić, Z., Čorić, M., 2015. Models for estimating the potential number of ship
collisions. J. Navig. 68, 735–749. https://doi.org/10.1017/S0373463314000903
Montewka, J., Hinz, T., Kujala, P., Matusiak, J., 2010. Probability modelling of vessel
collisions. Reliab. Eng. Syst. Saf. 95, 573–589.
https://doi.org/10.1016/j.ress.2010.01.009
Pedersen, P.T., 1995. Collision and Grounding Mechanics, in: Proceedings of
WEMT. pp. 125–157.
Pietrzykowski, Z., Uriasz, J., 2009. The ship domain - A criterion of navigational
safety assessment in an open sea area. J. Navig. 62, 93–108.
https://doi.org/10.1017/S0373463308005018
Silveira, P.A.M., Teixeira, A., Soares, C., 2014. Assessment of ship collision
estimation methods using AIS data. Marit. Technol. Eng. 195–204.
https://doi.org/10.1201/b17494-27
Silveira, P.A.M., Teixeira, A.P., Soares, C.G., 2013. Use of AIS data to characterise
marine traffic patterns and ship collision risk off the coast of Portugal. J. Navig.
66, 879–898. https://doi.org/10.1017/S0373463313000519
Szlapczynski, R., Krata, P., Szlapczynska, J., 2018. Ship domain applied to
determining distances for collision avoidance manoeuvres in give-way
situations. Ocean Eng. 165, 43–54.
https://doi.org/10.1016/j.oceaneng.2018.07.041
Szlapczynski, R., Szlapczynska, J., 2017. Review of ship safety domains: Models
and applications. Ocean Eng. 145, 277–289.
13https://doi.org/10.1016/j.oceaneng.2017.09.020
Wang, N., Meng, X., Xu, Q., Wang, Z., 2009. A unified analytical framework for ship
domains. J. Navig. 62, 643–655. https://doi.org/10.1017/S0373463309990178
Wang, Y., Chin, H.C., 2016. An Empirically-Calibrated Ship Domain as a Safety
Criterion for Navigation in Confined Waters. J. Navig. 69, 257–276.
https://doi.org/10.1017/S0373463315000533
Yoo, S.L., 2018. Near-miss density map for safe navigation of ships. Ocean Eng.
163, 15–21. https://doi.org/10.1016/j.oceaneng.2018.05.065
Zhang, W., Goerlandt, F., Kujala, P., Wang, Y., 2016. An advanced method for
detecting possible near miss ship collisions from AIS data. Ocean Eng. 124,
141–156. https://doi.org/10.1016/j.oceaneng.2016.07.059
Zhang, W., Goerlandt, F., Montewka, J., Kujala, P., 2015. A method for detecting
possible near miss ship collisions from AIS data. Ocean Eng. 107, 60–69.
https://doi.org/10.1016/j.oceaneng.2015.07.046
14You can also read