Shape dependence of snow crystal fall speed
←
→
Page content transcription
If your browser does not render page correctly, please read the page content below
Atmos. Chem. Phys., 21, 7545–7565, 2021
https://doi.org/10.5194/acp-21-7545-2021
© Author(s) 2021. This work is distributed under
the Creative Commons Attribution 4.0 License.

Shape dependence of snow crystal fall speed
Sandra Vázquez-Martín1 , Thomas Kuhn1 , and Salomon Eliasson2
1 LuleåUniversity of Technology (LTU), Department of Computer Science, Electrical and Space Engineering,
Division of Space Technology, 98 128, Kiruna, Sweden
2 Swedish Meteorological and Hydrological Institute (SMHI), 601 76, Norrköping, Sweden

Correspondence: Thomas Kuhn (thomas.kuhn@ltu.se)

Received: 9 October 2020 – Discussion started: 26 October 2020
Revised: 27 February 2021 – Accepted: 4 March 2021 – Published: 18 May 2021

Abstract. Improved snowfall predictions require accurate           The effects of orientation and area ratio on the fall speed are
knowledge of the properties of ice crystals and snow parti-        also studied, and measurements show that vertically oriented
cles, such as their size, cross-sectional area, shape, and fall    particles fall faster on average. However, most particles for
speed. The fall speed of ice particles is a critical parameter     which orientation can be defined fall horizontally.
for the representation of ice clouds and snow in atmospheric
numerical models, as it determines the rate of removal of
ice from the modelled clouds. Fall speed is also required
for snowfall predictions alongside other properties such as        1   Introduction
ice particle size, cross-sectional area, and shape. For exam-
ple, shape is important as it strongly influences the scattering   The knowledge of the microphysical properties of atmo-
properties of these ice particles and thus their response to re-   spheric snow particles (ice crystals and snowflakes) is essen-
mote sensing techniques.                                           tial to achieve accurate realistic parameterizations in atmo-
   This work analyzes fall speed as a function of particle size    spheric models (e.g., Stoelinga et al., 2003; Tao et al., 2003).
(maximum dimension), cross-sectional area, and shape using         Also, the accuracy of many different remote sensing applica-
ground-based in situ measurements. The measurements for            tions, such as cloud and precipitation retrievals from satellite
this study were done in Kiruna, Sweden, during the snowfall        passive and active microwave measurements (Posselt et al.,
seasons of 2014 to 2019, using the ground-based in situ in-        2008; Zhang et al., 2009; Cooper and Garrett, 2010, and oth-
strument Dual Ice Crystal Imager (D-ICI). The resulting data       ers), is highly dependent on the assumptions made on the
consist of high-resolution images of falling hydrometeors          microphysical properties of snow particles. Some of these
from two viewing geometries that are used to determine par-        critical properties are particle size, particle size distribution,
ticle size (maximum dimension), cross-sectional area, area         cross-sectional area, area ratio, shape, orientation, and fall
ratio, orientation, and the fall speed of individual particles.    speed.
The selected dataset covers sizes from about 0.06 to 3.2 mm            Several studies have classified snow crystal shape ac-
and fall speeds from 0.06 to 1.6 m s−1 .                           cording to different classification schemes (Nakaya, 1954;
   Relationships between particle size, cross-sectional area,      Magono and Lee, 1966; Kikuchi et al., 2013; Vázquez-
and fall speed are studied for different shapes. The data show     Martín et al., 2020). Particle shape is essential, not only for
in general low correlations to fitted fall speed relationships     investigating growth processes but also because it affects
due to large spread observed in fall speed. After binning the      remote sensing measurements, for instance, radar measure-
data according to size or cross-sectional area, correlations       ments (e.g., Sun et al., 2011; Matrosov et al., 2012; Marc-
improve, and we can report reliable parameterizations of fall      hand et al., 2013) or passive measurements of microwave
speed vs. particle size or cross-sectional area for part of the    brightness temperatures (Kneifel et al., 2010). Furthermore,
shapes. For most of these shapes, the fall speed is better         it is of significant importance for optical remote sensing re-
correlated with cross-sectional area than with particle size.      trievals of cloud properties (see, e.g., Yang et al., 2008; Baum
                                                                   et al., 2011; Xie et al., 2011; Loeb et al., 2018) and snow

Published by Copernicus Publications on behalf of the European Geosciences Union.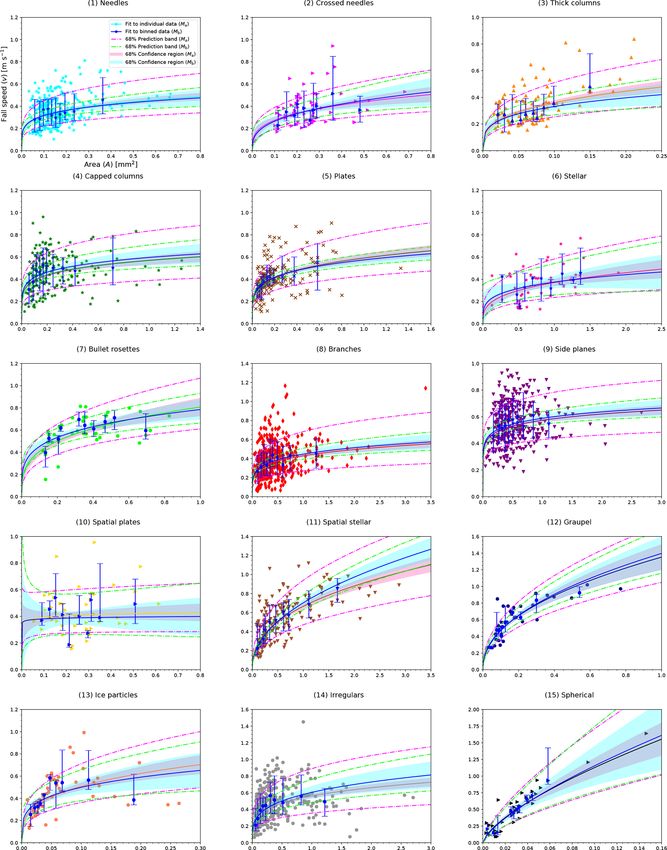
7546                                                    S. Vázquez-Martín et al.: Shape dependence of snow crystal fall speed

albedo (e.g., Jin et al., 2008). The physical properties of snow     and Vázquez-Martín, 2020). In a few studies, different func-
particles, including shape, govern their fall speed. For a given     tions are used to describe relationships. For example, Bart-
volume and density, non-spherical particles fall slower than         hazy and Schefold (2006) showed that an exponential func-
spheres (Haider, 1989). At the same size, shape variations           tion that asymptotically approaches a constant speed at larger
account for spread in fall speed, which causes variations in         sizes could also be used to describe the size dependence of
other properties such as the vertical mass flux of water (Dun-       fall speed, in particular for particles larger than about 3 mm.
navan, 2021). Therefore, also the particle shape is an impor-           This study analyzes the fall speed relationships of snow
tant parameter to ensure accurate cloud parameterizations in         particles as a function of particle size and cross-sectional
climate and forecast models (e.g., Stoelinga et al., 2003; Tao       area based on a dataset of falling natural snow particles that
et al., 2003), and for the understanding of precipitation in         have been collected in Kiruna in northern Sweden with the
cold climates.                                                       ground-based Dual Ice Crystal Imager (D-ICI) instrument
   Together with particle size and shape, the snow particle          presented in Kuhn and Vázquez-Martín (2020). Section 2 de-
orientation also plays a significant role. It is highly depen-       scribes the measurements and methods used to classify the
dent on the local aerodynamic conditions (Pruppacher and             snow particle shape and determine their size, cross-sectional
Klett, 1997), and significant uncertainties regarding particle       area, and fall speed. Section 3 investigates the influence of
orientation remain, especially for rimed particles and aggre-        the particle shape on relationships between fall speed and
gates (Xie et al., 2012; Jiang et al., 2019). The particle ori-      particle size or cross-sectional area. Furthermore, we exam-
entation determines its horizontal cross-sectional area and          ine the dependence of fall speed on area ratio and particle ori-
influences its drag and therefore its fall speed. Particle ori-      entation. These results are then compared to previous studies.
entation also affects the bulk scattering properties of clouds       Finally, this study is summarized and concluded in Sect. 4.
(Yang et al., 2008, 2011). For instance, for microwave radia-
tion, particle orientation significantly affects the radar reflec-
tivity (e.g., Sun et al., 2011; Gergely and Garrett, 2016) and,      2     Methods
due to its sizable impact on absorption (e.g., Foster et al.,
2000), strongly modulates the microwave brightness temper-           2.1    Measurements and instrument
ature (Xie and Miao, 2011; Xie et al., 2015).
   The fall speed of snow crystals plays a significant role          Our measurements are carried out in Kiruna, Sweden
in modeling microphysical precipitation processes (Schefold          (67.8◦ N, 20.4◦ E, at approximately 400 m above sea level),
et al., 2002) and for climate since it determines the lifetime       at a site described in Vázquez-Martín et al. (2020), using D-
of cirrus clouds, and thus the cloud coverage and ice wa-            ICI, the ground-based in situ instrument described in Kuhn
ter path (Mitchell et al., 2008), and the top-of-atmosphere          and Vázquez-Martín (2020). D-ICI captures and records dual
radiation budget (Westbrook and Sephton, 2017). Addition-            images of falling snow crystals and other hydrometeors. De-
ally, fall speed determines the snowfall rate, i.e., the rate of     tected particles are imaged simultaneously from two differ-
particle removal from clouds. The precipitation rate is pro-         ent viewing directions. One is horizontal, recording a side
portional to the fall speed of the particles, implying quan-         view, and one is close to vertical, recording a top view. From
titative forecasts of this variable require accurate snowflake       the top-view image, we can determine particle size, cross-
fall speeds (Westbrook and Sephton, 2017). Therefore, it is          sectional area, and area ratio. From the side-view image,
essential to know particle size, shape, and fall speed simulta-      since it is exposed twice, we can determine fall speed (see
neously.                                                             Sect. 2.2).
   Earlier studies have used different methods to investigate           These images have a high optical resolution of about
and parameterize the dependence of fall speed on snow parti-         10 µm, and one pixel corresponds to 3.7 µm. This resolution
cle size. Most parameterizations can be given as a power law         allows for the identification of snow particles even smaller
with general form v = aD · D bD , where v is the fall speed,         than 0.1 mm. The additional information that dual images
D is the particle size, and aD , bD are constant coefficients.       provide improves the shape classification carried out by look-
This power-law relationship is often adopted because it fa-          ing at both top- and side-view images. The particles are
cilitates analytical solutions in models, for instance, for cal-     classified according to their shape and sorted into 15 shape
culations of Doppler velocity, and appears in many studies           groups, as described in Vázquez-Martín et al. (2020).
(e.g., Locatelli and Hobbs, 1974; Heymsfield and Kajikawa,              More than 10 000 particles have been recorded during
1987; Mitchell, 1996; Barthazy and Schefold, 2006; Yuter             multiple snowfall seasons, the winters of 2014/2015 to
et al., 2006; Brandes et al., 2008; Heymsfield and Westbrook,        2018/2019. Each winter season at the Kiruna site lasts ap-
2010; Zawadzki et al., 2010; Lee et al., 2015). The depen-           proximately from the beginning of November to the middle
dence of fall speed on particle cross-sectional area is also         of May. Part of these data from 2014 to 2018 were selected to
readily represented as a power law, v = aA · AbA , where v is        carry out this work. During image processing (see Sect. 2.2),
the fall speed, A is the cross-sectional area, and aA , bA are       we only consider particles that are entirely in the field of
constant coefficients (e.g., Kuhn and Gultepe, 2016; Kuhn            view (FOV) and that are not significantly tumbling (for a

Atmos. Chem. Phys., 21, 7545–7565, 2021                                                https://doi.org/10.5194/acp-21-7545-2021
S. Vázquez-Martín et al.: Shape dependence of snow crystal fall speed                                                               7547

detailed description, see Kuhn and Vázquez-Martín, 2020).
Furthermore, the ambient wind speed is taken into account.
As mentioned in Kuhn and Vázquez-Martín (2020), higher
wind speeds may alter fall speed measurements. Therefore,
data taken at averaged wind speeds higher than 3 m s−1 are
excluded. The Swedish Meteorological and Hydrological In-
stitute (SMHI) weather data (SMHI, 2020), based on instru-
ments at the Kiruna airport, are recorded 6 km away from
our measurement site and provide the wind speed data used
in this study. After excluding FOV and tumbling problems,
about 3200 particles remained. Of these, 23 % were mea-
sured at wind speeds higher than 3 m s−1 , leaving a total of
2461 particles to form our dataset.

2.2    Snow properties

Figure 1 shows two different snow particles from the side           Figure 1. Two particle examples (a–b). Left: top-view images.
(right) and top views (left). The images from the top view          Right: side-view images, which are exposed twice to enable fall
are used to determine particle size, cross-sectional area, and      speed measurements. Both viewing geometries are used to classify
area ratio by the automated process presented in Kuhn and           the particle shape. In both examples, two pairs of points (P1 , P3 and
Vázquez-Martín (2020). For this, first, the background fea-         P2 , P4 ) were selected to determine the fall speed.
tures are removed; then the in-focus particles are detected
and their boundaries traced. Consequently, the particle prop-
erties, such as particle size, cross-sectional area, and area ra-
tio, can be determined. As we have described in Vázquez-            ping. In both cases, a manual procedure is carried out for the
Martín et al. (2020), the maximum dimension, Dmax , defined         fall speed determination, which is described in the following.
as the smallest diameter that completely encircles the particle        At least two points of the particle need to be selected, for
boundary in the top-view image, is used to describe the par-        instance, the left and right edges of the particle (P1 and P3 in
ticle size. Thus, in the following, particle size and maximum       Fig. 1, right). The same points are found by eye on the second
dimension are used synonymously. The cross-sectional area,          exposure (P2 and P4 in Fig. 1, right). The falling distance is
A, is defined as the area in the top-view image enclosed by         then the average of the Euclidean distances between P1 and
the particle boundary based on pixel count. Once the particle       P2 , and between P3 and P4 , and the fall speed is this falling
size and cross-sectional area are determined, the area ratio Ar     distance divided by the time between exposures. These fall
can be also calculated from these quantities:                       speeds are reported as they are measured at our local condi-
                                                                    tions and are not corrected to, for example, sea level pressure,
             A                                                      which would only change values by less than 3 %.
Ar =   π       2
                  .                                          (1)
       4   · Dmax                                                      By selecting at least two points on each particle to deter-
                                                                    mine fall speed, one can notice differences of the fall speed
   The aerodynamic drag, which chiefly governs fall speed,          across the particle. If there is no difference, then the particle
mostly depends on the quantities Dmax , A, and Ar , which are       is falling straight. If there is a difference, then the particle
retrieved using images that view the particles from above (in       is tumbling; i.e., it has a rotating motion in addition to the
the falling direction) as done by D-ICI, rather than from a         straight falling motion. Tumbling is most noticeable if the
horizontal viewing direction as done by other instruments.          rotation is around an axis perpendicular to the imaging plane.
Furthermore, this view is more suitable to enable compari-             When rotating around an axis parallel to the imaging
son with remote sensing measurements that often also have a         plane, it may be challenging to select the same points on
vertical viewing geometry.                                          the second exposure. Particle images where it is difficult to
   The side-view images are exposed twice to enable fall            identify the same points on both exposures, or when signif-
speed measurements so that both particle exposures are dis-         icant tumbling is apparent, are excluded. The tumbling limit
played in the same image (Fig. 1, right). These particle expo-      is when the speed of the points differs by more than ±10 %
sures correspond to the first and second positions, respec-         from the mean speed. However, tumbling is not observed fre-
tively, of the particle when falling. In our data, the two-         quently in our dataset. Figure 2 shows different side-view
particle exposures in the side-view images might be partly          images of particles included and excluded from the analy-
overlapping due to a combination of fall speed and size of          sis, respectively. In Fig. 2a–d, the particles are not, or are
the particle. Figure 1a shows an example of non-overlapping         only slightly, tumbling, and therefore they are included in
particles, whereas, in Fig. 1b, the particles are partly overlap-   the analysis. In Fig. 2e–h, the particles are tumbling signifi-

https://doi.org/10.5194/acp-21-7545-2021                                              Atmos. Chem. Phys., 21, 7545–7565, 2021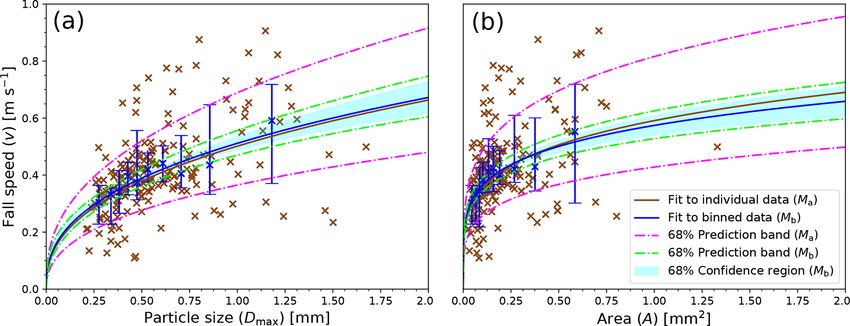
7548                                                      S. Vázquez-Martín et al.: Shape dependence of snow crystal fall speed

                                                                        Figure 3. Cross-sectional area vs. particle size (A vs. Dmax ) rela-
                                                                        tionships are shown in logarithmic scale for all the shape groups
                                                                        (solid lines) and all data (dashed black line). The median Dmax of
Figure 2. Panels (a)–(h) show eight examples of different parti-        the data is represented as a single point on each line. The length of
cles with side-view images. Panels (a)–(d) show particles that were     the fit lines is defined by 16th and 84th percentiles of Dmax . For a
included in the analysis. Panels (e)–(h) show particles that were ex-   legend of the shape groups, see Fig. 5. For comparison, the cross-
cluded since the two-particle exposures revealed significant tum-                                                   2 is shown as a dashed
                                                                        sectional area of spheres given by (π/4)·Dmax
bling.                                                                  gray line.

cantly. Consequently, these particles were discarded and not            than in both Dmax and the diameter (needle width). The low
included in the analysis.                                               values of b also explain why the area ratio, Ar , decreases
                                                                        most rapidly with increasing Dmax for these shape groups,
3     Results and discussions                                           which can be seen if one expresses Ar as a power law in
                                                                        Dmax (inserting Eq. 2 into 1),
3.1    Cross-sectional area
                                                                                           Dmax b−2

                                                                               4    a
                                                                        Ar =     ·     ·            ,                                    (3)
For this study, we use a large subset of the data from                         π 1 mm2     1 mm
Vázquez-Martín et al. (2020). Although we excluded mea-
surements with higher wind speeds than 3 m s−1 , the cross-             as the exponent in this power law is b−2. It is also evident
sectional areas as a function of particle size are nonethe-             in Fig. 4, which shows these power laws for all shape groups
less very similar here to results presented in Vázquez-Martín           determined from Eq. (3), and the coefficients given in Ta-
et al. (2020). However, for completeness, we briefly analyze            ble 1.
and discuss the cross-sectional area vs. particle size, A vs.              For most other shape groups, the coefficient b varies be-
Dmax , for all the shape groups in this section. Table 1 shows          tween 1.4 and 1.8. Only for the groups (12) Graupel and
these results, along with the metadata on the particle groups,          (15) Spherical is it larger with b = 2.0, which is the expected
including their full names. For simplicity, we will use shorter         theoretical value for spherical shapes. Thus, apart from (15)
names from here on (see, e.g., in Table 2). As seen in Table 1,         Spherical, (12) Graupel is the only shape group where Ar
generally, particle size and cross-sectional area are very well         remains constant with increasing Dmax .
correlated (R 2 > 0.7) if expressed by the power law                       The fitted relationships for all particles (regardless of
                         b                                            shape) also appear in Figs. 3 and 4 for A vs. Dmax and Ar vs.
               Dmax                                                     Dmax , respectively. They represent a kind of average; how-
A(Dmax ) = a ·                 ,                                 (2)
               1 mm                                                     ever, they do not seem to be a good approximation for most
                                                                        of the shapes.
where the parameter a corresponds to the cross-sectional area
at Dmax = 1 mm and b is the exponent in the power law.                  3.2    Fall speed relationships
   Figure 3 shows these fitted A vs. Dmax relationships. We
note that shape groups (1) Needles, (2) Crossed needles, and            Analysis of the shape dependence of fall speed (see Fig. 5)
(3) Thick columns are the groups with the lowest values of              shows that shape groups (7) Bullet rosettes and (12) Grau-
parameter b that are close to 1. For these groups, this is un-          pel have the fastest fall speeds with a median value of v '
derstandable from their morphology. An increase in A pri-               0.6 m s−1 , followed by shape groups (4) Capped columns,
marily follows an increase in Dmax (needle length), rather              (9) Side planes, (11) Spatial stellar, (14) Irregulars, and (15)

Atmos. Chem. Phys., 21, 7545–7565, 2021                                                    https://doi.org/10.5194/acp-21-7545-2021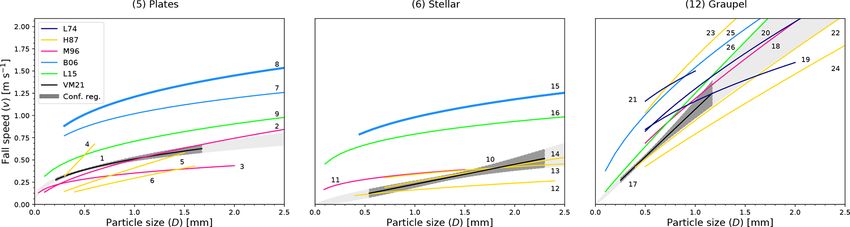
S. Vázquez-Martín et al.: Shape dependence of snow crystal fall speed 7549
Table 1. Cross-sectional area vs. particle size (A vs. Dmax ) relationships fitted to a power law given by Eq. (2) for each shape group and for
all data, i.e., for all the particles regardless of shape. The number of particles N , the ranges of Dmax and A (min, max), the parameters a and
b with their respective uncertainties, and the correlation coefficients R 2 are shown for each shape group and all data. The root-mean-square
error (RMSE) values of base-10 logarithms of measured A vs. predicted A are also shown to indicate the uncertainty of these power laws.
Note that RMSE values of logarithms of Ar as determined from measurements using Eq. (1) vs. predicted values using Eq. (3) are the same.
A vs. Dmax
Shape groups (1–15) N Dmax [mm] A [mm2 ]
a [mm2 ] b R2 RMSE
(1) Needles and thin or long columns 317 0.27–3.0 0.03–0.7 0.15 ± 0.01 1.06 ± 0.03 0.79 0.11
(2) Crossed needles and crossed columns 66 0.57–2.6 0.10–0.7 0.18 ± 0.04 1.01 ± 0.08 0.70 0.10
(3) Thick columns and bullets 103 0.16–0.9 0.02–0.2 0.17 ± 0.04 1.24 ± 0.05 0.88 0.09
(4) Capped columns and capped bullets 189 0.28–2.1 0.02–1.3 0.32 ± 0.03 1.60 ± 0.06 0.79 0.15
(5) Plates 197 0.21–1.7 0.03–1.3 0.45 ± 0.03 1.71 ± 0.03 0.93 0.09
(6) Stellar crystals 43 0.54–2.3 0.13–1.9 0.40 ± 0.07 1.59 ± 0.15 0.75 0.12
(7) Bullet rosettes 41 0.54–1.5 0.12–0.8 0.35 ± 0.04 1.62 ± 0.12 0.83 0.10
(8) Branches 438 0.27–2.9 0.03–3.4 0.32 ± 0.01 1.74 ± 0.03 0.86 0.12
(9) Side planes 350 0.29–2.7 0.04–2.7 0.37 ± 0.01 1.77 ± 0.04 0.87 0.09
(10) Spatial plates 48 0.30–1.3 0.06–0.6 0.42 ± 0.05 1.62 ± 0.10 0.85 0.09
(11) Spatial stellar crystals 185 0.36–2.8 0.06–2.9 0.40 ± 0.01 1.76 ± 0.03 0.95 0.08
(12) Graupel 37 0.25–1.2 0.03–0.8 0.51 ± 0.04 1.99 ± 0.05 0.98 0.05
(13) Ice and melting or sublimating particles 60 0.13–1.2 0.01–0.3 0.23 ± 0.09 1.45 ± 0.07 0.87 0.12
(14) Irregulars and aggregates 346 0.21–3.2 0.02–2.7 0.34 ± 0.02 1.65 ± 0.03 0.91 0.13
(15) Spherical particles 41 0.06–0.4 0.003–0.15 0.80 ± 0.02 2.04 ± 0.01 1.00 0.01
All data 2461 0.06–3.2 0.003–3.4 0.30 ± 0.01 1.54 ± 0.01 0.81 0.18
3.2.1 Fitting to individual data: Ma
Fall speed vs. particle size (v vs. Dmax ) and fall speed vs.
cross-sectional area (v vs. A) relationships are useful to pa-
rameterize fall speed. In order to find the v vs. Dmax relation-
ships on the data, one can apply a power-law fit given by
Dmax bD
v(Dmax ) = aD · . (4)
1 mm
The parameters aD and bD are determined from linear fits to
the data expressed as logarithm of v vs. logarithm of Dmax .
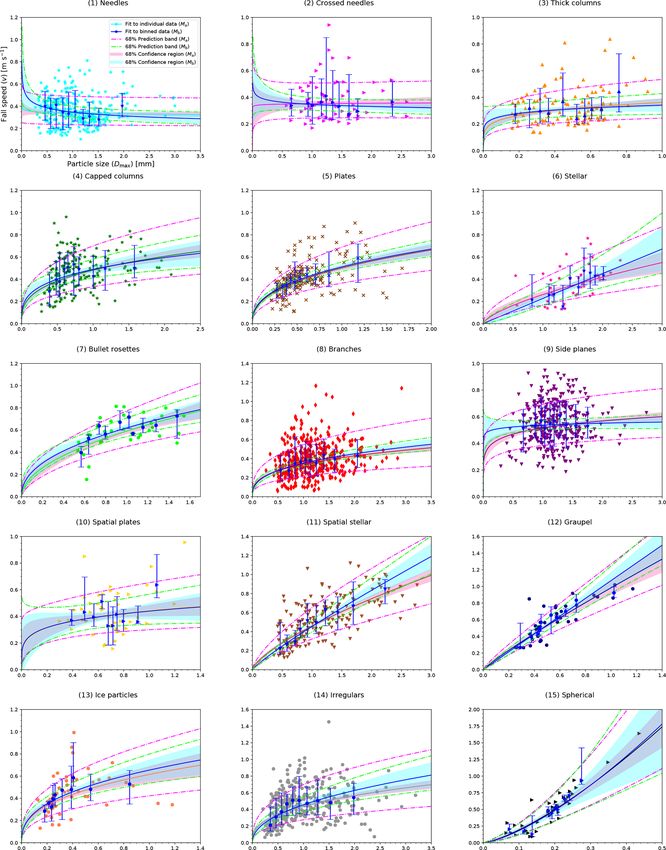
The v vs. A relationships result from fitting data to a power
law given by
bA
A
Figure 4. Area ratio vs. particle size (Ar vs. Dmax ) relationships v(A) = aA · . (5)
1 mm2
are shown in logarithmic scale for all the shape groups (solid lines)
and all data (dashed black line). The median Dmax of the data is The parameters aA and bA are determined from linear fits to
represented as a single point on each line. The length of the fit lines the data expressed as log(v) vs. log(A). This method of fit-
is defined by 16th and 84th percentiles of Dmax . For a legend of the ting to individual data is further referred to as Ma . As an
shape groups, see Fig. 5. example, we look at shape group (5) Plates, representing
a commonly occurring shape that has clear results. The in-
dividual data points of the measured fall speeds appear in
Fig. 6. It also shows the 68 % prediction band, which de-
Spherical with a median fall speed value of v ' 0.5 m s−1 . scribes the region of where to expect 68 % of any new mea-
The median of all data is approximately 0.43 m s−1 , and most surements. The prediction band can be considered a measure
shape groups have their median within ±0.08 m s−1 from of the spread of the data around the fit line, which appears in
this value. Shape groups (1) Needles, (2) Crossed needles, the same color as the individual data points.
and (3) Thick columns have the lowest median values of The large spread in fall speed apparent from Fig. 6 results
0.34 m s−1 or less. in a low correlation to the fit functions. The results for this
https://doi.org/10.5194/acp-21-7545-2021 Atmos. Chem. Phys., 21, 7545–7565, 2021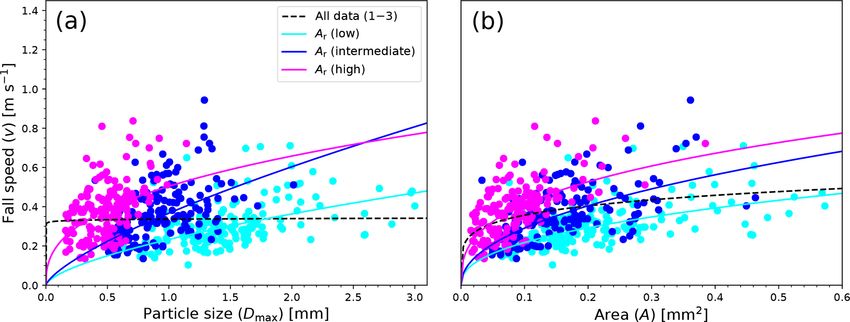
7550                                                      S. Vázquez-Martín et al.: Shape dependence of snow crystal fall speed

Figure 5. The fall speeds v of snow crystals for each shape group are shown in solid lines. The median and the distribution of v are shown.
The values of the median are represented by points. The lower and upper ends of the vertical bars indicating the distributions are given by
the 16th and 84th percentiles, respectively. These bounds would correspond to ±1σ (standard deviation) if the distribution was normal. For
comparison, a dashed black line shows all data (regardless of shape). Table 2 contains a list of these percentiles and medians.

Figure 6. Fall speed vs. particle size (v vs. Dmax ) and fall speed vs. cross-sectional area (v vs. A) relationships for shape group (5) Plates.
Individual data (brown symbols) and binned data (blue symbols with error bars) are displayed. Median values in the respective bins represent
the binned data. The total length of the error bars represents the spread in fall speed data, which is given by the difference between the 16th
and 84th percentiles. Fits that apply to individual data (Ma ) and to binned data (Mb ) are shown for comparison. The 68 % prediction bands
for both fits (Ma , Mb ) are shown. The 68 % confidence region is shown for Mb . (a) v vs. Dmax relationship given by Eq. (4). (b) v vs. A
relationship given by Eq. (5). The same data are shown in Table 3 for v vs. Dmax and in Table 4 for v vs. A.

shape group represent the general features found in all shape             3.2.2    Fitting to binned data: Mb
groups, i.e., a large spread in fall speed data and relatively
low R 2 for Ma . The v vs. Dmax and v vs. A relationships
for all the shape groups are shown in Figs. A1–A2 (see Ap-                The spread of fall speed data is due to several factors such as
pendix A). Tables 3 and 4 show these results for v vs. Dmax               particle orientation and specific shape, and binning the data
and for v vs. A, respectively. The only exceptions from the               should reduce the spread to some extent. Therefore, to im-
generally low correlations are shape groups (11) Irregulars,              prove the correlation, the data are first binned into 10 particle
(12) Graupel, and (15) Spherical with R 2 > 0.5. For all other            size or cross-sectional area bins before fitting to Eqs. (4) and
shape groups, the correlation coefficients for Ma are R 2 .0.2            (5), respectively, where each bin contains as close to the same
for both v vs. Dmax and v vs. A. Judging by these low R 2                 number of particles as possible. Therefore, the bin widths are
values, it is uncertain if the fit functions are representative of        variable and specific to each shape group and thereby avoid
the measured data.                                                        the problem of individual bins having a disproportional ef-
                                                                          fect on the fit. The number of bins (10) is a compromise:

Atmos. Chem. Phys., 21, 7545–7565, 2021                                                       https://doi.org/10.5194/acp-21-7545-2021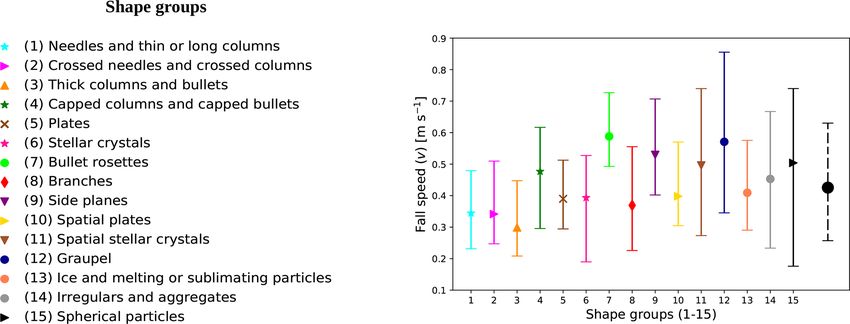
S. Vázquez-Martín et al.: Shape dependence of snow crystal fall speed                                                          7551

Table 2. Fall speed, v, for the shape groups. The fall speed range,   For example, Fig. 6 shows the binned data of shape group (5)
median, and 16th and 84th percentiles are displayed. For compari-     Plates and the corresponding fit, which closely matches the
son, results for all the data, regardless of shape, are also shown.   fit to Ma . After binning, the correlation coefficients, which
                                                                      for clarity are denoted RD 2 and R 2 for the fits to v vs. D
                                                                                                          A                       max
                                        v [m s−1 ]                    and v vs. A relationships, respectively, are much higher with
   Shape groups (1–15)                                                   2 ' 0.88 (Table 3) and R 2 ' 0.88 (Table 4). Therefore,
                             Range      Median       16th   84th      RD                             A
                                                                      for this shape group, the fits Mb can be considered represen-
   (1) Needles             0.10–0.8      0.34        0.23   0.48      tative.
   (2) Crossed needles     0.17–0.9      0.34        0.25   0.51
                                                                          The method Ma fits agree with Mb fits for all shape groups
   (3) Thick columns       0.14–0.8      0.30        0.21   0.45
                                                                      if considering confidence regions (see Figs. A1 and A2 in
   (4) Capped columns      0.11–1.0      0.48        0.30   0.62
   (5) Plates              0.11–0.9      0.39        0.29   0.51      Appendix A). To judge if the relationships are reliable or not,
                                                                      the correlation coefficients RD 2 (v vs. D              2
   (6) Stellar             0.13–0.8      0.39        0.19   0.53                                                 max ) and RA (v vs.
   (7) Bullet rosettes     0.15–0.8      0.59        0.49   0.73      A) for Mb will be considered too. They are plotted in Fig. 7,
   (8) Branches            0.06–1.2      0.37        0.23   0.56      which shows that the correlation coefficients of 7 out of 15
                                                                      groups improve past 0.5 in Mb for both RD   2 and R 2 (see Ta-
   (9) Side planes         0.19–0.9      0.53        0.40   0.71                                                            A
   (10) Spatial plates     0.16–1.0      0.40        0.30   0.57      bles 3 and 4), including three shape groups with a very high
   (11) Spatial stellar    0.13–1.1      0.50        0.27   0.74      correlation to their fit (both RD2 &0.9 and R 2 &0.9), namely
                                                                                                                     A
   (12) Graupel            0.26–1.0      0.57        0.35   0.86      groups (5) Plates, (11) Spatial stellar, and (12) Graupel.
   (13) Ice particles      0.13–1.0      0.41        0.29   0.58      The other groups with both correlation coefficients RD    2 and
   (14) Irregulars         0.06–1.5      0.45        0.23   0.67         2
                                                                      RA > 0.5 are (7) Bullet rosettes, (8) Branches, (14) Irregu-
   (15) Spherical          0.09–1.6      0.50        0.18   0.74
                                                                      lars, and (15) Spherical. For the other eight shape groups,
   All data                0.06–1.6      0.43        0.26   0.63      one of or both RD 2 and R 2 remain below 0.5. Therefore, for
                                                                                                 A
                                                                      these groups, no solid relationship could be found for v vs.
                                                                      Dmax , or v vs. A, or both.

a small enough number of bins to contain enough particles             3.2.3   Comparing size and cross-sectional area
per bin and a large enough number of bins to allow for a                      dependencies
good fit to the measurements. The binned data consist of the
median values in each bin, i.e., median fall speeds vs. me-           For the seven groups with good correlations, RD   2 and R 2 are
                                                                                                                                 A
dian maximum dimensions and median fall speeds vs. me-                similar (see also Fig. 7). As discussed in Sect. 3.1, particle
dian cross-sectional areas. This method of fitting to binned          size and cross-sectional area are very well correlated, so this
data is further referred to as Mb . The apparent randomness in        is expected. Only for two of the other eight groups are the
fall speed, manifested as the wide spread in data, may have           values of RD  2 and R 2 similar. While for shape group (4)
                                                                                              A
several reasons. While instrumental uncertainties and errors          Capped columns binning the data made a similar improve-
introduced by the manual analysis (see Kuhn and Vázquez-              ment to both RD  2 and R 2 , increasing the correlation towards
                                                                                                A
Martín, 2020) contribute to the variability, much of the ob-          0.5, for (10) Spatial plates, both RD   2 and R 2 remain very
                                                                                                                       A
served randomness is likely inherent to the data. For exam-           low for Mb . For the remaining six groups, there is a notice-
ple, Dunnavan (2021) showed that aggregate snowflakes’ fall           able difference between RD   2 and R 2 . On the one hand, shape
                                                                                                           A
speed is very sensitive to shape. Other studies have also re-         groups (6) Stellar and (13) Ice particles have improved their
ported a wide spread and used a similar method of binning             correlation coefficients RD 2 to above 0.5 but without an im-

fall speed before data fitting (e.g., Barthazy and Schefold,                            2
                                                                      provement in RA . On the other hand, groups (1) Needles,
2006; Zawadzki et al., 2010). Shape and orientation affect            (2) Crossed needles, (3) Thick columns, and (9) Side planes
the fall speed, since they are responsible for the drag force.        have RA 2 values that are significantly larger than the respec-

Within most shape groups, there is still a wide variety of dif-              2
                                                                      tive RD values. For example, shape group (1) Needles has
ferent shapes. In addition, for any particle shape, the orienta-      RD2 = 0.24 and R 2 = 0.50, and (3) Thick columns has R 2
                                                                                          A                                         D
tion may also contribute to the spread in data.                       = 0.11 and RA   2 = 0.44. For the groups (2) Crossed needles

   Since the binned data are based on the individual data, the        and (9) Side planes, the difference between RD     2 and R 2 is
                                                                                                                                  A
fits obtained from the binned data (Mb ) should be consistent                                                         2
                                                                      most pronounced with no improvement in RD but moderate
with the fits based on the individual data (Ma ). If so, and,         values for RA 2 of 0.36 and 0.50, respectively.

in particular, when R 2 for Mb is high, the fits are deemed              The results discussed above show that among these groups
representative of the given shape group. If R 2 remains low           with a noticeable difference between RD   2 and R 2 , more have
                                                                                                                         A
after binning, it implies that no reliable relationship could be                2
                                                                      larger RA (four groups) than larger RD    2 (two groups); i.e.,

found. This may indicate that no adequate fit exists for that         more have better v vs. A correlation than v vs. Dmax . Par-
particular shape group, or it may be the consequence of too           ticles are falling at a speed for which gravitational and drag
much spread in the fall speed data obscuring any relationship.        forces are in equilibrium; i.e., fall speed depends on mass

https://doi.org/10.5194/acp-21-7545-2021                                               Atmos. Chem. Phys., 21, 7545–7565, 2021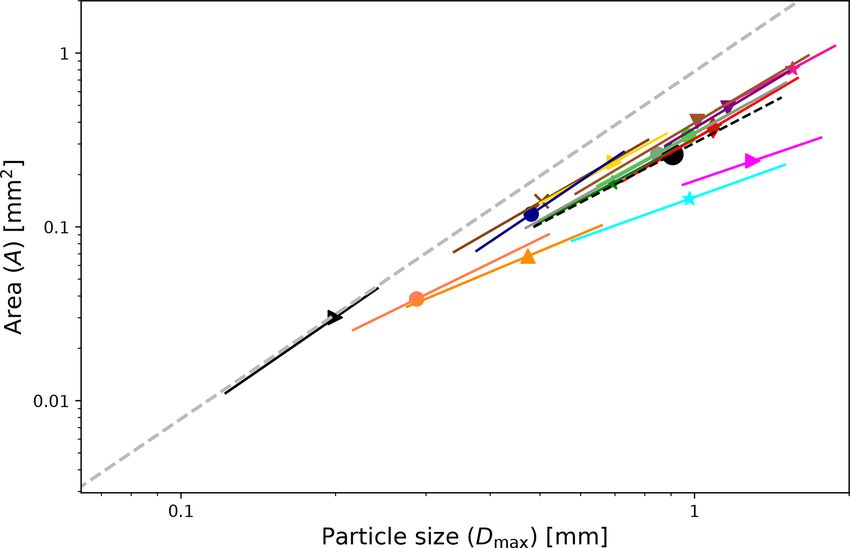
7552                                                   S. Vázquez-Martín et al.: Shape dependence of snow crystal fall speed

                                                                    respectively). These are shape groups (5) Plates, (6) Stellar,
                                                                    (7) Bullet rosettes, (8) Branches, (11) Spatial stellar crys-
                                                                    tals, (12) Graupel, (13) Ice particles, (14) Irregulars, and
                                                                    (15) Spherical for the v vs. Dmax relationships. For the v
                                                                    vs. A relationships, the correlated shape groups are (1) Nee-
                                                                    dles, (4) Capped columns, (5) Plates, (7) Bullet rosettes, (8)
                                                                    Branches, (9) Side planes, (11) Spatial stellar, (12) Graupel,
                                                                    (14) Irregulars, and (15) Spherical. For comparison, the re-
                                                                    lationships for all shapes combined appear as dashed lines in
                                                                    both figures.
                                                                       Given by their compact shape, members of the (15) Spher-
                                                                    ical group have the largest mass and lowest drag for a given
                                                                    size. Therefore, they will fall faster than any other shape and
                                                                    have the highest slopes, i.e., values for steepest slopes, i.e.,
                                                                    highest values of exponents bD and bA . Among all shapes,
                                        2 (v vs. D           2      (12) Graupel is most similar to spherical particles as they of-
Figure 7. The correlation coefficients RD         max ) and RA (v
                                                                    ten have spheroidal shape. However, their bD (1.0) and bA
vs. A) from Mb are shown for the 15 shape groups. For a legend
of the shape groups, see Fig. 5. The dashed black line represents
                                                                    (0.47) are considerably smaller than those of spheres, though
RD2 = R2 .                                                          still larger than for any other shape (see Fig. 8 and Tables 3–
         A
                                                                    4).
                                                                       While two shape groups ((6) Stellar and (11) Spatial stel-
and drag, which in turn depends on cross-sectional area A           lar) have similarly large values of bD , the relationships shift
and the drag coefficient CD (e.g., Mitchell, 1996). Since drag      towards much lower speeds and larger sizes compared to the
depends directly on cross-sectional area, one may expect fall       relationships of shape groups (12) Graupel and (15) Spheri-
speed to depend more on the cross-sectional area than on            cal (see Fig. 8). Shape group (11) also has a similarly large
maximum dimension. Drag, in addition to cross-sectional             value of bA as shape group (12), but again its relation-
area, also depends on CD , which is proportional to the par-        ship shifts towards lower speeds and this time larger cross-
                                                                    sectional areas. The other groups with RD     2 > 0.5 have b
ticle Reynolds number, which in turn depends on a charac-                                                                          D
                                                                    values around 0.4, and the other groups with RA    2 > 0.5 have
teristic length of the particle. For most particle shapes, Dmax
may be a good approximation for this characteristic length;         bA values around 0.2 (0.16 to 0.27) except for shape group
hence, fall speed also depends directly on Dmax . However,          (9) Side planes, which has the smallest value (0.11).
for some shapes, Dmax may be significantly different from              There seems to be around a factor of 2 between bA and bD .
the characteristic length for the Reynolds number, so that fall     By combining Eqs. (4), (5), and (2), one finds that b should
speed is not necessarily well correlated to Dmax .                  give this factor. As can be seen in Table 1, the coefficient b is
   For example, for needles or columns, if falling horizon-         for most shape groups between 1.5 and 2. Figure 9 shows the
tally, this characteristic length is given by the needle’s or       ratios bbDA as a function of b, and most ratios on this plot are
column’s width rather than its maximum dimension Dmax ,             close to the line bbDA = b. The exceptions are the two shape
which is similar to the needle’s or column’s length. Indeed,        groups where RD  2 was larger than R 2 ((6) Stellar and (10)
                                                                                                          A
the shape groups related to needles and columns, i.e., (1)          Spatial plates), which are found above the line. Group (10)
Needles, (2) Crossed needles, and (3) Thick columns, are            is outside the plot domain since it has an excessively high
among the four groups for which fall speed is better corre-         ratio of 9.37 caused by a very small bD . However, this is
lated to A than to Dmax . Interestingly, as seen in Sect. 3.1,      probably not meaningful since the correlation is very bad for
these three shape groups also have the lowest exponents b           this group. The four shape groups with RA   2 larger than R 2
                                                                                                                               D
for the A vs. Dmax relationships, with values close to 1. Two       ((1) Needles, (2) Crossed needles, (3) Thick columns, and (9)
of these groups, (1) and (2), are also among the four groups        Side planes) are below the line.
with the lowest correlation between A and Dmax (together
with shape groups (4) Capped columns and (6) Stellar), indi-        3.3     Particle orientation and area ratio
cating again that the differences between RD  2 and R 2 that we
                                                       A
see in three of these four groups are not unexpected.               3.3.1    Orientation

3.2.4   Representative relationships                                For certain shapes, the orientation of the falling particle can
                                                                    considerably change the cross-sectional area seen in the top-
Figure 8 shows the fitted v vs. Dmax (left) and v vs. A (right)     view image. Therefore, the particle orientation will influence
relationships (from method Mb ) as solid lines for the shape        the drag and thus the fall speed. To test how much this affects
groups with relatively good correlations (RD 2 or R 2 & 0.50,       our data, particles that clearly show a horizontal or vertical
                                                    A

Atmos. Chem. Phys., 21, 7545–7565, 2021                                               https://doi.org/10.5194/acp-21-7545-2021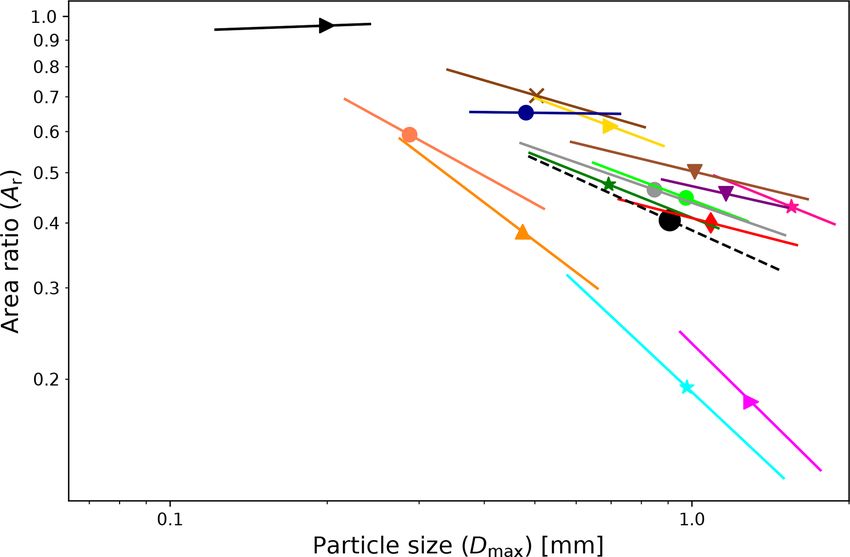
S. Vázquez-Martín et al.: Shape dependence of snow crystal fall speed                                                                       7553

Table 3. Fall speed vs. particle size (v vs. Dmax ) relationships fitted to Eq. (4) for each shape group and all data, i.e., for all the particles
regardless of shape. The parameters aD , bD with their respective uncertainties and the correlation coefficients RD      2 are shown for both
methods (Ma and Mb ) for each shape group and regardless of shape. The RMSE values of base-10 logarithms of measured v vs. predicted v
are also shown to indicate the uncertainty of these power laws.

                                                                          v vs. Dmax
                                                       Method Ma                                         Method Mb
              Shape groups (1–15)
                                       aD   [m s−1 ]          bD           2
                                                                          RD       aD   [m s−1 ]          bD            2
                                                                                                                       RD     RMSE
              (1) Needles              0.34 ± 0.02       −0.03 ± 0.05    0.001     0.35 ± 0.05       −0.15 ± 0.11     0.24     0.05
              (2) Crossed needles      0.35 ± 0.06        0.01 ± 0.13    0.0002    0.35 ± 0.05       −0.07 ± 0.13     0.04     0.05
              (3) Thick columns        0.36 ± 0.08        0.19 ± 0.09     0.05     0.34 ± 0.14        0.12 ± 0.15     0.11     0.07
              (4) Capped columns       0.48 ± 0.03        0.33 ± 0.06     0.12     0.49 ± 0.07        0.28 ± 0.14     0.42     0.06
              (5) Plates               0.50 ± 0.04        0.40 ± 0.05     0.24     0.51 ± 0.05        0.39 ± 0.06     0.88     0.03
              (6) Stellar              0.26 ± 0.10        0.67 ± 0.21     0.20     0.23 ± 0.17        0.99 ± 0.37     0.54     0.11
              (7) Bullet rosettes      0.59 ± 0.04        0.51 ± 0.14     0.26     0.62 ± 0.05        0.44 ± 0.15     0.59     0.05
              (8) Branches             0.34 ± 0.02        0.33 ± 0.06     0.07     0.35 ± 0.03        0.36 ± 0.08     0.78     0.03
              (9) Side planes          0.52 ± 0.02        0.14 ± 0.05     0.02     0.54 ± 0.02        0.04 ± 0.08     0.04     0.02
              (10) Spatial plates      0.44 ± 0.09        0.21 ± 0.19     0.03     0.44 ± 0.13        0.20 ± 0.28     0.08     0.08
              (11) Spatial stellar     0.46 ± 0.03        0.70 ± 0.05     0.48     0.45 ± 0.04        0.88 ± 0.10     0.93     0.05
              (12) Graupel             0.98 ± 0.08        0.89 ± 0.11     0.65     1.07 ± 0.09        1.00 ± 0.13     0.91     0.05
              (13) Ice particles       0.61 ± 0.12        0.38 ± 0.10     0.21     0.65 ± 0.14        0.39 ± 0.12     0.65     0.06
              (14) Irregulars          0.44 ± 0.03        0.37 ± 0.05     0.16     0.46 ± 0.07        0.46 ± 0.12     0.70     0.07
              (15) Spherical           4.49 ± 0.28        1.37 ± 0.16     0.67     4.76 ± 0.63        1.42 ± 0.35     0.73     0.14
              All data                 0.42 ± 0.01        0.20 ± 0.02     0.06     0.44 ± 0.02        0.19 ± 0.03     0.87     0.02

Table 4. Fall speed vs. cross-sectional area (v vs. A) relationships fitted to Eq. (5) for each shape group and for all data, i.e., for all the
                                                                                                                            2 are shown for
particles regardless of shape. The parameters aA , bA with their respective uncertainties and the correlation coefficients RA
both methods (Ma and Mb ) for each shape group and regardless of shape. The RMSE values of base-10 logarithms of measured v vs.
predicted v are also shown to indicate the uncertainty of these power laws.

                                                                            v vs. A
                                                         Method Ma                                      Method Mb
                Shape groups (1–15)
                                         aA   [m s−1 ]         bA         2
                                                                         RA       aA   [m s−1 ]         bA           2
                                                                                                                    RA       RMSE
                (1) Needles              0.51 ± 0.07       0.21 ± 0.04    0.10    0.50 ± 0.16       0.20 ± 0.08      0.50     0.04
                (2) Crossed needles      0.54 ± 0.15       0.30 ± 0.10    0.12    0.57 ± 0.27       0.33 ± 0.18      0.36     0.08
                (3) Thick columns        0.73 ± 0.17       0.31 ± 0.06    0.22    0.60 ± 0.34       0.26 ± 0.12      0.44     0.07
                (4) Capped columns       0.57 ± 0.07       0.17 ± 0.04    0.10    0.60 ± 0.12       0.16 ± 0.07      0.49     0.05
                (5) Plates               0.59 ± 0.06       0.22 ± 0.03    0.23    0.57 ± 0.06       0.20 ± 0.03      0.88     0.02
                (6) Stellar              0.37 ± 0.08       0.31 ± 0.12    0.14    0.37 ± 0.14       0.24 ± 0.25      0.13     0.13
                (7) Bullet rosettes      0.81 ± 0.10       0.30 ± 0.08    0.28    0.79 ± 0.11       0.24 ± 0.09      0.55     0.05
                (8) Branches             0.43 ± 0.04       0.20 ± 0.03    0.09    0.45 ± 0.07       0.20 ± 0.06      0.68     0.04
                (9) Side planes          0.57 ± 0.03       0.11 ± 0.03    0.05    0.59 ± 0.04       0.11 ± 0.05      0.50     0.03
                (10) Spatial plates      0.43 ± 0.17       0.04 ± 0.11   0.004    0.40 ± 0.40       0.02 ± 0.25     0.001     0.13
                (11) Spatial stellar     0.67 ± 0.04       0.40 ± 0.03    0.51    0.70 ± 0.05       0.47 ± 0.04      0.96     0.04
                (12) Graupel             1.35 ± 0.11       0.46 ± 0.05    0.69    1.40 ± 0.14       0.47 ± 0.07      0.89     0.05
                (13) Ice particles       1.01 ± 0.19       0.30 ± 0.06    0.31    0.87 ± 0.38       0.24 ± 0.12      0.41     0.09
                (14) Irregulars          0.56 ± 0.04       0.23 ± 0.03    0.19    0.60 ± 0.12       0.27 ± 0.08      0.68     0.07
                (15) Spherical           5.42 ± 0.29       0.68 ± 0.08    0.69    5.92 ± 0.59       0.71 ± 0.15      0.78     0.12
                All data                 0.52 ± 0.02       0.18 ± 0.01   0.14     0.54 ± 0.02       0.18 ± 0.01     0.97      0.01

https://doi.org/10.5194/acp-21-7545-2021                                                          Atmos. Chem. Phys., 21, 7545–7565, 2021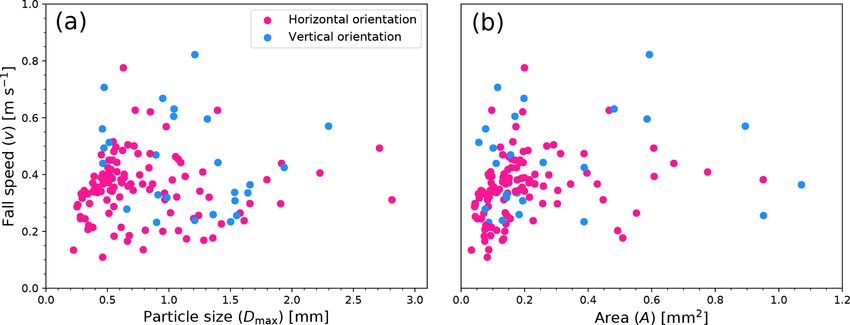
7554                                                         S. Vázquez-Martín et al.: Shape dependence of snow crystal fall speed

Figure 8. Fall speed vs. particle size (v vs. Dmax ) and fall speed vs. cross-sectional area (v vs. A) relationships for the shape groups where
we have found good correlations (solid lines) and all data regardless of shape (dashed black lines) are shown. The 68 % prediction band and
the 68 % confidence region for the fits (Mb ) are also shown. For a legend of the shape groups, see Fig. 5. (a) v vs. Dmax relationship. Shape
groups (5), (6), (7), (8), (11), (12), (13), (14), and (15) are displayed. The values of the median of Dmax are represented by points. (b) v vs.
A relationship. Shape groups (1), (4), (5), (7), (8), (9), (11), (12), (14), and (15) are displayed. The values of the median of A are represented
by points. The length of the fit lines is defined by 16th and 84th percentiles of Dmax (a) and A (b). The corresponding data are shown in
Tables 3–4.

                                                                           of 135 particles fulfilled these criteria: 109 with horizontal
                                                                           and 26 with vertical orientation. Figure 10a–f show six ex-
                                                                           amples using side-view images of individual particles with
                                                                           horizontal orientation and six examples (g–l) with vertical
                                                                           orientations.
                                                                              Figure 11 shows the individual fall speeds of these parti-
                                                                           cles. When trying to fit these data to Eqs. (4) or (5), the corre-
                                                                           lation coefficients remained very low, and thus no meaning-
                                                                           ful relationships could be found. However, particles falling
                                                                           with a vertical orientation are slightly faster (with a median
                                                                           v = 0.42 m s−1 ) than the horizontally oriented (with a me-
                                                                           dian v = 0.34 m s−1 ).

                                                                           3.3.2    Area ratio

Figure 9. Ratio of the coefficients bD and bA from fits (Mb ) to v         In addition to orientation, also area ratio, Ar , may be im-
vs. Dmax and v vs. A relationships, respectively, and the coefficient      portant, especially given that the Reynolds number, which
b corresponding to the A vs. Dmax relationship are shown for all           influences fall speed (Sect. 3.2), can be related, in part, to
the shape groups. The solid green line corresponds to bbD = b.             the area ratio (Heymsfield and Westbrook, 2010). In gen-
                                                         A
                                                                           eral, the smallest particles tend to have the largest Ar , and
                                                                           Ar becomes smaller for larger particles. This is true for most
orientation are selected among predominantly elongated par-                shape groups, and this tendency is particularly strong in the
ticles which are found within the shape group (1) Needles or               four shape groups (1) Needles, (2) Crossed needles, (3) Thick
predominantly planar particles found within one of the (5)                 columns, and (13) Ice particles (see Fig. 4), of which groups
Plates and (6) Stellar groups. Particles that are identified by            (1–3) are elongated shapes. The lowest Ar values, at any
eye as having an orientation angle close to 0◦ are considered              given size, are found in these shape groups. The elongated
horizontal, and conversely, particles with an orientation angle            shapes also showed a particular size dependence of their
close to 90◦ are considered vertical. The orientation angle is             cross-sectional area (Sect. 3.1). This dependence of area ratio
here defined as the angle that the horizontal plane forms with             and of cross-sectional area on particle size leads to a partic-
the particle plane, in the case of planar particles, or with the           ular fall speed behavior, which can be better visualized by
particle axis, in the case of elongated particles. Only a total            splitting the data into different Ar ranges. Figure 12 shows

Atmos. Chem. Phys., 21, 7545–7565, 2021                                                        https://doi.org/10.5194/acp-21-7545-2021
S. Vázquez-Martín et al.: Shape dependence of snow crystal fall speed 7555 Figure 10. Panels (a)–(f) show six examples using side views of different particles with horizontal orientation, and panels (g)–(l) show six examples using side views of different particles with vertical orientation. These particles have an elongated shape (shape group (1) Needles) and planar shape (shape groups (5) Plates and (6) Stellar). Two examples of each shape group are displayed for both orientations. The same scaling is applied to all images; a 1 mm scale bar is shown for reference. Figure 11. Fall speed vs. particle size (v vs. Dmax ) and fall speed vs. cross-sectional area (v vs. A) for mixed particle shapes, elongated particles (shape group (1) Needles), and planar particles (shape groups (5) Plates and (6) Stellar), with horizontal and vertical orientation angles. (a) v vs. Dmax relationship. (b) v vs. A. this after splitting the data equally into three distinct regions tally. However, a closer inspection of the data shows that of low, intermediate, and high Ar values. In each range, there the majority of particles are horizontally oriented. The pre- is a different fall speed relationship for both v vs. Dmax and dominance of the horizontal orientation is probably a conse- v vs. A. As can be seen in Fig. 12, these relationships are quence of vertically falling particles being less aerodynami- spread out in a way so that for a given particle size or cross- cally stable and thus likely to transition to horizontal orien- sectional area, higher and lower Ar means higher and lower tation. Therefore, particle orientation does not appear to ex- fall speed, respectively. One may expect the effects of ori- plain the dependence of fall speed on area ratio. Instead, par- entation to be responsible since the same elongated particle ticles with higher area ratios are generally bulkier, i.e., nee- would have a relatively larger Ar when oriented vertically, dles or columns that are shorter in length, and consequently and thus falling faster, compared to when oriented horizon- fall faster. https://doi.org/10.5194/acp-21-7545-2021 Atmos. Chem. Phys., 21, 7545–7565, 2021
7556                                                   S. Vázquez-Martín et al.: Shape dependence of snow crystal fall speed

   To better understand this area ratio dependence of fall          3.4   Comparison with previous fall speed relationships
speed, we first consider elongated particles that have the
same Dmax (approximately given by the length) but differ-           For shape groups (5) Plates, (6) Stellar (called dendrites in
ent values of Ar . Note that the top-view images, used to de-       other studies), and (12) Graupel, where we found good cor-
termine A, always present a view perpendicular to the major         relation (RD 2 &0.5), we compare our fall speed relationships

axis of elongated particles if these are horizontally oriented.     as functions of particle size, further referred to as VM21,
Therefore, the cross-sectional area is approximately given by       against parameterizations of previous studies. Table 6 lists
the length of a particle multiplied by its diameter d (with         the parameterizations of Locatelli and Hobbs (1974) L74,
diameter, we refer to the width perpendicular to the major          Heymsfield and Kajikawa (1987) H87, Mitchell (1996) M96,
axis), i.e., A ≈ Dmax · d.                                          Barthazy and Schefold (2006) B06, and Lee et al. (2015) L15
   Also, as can be seen in Eq. (1), the cross-sectional area A      used in the comparison.
is proportional to Ar for the case of Dmax being constant as           Before comparing, it is important to note that the parti-
considered here. Then, also diameter is proportional to Ar .        cle size D was defined somewhat differently depending on
Consequently, volume (≈ Dmax · d 2 ) or mass (m) is propor-         the study. For VM21, as well as for H87 and M96, D corre-
tional to A2r . While, in the case of constant Dmax , A ∝ Ar is     sponds to Dmax . For L74, D is the diameter of an estimated
valid in general for all shapes, the strong dependence m ∝ A2r      circle that has the same cross-sectional area as the imaged
is distinctive for elongated shapes. Then, for these shapes, as     particle, and for B06 and L15, D corresponds to the maxi-
Ar increases, mass increases much more rapidly than A, and          mum length of any horizontal row in the side-view shadow
consequently, fall speed needs to increase considerably for         graphs. Furthermore, we have not adjusted the different stud-
drag to compensate gravitational force. This effect can ex-         ies to common temperature and pressure conditions but com-
plain the strong dependence of fall speed on area ratio for         pared them as they are reported. While some did adjust mea-
these elongated shapes.                                             surements to some standard conditions, others did not. For
   For other shapes, the general dependence may be similar,         example, H87 adjusted measurements from about 1000 m al-
though less pronounced due to a weaker Ar dependence of             titude to a pressure level of 1000 hPa, whereas L74 used mea-
m. Additionally, for these other shapes, the range of Ar is not     surements from, on average, the same altitude but did not
as wide as for the elongated shapes. Moreover, for no other         adjust them to a common or standard pressure level, which
shape group do the fall speeds separate into distinguishable        results in a difference of about 5 %.
relationships after splitting the data according to Ar . That in-      L74 studied fall speeds of different types of ice crystals
dicates that the natural spread in fall speed may hide the Ar       by first measuring the fall speed of individual particles and
dependence of fall speed.                                           then subsequently collecting and imaging them. Their fitted
   To examine further, we also consider what happens at in-         relationships of fall speed are often used as a reference by
creasing Dmax in the case of constant Ar . In this case, A ∝        other studies in the literature. H87 also used data from fall
   2                            β
Dmax    in general and m ∝ Dmax where β is between 2 and            speed measurements and subsequent imaging of individual
3. Consequently, as m increases more rapidly with increas-          snow particles, which were collected by Kajikawa (1972).
ing Dmax than A (for all cases but the extreme m ∝ Dmax    2 ),     What L74 and H87 have in common with VM21 is that all
the fall speed also increases rapidly with increasing Dmax ,        ice particles that contribute to a fall speed parameterization
which is consistent with the strongest size dependence of fall      are individually shape classified and therefore belong to the
speed existing in shape groups (12) Graupel and (15) Spher-         studied shape. B06, on the other hand, loosely tied particle
ical (see Sect. 3.2).                                               shape to fall speeds by determining the dominant particle
   Finally, considering the general case when neither Dmax          shape (occurrence > 50 %) per time interval from an inde-
nor Ar is constant, one needs to take into account both of          pendent instrument and later associated the fall speeds in the
the special cases explained above. On the one hand, increas-        time interval to the dominant shape. L15 used a method sim-
ing Dmax leads directly to increasing fall speed. On the other      ilar to B06; however, they used a higher occurrence thresh-
hand, increasing Dmax changes the particle morphology so            old of 70 %. The fall speed parameterizations of the study by
that Ar decreases, which, in turn, causes fall speed to de-         M96 are predicted from previous literature relationships of
crease. Since these effects are opposed, they cancel each           cross-sectional area and mass vs. particle size.
other out to some extent. The stronger the negative size de-           Figure 13 shows that, for plates, the previous relation-
pendence of Ar , the weaker the positive size dependency of         ships by H87 and M96 are closest to results from VM21.
fall speed. If the effect related to Ar is the strongest, they      While their relationships for crystal with sector-like branches
cancel out almost entirely, as in the case of shape groups (1–      (P1b) produce slower fall speeds than VM21, their relation-
3) where this results in the weakest size dependence of fall        ships for plates are closer and extend into or cross the con-
speed with low correlation. Another consequence of the Ar           fidence region of VM21. H87 also reported a relationship
dependence of fall speed is that variations in Ar cause vari-       for thick plates, which, in most of its size range, is just
ations in fall speed; i.e., they account in part for the natural    above VM21. The relationships reported by B06 have the
spread in the data.                                                 highest fall speeds for plates. They reported different rela-

Atmos. Chem. Phys., 21, 7545–7565, 2021                                              https://doi.org/10.5194/acp-21-7545-2021
S. Vázquez-Martín et al.: Shape dependence of snow crystal fall speed                                                                        7557

Figure 12. Fall speed vs. particle size (a) and fall speed vs. cross-sectional area (b) relationships for the combination of shape groups
(1) Needles, (2) Crossed needles, and (3) Thick columns. Fits that apply to binned data (Mb ; see Sect. 3.2.2) are shown for all the data (solid
black line) and for different Ar (low, intermediate, and high) ranges. All data, in this case, only include particles in these three shape groups,
i.e., (1–3). Same data are shown in Table 5.

Table 5. Fall speed vs. particle size (v vs. Dmax ) and fall speed vs. cross-sectional area (v vs. A) relationships fitted to binned data (Mb ) for
the combination of particles in shape groups (1) Needles, (2) Crossed needles, and (3) Thick columns with different area ratio Ar ranges (low,
intermediate, and high). The number of particles, N , the parameters aD , bD , aA , bA , and their respective uncertainties, and the correlation
coefficients Rb2 are shown. All data are also shown. In this case, all data include only particles in these three shape groups, i.e., (1–3).

                                                             v vs. Dmax                                v vs. A
                      Ranges              N
                                                 aD [m s−1 ]         bD           2
                                                                                 RD      aA [m s−1 ]         bA          2
                                                                                                                        RA
                      All data (1–3)      486    0.34 ± 0.04     0.01 ± 0.07    0.01     0.50 ± 0.10    0.20 ± 0.05     0.74
                      Ar low              161    0.23 ± 0.05     0.64 ± 0.11    0.84     0.58 ± 0.08    0.43 ± 0.05     0.93
                      Ar intermediate     164    0.37 ± 0.04     0.72 ± 0.14    0.82     0.87 ± 0.12    0.48 ± 0.06     0.91
                      Ar high             161    0.50 ± 0.07     0.38 ± 0.08    0.80     0.93 ± 0.20    0.35 ± 0.08     0.78

tionships for different degrees of riming, with more riming                    L74 reported three relationships for lump graupel with dif-
leading to higher fall speeds. Our data included in shape                   ferent densities. The higher the density, i.e., the more com-
group (5) Plates are mainly composed of unrimed particles                   pact the graupel particles are, the faster their predicted fall
(for a detailed description, see Vázquez-Martín et al., 2020).              speeds will be. The relationship for lump graupel by M96 is
However, even the unrimed plates from B06 appear to be                      based on the mass relationship of the medium density graupel
much faster. The relationships from B06 may overestimate                    by L74; consequently, it is very close to the corresponding
fall speeds because of their classification method mentioned                fall speed relationship. These are within or above VM21’s
above, which allowed up to half of the particles that con-                  confidence region. H87 reported lump graupel for tempera-
tributed to the relationship to have different shapes. L15 also             tures below and above 0.5 ◦ C, with faster speeds for higher
reported a relationship for plates’ speed that is faster than our           temperatures. These are below and above VM21’s confidence
relationship, although much closer and considerably slower                  region, respectively. Their relationship for colder tempera-
than those of B06. The better agreement is possibly due to a                tures than 0.5 ◦ C is closer to VM21. The relationship by L15
more accurate shape classification, while otherwise using a                 is close to VM21, just above the confidence region, and the
similar method to B06.                                                      relationship from B06 is again at higher speeds, similar to the
   As for plates, also for stellar particles the previous rela-             differences for plates and stellar.
tionships by H87 and M96 are closest to those of VM21.                         In general, our v vs. D relationships agree with the previ-
Note that M96 is based on the flow regime for particles larger              ous studies. The studies with the largest disparity compared
than about 1 mm (Eq. 20 in M96). Using the flow regime                      to this study may, in large part, be explained by the different
for smaller particles, M96 would come somewhat closer to                    approach to classifying snow particle shapes.
VM21 below about 0.6 mm. Again, L15 and B06 reported
relationships with considerably higher fall speeds.

https://doi.org/10.5194/acp-21-7545-2021                                                       Atmos. Chem. Phys., 21, 7545–7565, 2021
You can also read