Rural R&D for Profit Program - Digital technologies for dynamic management of disease, stress and yield - Wine Australia
←
→
Page content transcription
If your browser does not render page correctly, please read the page content below
Rural R&D for Profit Program

Digital technologies for dynamic
management of disease, stress and yield
[RnD4Profit-15-02-018]

Final Report

Wine Australia
June 2016 – August 2020
Alex Sas, R&D Program Manager

Final Report – Digital technologies for dynamic management of disease, stress and yield

Contents
 Plain English summary ..................................................................................................................... 4
 Abbreviations and glossary.............................................................................................................. 6
 1      Project rationale and objectives.............................................................................................. 7
 2      Performance summary ............................................................................................................ 9
 3      Achievements and industry relevance .................................................................................. 14
       3.1           Disease management in cotton [CRD 1601] ............................................................... 14
             3.1.1     Collection of geospatial disease survey data ...................................................................... 14
             3.1.2     Statistical associations identified in historical datasets ...................................................... 15
             3.1.3     Disease suppression potential of soils from different regions ............................................ 16
             3.1.4     Verticillium wilt ................................................................................................................... 17
             3.1.5     Impact on productivity and profitability ............................................................................. 19
             3.1.6     Lessons learnt ...................................................................................................................... 20
             3.1.7     Collaboration and industry interaction ............................................................................... 20

       3.2           Yield forecasting in vineyards .................................................................................... 22
             3.2.1     Pre-budburst yield estimation [UT 1601] ............................................................................ 22
             3.2.2     Post-budburst yield estimation [CSA 1602] ........................................................................ 25
             3.2.3     Impact on productivity and profitability ............................................................................. 28
             3.2.4     Lessons learnt ...................................................................................................................... 29
             3.2.5     Collaboration and industry interaction ............................................................................... 29

       3.3           Measure vineyard canopy, nutrition, microclimate, grape defects and disease ...... 31
             3.3.1 New technologies for dynamic canopy and disease management [CSA 1601] .................. 31
             3.3.2 Digital solutions for grape quality measures at the weighbridge [AWR 1601] .................. 37
             3.3.3 Use of UAVs for early, real time detection of extreme weather events in vineyards [USA
                   1601] ................................................................................................................................... 41
             3.3.4 Impact on productivity and profitability ............................................................................. 47
             3.3.5 Lessons learnt ...................................................................................................................... 48
             3.3.6 Collaboration and industry interaction ............................................................................... 49

       3.4           Optimise vineyard spraying [UQ 1601] ...................................................................... 51
             3.4.1     Sensors to automatically adjust spray and dose ................................................................. 51
             3.4.2     PAVE to manually calculate dose per row ........................................................................... 52
             3.4.3     Drones ................................................................................................................................. 53
             3.4.4     Electronic ‘leaf’ .................................................................................................................... 53
             3.4.5     Impact on productivity and profitability ............................................................................. 54
             3.4.6     Lessons learnt ...................................................................................................................... 55
             3.4.7     Collaboration and industry interaction ............................................................................... 56

                                                                                                                                                                ii
Final Report – Digital technologies for dynamic management of disease, stress and yield

    3.5           Tools for spatial data analysis [CSA 1603].................................................................. 58
          3.5.1     Freeware GIS platform ........................................................................................................ 58
          3.5.2     Create tools to simplify geostatistical analysis .................................................................... 59
          3.5.3     PAT – Precision Agriculture Tools ........................................................................................ 59
          3.5.4     Lessons learnt ...................................................................................................................... 59
          3.5.5     Collaboration and industry interaction ............................................................................... 60
          3.5.6     Impact on productivity and profitability ............................................................................. 60

4   Evaluation .............................................................................................................................. 62
    4.1           Digital technologies developed ................................................................................. 62
    4.2           Industry impact.......................................................................................................... 63
    4.3           Media and communication ....................................................................................... 73
5   Appendix - additional project information............................................................................ 75
    5.1           Media, publications and presentations ..................................................................... 75
    5.2           Intellectual property .................................................................................................. 87
    5.3           Equipment and assets ............................................................................................... 89
    5.4           Budget ....................................................................................................................... 89
    5.5           Agreement execution dates ...................................................................................... 90

                                                                                                                                                         iii
Final Report – Digital technologies for dynamic management of disease, stress and yield

Plain English summary
Digital technologies have the potential to transform Australian agriculture, with one recent study
estimating that their adoption would increase the gross value of agricultural production by
$20 billion annually, with the cotton and wine sectors accounting for 5% of that improvement. The
objective of the project was therefore to develop novel digital technologies and processes for
Australian cotton and grape producers so that they could share in these productivity improvements.
Eight sub-projects explored suitable technology to support five research goals:

1.      Disease management in cotton
2.      Yield forecasting in vineyards
3.      Measure vineyard canopy, nutrition, microclimate, grape defects and disease
4.      Optimise vineyard spraying
5.      Tools for spatial data analysis

Diseases are a major constraint to cotton production in Australia, either directly through lost
production (estimated at $27-75 million annually), or through the inability to plant fields thought to
be at risk. The cotton industry has historically conducted surveys to separately monitor disease
severity and spread in New South Wales and Queensland. While this surveillance has provided
industry with disease trends, it has not allowed for a holistic systems approach to potentially improve
disease management. This project developed a process to capture georeferenced in-field disease
survey data across both states and also collated three years of field pathology data and management
practices into a new database. Multivariate analyses of the survey data were performed to
determine if the previous crop and cotton trash influenced disease incidence and severity. The key
finding was that the previous crop had a significant effect on disease in the subsequent cotton crop.
This finding has already been communicated to the industry through updates to best practice
management guides, grower meetings and workshops. In addition, a new plant tissue assay was
developed for the organism that causes Verticillium wilt – Verticillium dahliae – that is faster than
prior methods. The development of this molecular tool now provides industry with the ability to
quickly diagnose the presence of Verticillium and its strain, enabling disease risk to be factored into a
decision to grow cotton.

Seventeen new technologies were developed for the wine sector, at various stages of industry
readiness. A package of ‘precision agriculture tools’ (PAT) has already been released. PAT assists
with the analysis of spatial data collected for Precision Agriculture. Initial feedback is that while the
tools are useful, the platform interface is still too complex to be adopted widely by producers. It is
recommended that the remaining technologies be assessed for commercialisation potential with
input from the sector. For those systems with lower technology readiness where this assessment is
not yet practical, it is recommended to continue research where there is ongoing support.

The technologies developed to estimate yield were rated highly by the Industry Reference Group
whose role it was to provide feedback to the project team. An improvement in the accuracy and
efficiency of yield estimation has the potential to generate significant productivity gains through the
entire wine supply chain. Current methods used to estimate yield are typically inaccurate and time

                                                                                                            4
Final Report – Digital technologies for dynamic management of disease, stress and yield
consuming, with many growers simply replying on an ‘educated guess’. A prototype hand-held NIR
instrument and calibration set was successfully developed which can predict bud fruitfulness in
Chardonnay and Pinot Noir vines, in the vineyard. This information can be used by growers to tailor
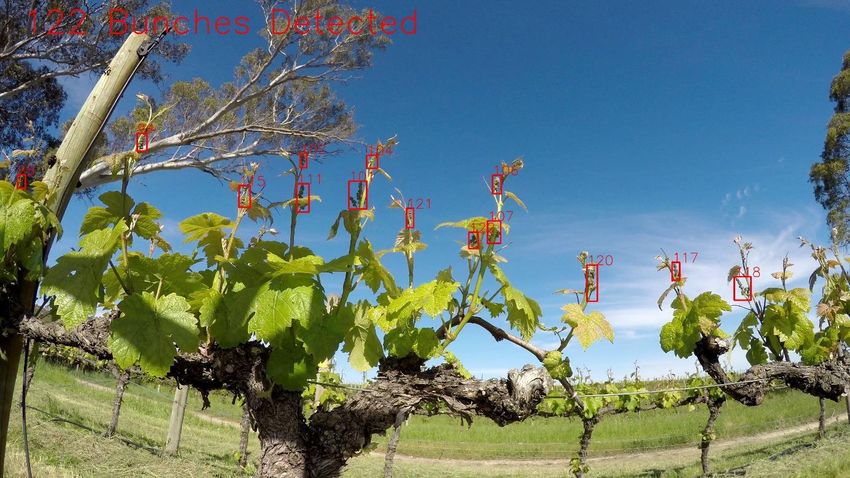
pruning to maximise their returns. In another project, a data processing pipeline was developed and
combined with machine learning to process video captured from Go-Pro cameras to accurately count
inflorescences down a vineyard row and thereby provide a yield prediction shortly after budburst.
The same method worked reliably for bunch counting but needs further optimisation for vineyards
with heavier canopies. Low-power radar was able to detect fruit irrespective of canopy, but its ability
to reliably quantify fruit mass still needs to be demonstrated.
An associated sub-project developed technology to provide on-the-go, non-contact measurement of
canopy size and structure, whole vineyard nutrition status, and detection of disease. Real-time
canopy measurement is potentially of value as canopy size affects water use and fruit quality. A
system using LiDAR was developed to define three-dimensional (3D) canopy structure for whole vine
rows and another system successfully measured canopy size across a vineyard using consumer drone
imagery with photogrammetry or Go-Pro video imagery. All these devices (except the drone) were
mounted on vineyard vehicles and used to image commercial vineyards in collaboration with three
wine companies. Individual vine nutritional status was able to be estimated for an entire vineyard
using hyperspectral imaging and analysis. Measurement of diseased grapes in vineyards was possible
but had many challenges, as did the pre-symptomatic detection of disease on leaves. In contrast,
hyperspectral imaging was successfully used to measure bunch rot in addition to other defects such
as sunburn, berry shrivel and ‘matter other than grapes’ (MOG) in machine-harvested loads of grapes
delivered to a winery. Current methods for the quantification of these defects rely on subjective or
semi-quantitative assessment, so the potential of these new tools is of interest to the sector,
especially for larger wineries.
A prototype system was developed using acoustic atmospheric tomography and long wave infrared
thermography to provide a three-dimensional record of vineyard microclimate at a sub-metre scale.
The system was successfully tested in frosty conditions and during days of extreme heat (up to 48°C).
The value of the 3D microclimatic information is yet to be quantified by the sector. The goal to
optimise vineyard spraying succeeded by developing a kit for sprayers which uses LiDAR and radar to
automatically assess canopies and adjust application in response. Chemical savings of 50-90% were
achieved in sparse canopies, with a substantial reduction in spray drift. An ‘electronic leaf’ to
measure spray coverage was also developed.
The project achieved its objective to develop innovative digital technologies for the cotton and grape
sectors—at least 18 novel devices or processes were produced. While collaboration between the
sectors was limited, collaboration within each sector and across research organisations nationally
and internationally contributed to this success. Wine Australia has already commenced the
assessment of each of the wine sector project outputs for potential commercialisation, and this will
include consultation with growers, vineyard contractors and winemakers.
This project was funded by the Australian Government Department of Agriculture, Water and the
Environment as part of its Rural R&D for Profit program, with co-investment from Wine Australia,
Cotton Research and Development Corporation, Horticulture Innovation Australia Limited, LasTek Pty
Ltd and the University of South Australia.
5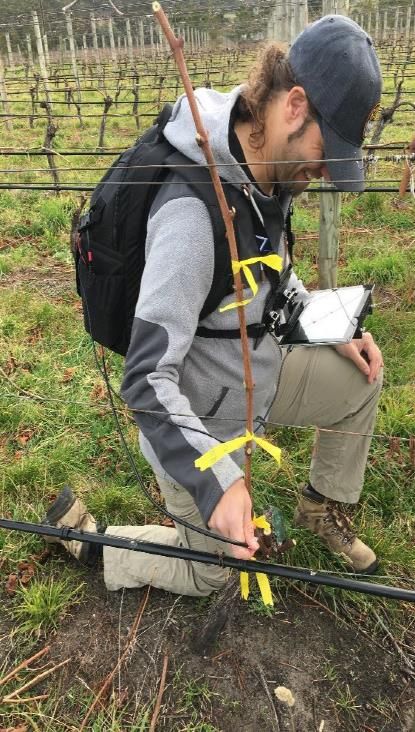
Final Report – Digital technologies for dynamic management of disease, stress and yield

Abbreviations and glossary
AAT      atmospheric acoustic tomography
ACCC     Australian Competition & Consumer Commission
AWRI     Australian Wine Research Institute
CRDC     Cotton Research & Development Corporation
FoPEN    foliage penetrating radar
GRDC     Grains Research and Development Corporation
GVP      gross value of production
LAI      leaf area index
LiDAR    light detection and ranging
LWIR     longwave infrared
MDI      mean disease incidence
MOG      matter other than grapes
NIR      near infrared
PA       precision agriculture
PACE     pesticide adjusted for canopy environment
PAVE     pesticide adjusted for vineyard environment
PIRSA    Primary Industries and Regions SA
ppg      propagules per gram
PV       precision viticulture
PWM      pulsed width modulation
RGB      red, green, blue colour model (colour image)
SaaS     software as a service
SARDI    South Australian Research and Development Institute
SODAR    sonic detection and ranging
SWIR     shortwave infrared
TRL      technology readiness level
UAV      unmanned aerial vehicle (drone)
VCG      vegetative compatibility groups (strain)

                                                                                                  6
Final Report – Digital technologies for dynamic management of disease, stress and yield

1 Project rationale and objectives
The development of agricultural machinery and digital technology that can generate objective
information about the status of soil, water and crops holds promise of substantial productivity
benefits for Australian farmers1 . A recent study2 estimated that these benefits could potentially
deliver a 25% improvement in the gross value of Australian agriculture. The same study estimated
that the biggest gains from the adoption of digital technologies would be through:

    •    labour savings from automation;
    •    genetic gains through objective data; and
    •    closer tailoring of inputs to needs.

The potential boost to wine sector GVP through the adoption of these emerging technologies was
estimated at $705 million per annum while the benefit to the cotton industry was nearly $400
million.

The objective of the Rural R&D for Profit program project Digital technologies for dynamic
management of disease, stress and yield was therefore to develop innovative digital technologies
and processes for Australian cotton and grape producers so that they could participate in these
productivity improvements.

Eight sub-projects (Table 1) were commissioned by Wine Australia to explore suitable technology to
support five research goals. The five goals and associated objectives are:
1. Disease management in cotton
   – To reduce losses in cotton – in particular from disease caused by Verticillium dahliae – by
       developing technology to assess disease risk prior to planting and strategies for disease
       management.
2. Yield forecasting in vineyards
   – To provide timely yield forecasts more accurately and quicker (and therefore cheaper) than
       current labour-intensive methods.
3. Measure vineyard canopy, nutrition, microclimate, grape defects and disease
   – To develop and evaluate sensors and associated data processing pipelines to assess key
      vineyard management parameters (canopy growth, incidence of pre-symptomatic disease,
      vineyard microclimate, vine nutritional status) non-destructively and on-the-fly, and to assess
      grape condition on delivery to the winery.
4. Optimise vineyard spraying
   – To develop novel sensors as part of an automated vineyard spraying system to optimise
       dosing of chemicals applied to each unique canopy, reducing chemical use and spray drift.

1Keogh, M and Henry, M (2016). The implications of digital agriculture and big data for Australian agriculture.
Research Report, Australian Farming Institute, Sydney Australia
2Heath, R (2018). An analysis of the potential of digital agriculture for the Australian economy. Farm Policy Journal,
15(1), Autumn 2018.

                                                                                                                         7
Final Report – Digital technologies for dynamic management of disease, stress and yield

5. Tools for spatial data analysis
   – To produce a suite of freeware spatial data analysis tools to enable a non-expert to access
      the benefits of Precision Viticulture management.

Table 1. The five research themes within the Rural R&D for Profit project Digital technologies for dynamic
management of disease, stress and yield, and the associated eight sub-projects
 Theme                                Sub-project                                    Lead research organisation

 1   Disease management in            Digital technologies for dynamic disease       CRDC through NSW DPI and
     cotton                           management CRD 1601NS                          Department of Agriculture
                                                                                     and Fisheries, Queensland
 2   Yield forecasting in vineyards   Taking grapevine yield forecasting into the    The University of Tasmania
                                      digital age UT 1601
                                      New non-destructive technologies for           CSIRO
                                      simultaneous yield, crop condition and
                                      quality estimation CSA 1602
 3   Measure vineyard canopy,         New technologies for dynamic canopy and        CSIRO
     nutrition, microclimate,         disease management CSA 1601
     grape defects and disease
                                      Digital solutions for grape quality measures   The Australian Wine Research
                                      at the weighbridge AWR 1601                    Institute
                                      Use of Unmanned Air Vehicles for early, real   The University of South
                                      time detection of extreme weather events       Australia
                                      in vineyards USA 1601
 4   Optimise vineyard spraying       LiDAR and PACE for vineyards UQ 1601           The University of Queensland
 5   Tools for spatial data           Simple tools for spatial analysis - key        CSIRO
     analysis                         enabling technologies for Precision and
                                      Digital Viticulture CSA 1603

                                                                                                               8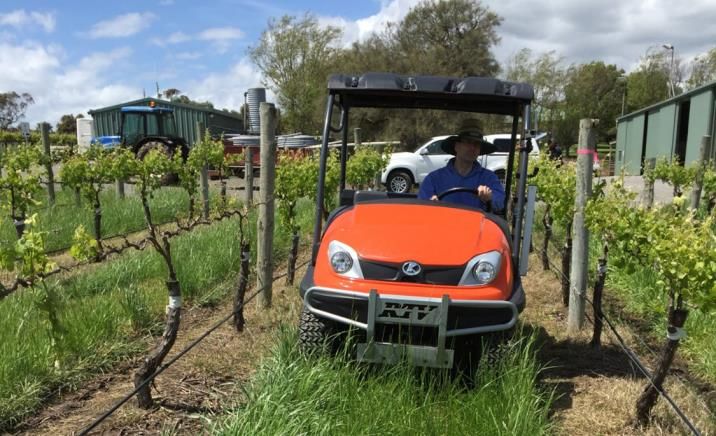
Final Report – Digital technologies for dynamic management of disease, stress and yield

2 Performance summary
The project activities and outputs – as specified in the Grant Agreement RnD4Profit-15-02-018 –
were fully achieved, with two exceptions (Outputs 6e and 7d). Further detail is provided in the
summary of the project performance, below.

 Activity / Output                                    Achievement summary

 ✓ Output achieved; P Output partially achieved       NB: Milestone Report 6 KPIs are highlighted

 B1         Project initiation
      1a.   Engage a project manager for the          The Funding Deed was executed between Wine Australia and the            ✓
            duration of the Activity                  Commonwealth on 22/6/2016. Project initiation outputs included
      1b.   Establish a project steering committee    engagement of a project manager and establishment of an Industry        ✓
            responsible for oversight of the          Reference Group with agreed terms of reference, as reported in
            Activity. The project steering            Milestone Report 2.
            committee will agree its terms of
            reference which will set out its
            membership, governance
            arrangements and responsibilities
      1c.   Execute agreements with partner           Dates of contract execution are listed in Appendix 5.5.                 ✓
            organisations
      1d.   Advise the yearly breakdown of the        The yearly breakdown of the cash and in-kind contributions to be        ✓
            cash and in-kind contributions to be      provided by partner organisations across the entire period of the
            provided by partner organisations for     Grant was provided with Milestone Report 1.
            the duration of the Activity

 B2         Project planning and management
      2a.   Prepare a project plan, setting out the   Detailed plans for each of the eight sub-projects were developed        ✓
            schedule for activities, and the human    and provided with Milestone Report 1. The plans included a
            resources and financial resources         schedule for activities and target dates for the project term.
            required. Prepare a risk management
            plan as part of the project
            management plan
      2b.   Prepare a communication and               A detailed a communication plan was developed by Wine Australia         ✓
            extension plan, setting out the           and presented in Milestone Report 2. The objective of the plan was
            schedule for communication and            to encourage awareness of the findings from each sub-project and
            extension activities, and the human       enhance the credibility of digital technologies in agriculture. The
            resources and financial resources         plan identified audiences and stakeholders, communications
            required                                  channels, content and measures of success.
      2c.   Prepare a monitoring and evaluation       A monitoring and evaluation plan was developed and submitted            ✓
            plan, setting out timeframes for          with Milestone Report 2, with an update provide with Milestone
            activities to be delivered, and the       Report 3, and here in Sections 2 and 4.
            human resources and financial
            resources required
      2d.   Provide a progress report on the                                                                                  ✓
            evaluation of the project, delivered at
            the mid-point of the project

                                                                                                                          9
Final Report – Digital technologies for dynamic management of disease, stress and yield

Activity / Output                                    Achievement summary
B3         Communication and extension activities
     3a.   Identify target audiences and establish   Extensive grower and industry networks were developed and                 ✓
           appropriate contacts with cotton          engaged with, especially for the cotton sub-project. Its activities
           growers, table and wine grape             (disease surveys, assay validation, field trials) demanded frequent
           growers, wine producers, regional         and widespread interaction with industry, as witnessed in the
           associations and extension providers      extensive communications and extension list in Section 5.1. In
                                                     contrast, the grape sub-projects were very experimental in nature as
                                                     they were developing new prototype technology with typically a low
                                                     technology readiness level (TRL). As a consequence, interaction with
                                                     industry – apart from the industry project partners – was mostly
                                                     through media (written publications, radio) or industry conferences
                                                     and workshops, rather than at field days. The industry partners
                                                     were intimately involved with the field testing, providing vineyards
                                                     and grapes for the trials and staff who assisted with the project
                                                     design and operation. Given that the industry partners were more
                                                     likely to be adopters and advocates of the new technology, this
                                                     approach was appropriate.
     3b.   Implement communication and               Section 5.1 addresses KPI 6.2 and lists publications, communications      ✓
           extension plan, and promote project       and extension output from the project: 71 Industry Publications and
           activities and outcomes at regional and   Media pieces; 21 Presentations to Industry; 50 Presentations or
           national conferences, workshops and       Papers at Conferences and Workshops; 17 Papers or Theses
           seminars for the wine and table grape     Published or in press; and 6 Videos Published Online.
           growers, wine producers and cotton
           growers                                   The performance targets within Wine Australia’s communication
     3c.   Publish research findings in journals,    plan were nearly all achieved, with a single parameter being 2%           ✓
           conference papers, industry               under target (Section 4.3).
           publications, RDC publications,
           newsletters and websites in a form
           accessible to producers
     3d.   Establish an ‘influencer network’ to      The industry members of the Industry Reference Group were the             ✓
           reach a wider audience                    core of the initial ‘influencer network’. Due to their commercial
                                                     interests, these people were the most likely bleeding edge users of
                                                     the new technologies developed from the project. Wine Australia’s
                                                     Regional Program partner network (comprising 11 clusters that
                                                     cover all the major Australian wine regions) was used to publicise
                                                     the project to the sector and will be used in the future to evaluate
                                                     short-listed prototype technology developed by the project.

B4         Yield prediction in vineyards
     4a.   Collect data from vineyards and           KPI 6.3 and 6.4 were achieved. Two sub-projects explored                  ✓
           validate against yields                   alternative technologies for estimating yield at different times in the
     4b.   Collect and analyse bud fruitfulness      season. UT 1601 explored the estimation of yield before budburst          ✓
           data                                      so that the data could be used to manage pruning. CSA 1602
                                                     evaluated several sensors to estimate yield later in the season, from
                                                     when the inflorescence was visible till harvest . Inflorescence and
                                                     bunch count data were collected using non-destructive sensor
                                                     technology over several seasons and validated against manual
                                                     counts. Sections 3.2.1 and 3.2.2
     4c.   Develop and trial a prototype spectral    KPI 6.5 was achieved. UT 1601 developed a prototype hand-held             ✓
           instrument                                NIR (spectral) instrument to estimate bud fruitfulness in the field.
                                                     CSA 1602 evaluated several sensors to estimate yield and developed
                                                     data processing pipelines. The technologies sit at a range of
                                                     technological readiness and require further development prior to
                                                     commercialisation. Sections 3.2.1 and 3.2.2
     4d.   Develop a predictive model for yield      KPI 6.6 was achieved. UT 1601 and CSA 1602 both delivered non-            ✓
           estimation                                destructive means of estimating yield. The accuracy of the
                                                     prediction is explained in Sections 3.2.1 and 3.2.2 and in the
                                                     respective technical reports available on the Wine Australia website.

                                                                                                                        10
Final Report – Digital technologies for dynamic management of disease, stress and yield
Activity / Output Achievement summary
B5 Disease management in cotton
5a. Conduct a review of suitable digital A review of suitable digital approaches for collecting and collating ✓
technologies for collecting geospatial geospatial data was undertaken and reported. Pre-requisites for a
data data collection system were as follows: intuitive interface, secure
data sharing to protect anonymity, ability to capture accurate GPS
coordinates, compatibility with a larger data-management system,
affordability for a large seasonal user base and overall simplicity.
The Fulcrum SaaS platform was selected as the most appropriate
tool for the capture of georeferenced in-field disease survey data.
Section 3.1.1
5b. Collect and analyse data and if KPI 6.7 was achieved. Three years of field assessed cotton ✓
required conduct trials to support pathology data and management practices were collected.
findings Multivariate analyses of survey data were performed to test for any
effect of previous crop and cotton trash present on early and late
season diseases. Key finding was the significant negative impact of
previous cropping on disease in the subsequent cotton crop.
Section 3.1.2
5c. Develop a molecular tool for Australian KPI 6.8 was achieved. A plant tissue assay was developed that is ✓
strains of Verticillium dahliae faster than traditional isolating techniques and is capable of
diagnosing Verticillium dahliae and providing VCG (strain) in a higher
proportion of infected plants. This significantly reduces the turn-
around time for diagnostics. This assay was successfully validated by
comparing traditional plating assays with the tissue assay on cotton
and other crops. The development of this molecular tool now
provides industry with the ability to quickly diagnose the presence of
Verticillium and its VCG, enabling disease risk to be factored into a
decision to grow cotton. Section 3.1.4
5d. Investigate inoculum threshold for all In a replicated pot experiment, all plants infected with 1ppg from ✓
strains of Verticillium dahliae and test VCG1A, 2A and 4B exhibited external symptoms of Verticillium wilt
on field samples as did plants infected with 5, 10 and 20 ppg. These results were
supported by the field trials which found that inoculum level did not
have a significant effect on disease index as high disease indices
were recorded with as little as 1 ppg. Section 3.1.4
5e. Develop a geospatial database and KPI 6.9 was achieved. A geospatial database was designed in ✓
enter historical disease survey Microsoft Excel to collate raw survey data for analysis. Three years
information (2016-2019) of field assessed cotton pathology data and
management practices were collected and multivariate analyses
performed. Section 3.1.1
5f. Develop improved disease Updates to best practice management of disease were provided to ✓
management recommendations industry regularly through the CottonInfo Cotton Pest Management
Guide and through grower meetings and conferences. Key findings
communicated included the impact of previous cropping on disease
in the subsequent cotton crop. Sections 3.1.2 and 3.1.7
B6 Disease management in vineyards
6a. Collect data from vineyards and KPI 6.10 was achieved. Hyperspectral imaging was successfully used ✓
harvested fruit loads and validate to measure bunch rot in machine harvested wine grapes, in addition
against disease levels to other defects such as sunburn in white grapes and berry shrivel in
6d. Conduct simulations to measure red and white grapes. MOG could also be measured. The ✓
contaminants in harvested wine grapes presentation of the sample to the camera and lighting was critical to
reduce error. Measurement of diseased grapes in vineyards was also
possible but had many challenges. Section 3.3.2
6b. Develop and trial sensors for level of KPI 6.11 was achieved. Hyperspectral imagery proved to be an ✓
disease in grapes effective tool to measure disease in grapes. Analysis of the
hyperspectral data captured from a lab-based linescan camera,
demonstrated that eight wavelengths described disease and defects
in grapes. This knowledge allowed the testing of a more versatile
multispectral ‘snapshot’ camera. Section 3.3.2
11Final Report – Digital technologies for dynamic management of disease, stress and yield
Activity / Output Achievement summary
6c. Develop a Pesticide Adjusted for the KPI 6.12 was achieved. A modified PACE scheme for vineyards ✓
Canopy Environment (PACE) scheme (PAVE) was developed, using the University of Adelaide VitiCanopy
for farmers app to measure Leaf Area Index – a key parameter for calculating
the amount of agrochemical to apply per length of row . In addition
to this achievement, a prototype system to automate and optimise
spray application was developed. The system uses LiDAR and radar
to achieve constant average spray deposit over a dynamic range of
canopy densities/growth stages throughout the season. Chemical
savings of 70-90% were achieved early in the season with open
canopies, with savings of 30% at full canopy maturity. Spray drift is
also much reduced. The project also developed an ‘electronic leaf’ to
measure spray coverage. Section 3.4.2
6e. Develop prototype technologies and KPI 6.13 was partially achieved. While it was demonstrated that P
protocols for disease detection hyperspectral imaging can be used to measure visible powdery
mildew on leaves in potted vines, it was hoped that a method would
be developed to detect pre-symptomatic disease not obvious to the
naked eye. The initial method tested used detached grapevine
leaves, but this created artefacts in the data which necessitated a
new approach using potted vines. The data from these later
experiments are yet to be analysed and results will be reported as
part of a follow-on project between CSIRO and Wine Australia (CSA
1702-3.1). Section 3.3.1
6f. Deliver workshops for agrochemical KPI 6.14 was achieved. COVID-19 delayed the planned workshop ✓
manufacturers and regulators for but a virtual event was held instead on 28 May 2020 describing the
labelling modifications new technology developed in UQ 1601 and implications for
agrochemical labelling. The workshop was coordinated by the
National Working Party on Pesticide Applications, and was attended
by representatives from the agrochemical industry, wine and cotton
sectors, spray equipment manufacturers, and from state and federal
departments responsible for agrochemicals. The workshop is likely
to lead to data from the project being used to modify agrochemical
label restrictions around spray drift management. Section 3.4.1
B7 Stress management in vineyards
7a. Collect data from vineyards and KPI 6.15 was achieved. In-vineyard tests demonstrated that AAT ✓
validate against grape and vine and UAV/LiDAR measurements had correspondence accuracies of
attributes around 0.5°C for temperature and 0.3 m/s for each component of
wind velocity. This compares very favourably to other inter-
instrument atmospheric comparisons, such as LiDAR vs SODAR and is
within the measurement errors of the system. Section 3.3.3
7b. Develop an Unmanned Aerial Vehicle KPI 6.16 was achieved. A prototype system was developed to ✓
(UAV) based system that delivers real deliver a combination of vineyard canopy, ground and air
time monitoring of potentially temperatures, and wind speed observations at the sub-metre scale.
damaging weather events in vineyards The system was successfully tested in frosty conditions, during days
of extreme heat (up to 48°C), and for continuous periods of
operation throughout a day. The high-resolution tomographic
observations allow visualisation of the meteorology within and
around a vineyard with respect to both time and space to altitudes
of about 130 m. Section 3.3.3
7c. Develop a specification and The plan is described in Section 3.3.3 (Potential for adoption – ✓
implementation plan implementation plan)
7d. Prepare recommendation material and KPI 6.17 was partially achieved. While recommendations have been P
information in a form suitable for provided through the Implementation Plan, given the relatively
delivery to farmers immature TRL of the system these will not be promoted to growers
until an assessment of the commercialisation potential of the
technology is completed.
12Final Report – Digital technologies for dynamic management of disease, stress and yield
Activity / Output Achievement summary
B8 Enabling technology
8a. Identify a suitable freeware GIS QGIS 2.18 was selected as the freeware GIS package that would be ✓
platform to support spatial analysis, used to underpin the project outputs. Section 3.5.1
map display and convert various map
production/analysis tools
8b. Refine methods for geostatistical A package of data processing and analytical functions was created ✓
analysis of field experiments in order using the ‘R’ software environment. The package is a combination
for analysis to be performed on of wrapper functions that include novel algorithmic
standard desktop computers implementations of multivariate geostatistical methods to
understand dissimilarities in the production of a farm by providing
their corresponding statistical uncertainty and significances.
Section 3.5.2
8c. Develop a code to be engineered into a Precision Agriculture Tools (PAT) were produced as a plugin for the ✓
user friendly, open source software freeware GIS package, QGIS. PAT is the front end to pyprecag – an
tool, which outputs to the GIS open source Python library of PA analysis tools which contains the
freeware processing functions. PAT/pyprecag contains all the tools for spatial
data manipulation and analysis that is likely to be needed by
adopters of PV/PA. Both ‘pyprecag’ and the PAT ‘front end’ were
initially released in January 2019. Section 3.5.3
13Final Report – Digital technologies for dynamic management of disease, stress and yield
3 Achievements and industry
relevance
3.1 Disease management in cotton [CRD 1601]
This sub-project was led by the CRDC and undertaken by NSW DPI and Department of Agriculture
and Fisheries, Queensland. It demonstrated the applicability of a strategic and geospatial approach
to surveillance to develop new knowledge and inform research direction for an improved soil-based
biological suppression of disease. It also developed new assays to identify Verticillium and measure
its risk to cropping. All the RnD4P-funded project outputs were achieved.
Analysis of field assessed cotton pathology data, management practices, soil biology and
environmental data provided insights to improve management recommendations to industry (e.g.
crop rotation crop, solarisation) as well as provided insights into research needs. A laboratory-based
pathogen suppression potential assay was developed which provides a quantitative measure of a
cotton soils’ ability to support or inhibit soil-borne fungal pathogens such as Verticillium dahliae. A
plant tissue molecular assay was also developed that is faster than traditional isolating techniques.
3.1.1 Collection of geospatial disease survey data
A review of suitable digital approaches for collecting and collating geospatial data was undertaken
and reported. Pre-requisites for a data collection system were as follows: intuitive interface,
secure data sharing to protect anonymity, ability to capture accurate GPS coordinates,
compatibility with a larger data-management system, affordability for a large seasonal user base
and overall simplicity.
Figure 1. Fulcrum platform dashboard displaying captured geospatial disease survey records
14Final Report – Digital technologies for dynamic management of disease, stress and yield
The Fulcrum SaaS platform was selected as the most appropriate tool for the capture of
georeferenced in-field disease survey data. The Fulcrum desktop interface allows the
visualisation of monitoring field activities across the cotton production regions of New South
Wales and Queensland (Figure 1).
3.1.2 Statistical associations identified in historical datasets
A geospatial database was developed and three years of field assessed cotton pathology data and
management practices were collected. Multivariate analyses of survey data were performed to
test for any effect of previous crop and cotton trash present on early and late season diseases.
Further correlation network analyses were performed on the data to identify relationships
between diseases and yield and diseases themselves in the whole data set and in each state.
Figure 2. Schematic of stratified walk to conduct disease survey of a field
Key findings include the impact of previous cropping on disease in the subsequent cotton crop.
For example, Verticillium wilt was significantly higher following winter cereal crops than cotton.
Seed rot was significantly lower following a fallow or winter cereals, boll rot was significantly
higher following summer grains, and tight-lock was significantly lower following fallow and winter
cereals, than cotton. Tight-lock (Figure 3) had the strongest negative relationship with yield in the
data set, providing statistical support of anecdotal findings. Detection of cotton bunchy top and
mealy bugs highlights the need to ensure that ratoon or volunteer cotton and weed hosts are
eliminated on farm, particularly over winter. The amount of cotton trash present in the field did
not have any significantly detectable effect on disease in the analyses performed on these data.
Given the impact of previous crop on disease incidence, an estimation of crop residues other than
cotton may provide insight to how other crops influence disease, such as maintaining inoculum
levels through asymptomatic colonisation or providing a suitable carbon source for saprophytic
growth. Hence, these findings provide direction for research to investigate cropping rotations that
potentially will decrease/increase disease incidence of important diseases of cotton. The
groundwork achieved in this project has provided the foundation knowledge and critical
directions to improve the collection and storage of data, and to build on the analyses already
conducted.
15Final Report – Digital technologies for dynamic management of disease, stress and yield
Figure 3. Normal cotton (left) compared to tight-lock cotton
Updates to best practice management of disease were provided to industry regularly through the
CottonInfo Cotton Pest Management Guide and other industry publications, and through grower
meetings and conferences as listed in Section 5.1.
3.1.3 Disease suppression potential of soils from different regions
Composition and abundance of microbial communities were analysed for soils collected from
different regions with different cropping histories and varying disease incidences (Figure 4).
Results from the long-term experiments indicate that: (i) the diversity and abundance of soil
fungal communities varied significantly by crop management history and, (ii) fungal communities
in suppressive cotton soils were characterized by higher diversity and higher connectedness. The
high level of organization along with higher diversity in the soil fungal community in the
suppressive soils would provide the cotton plant with a stable microbial reservoir across varied
seasonal environmental conditions.
Figure 4. Locations in Queensland and New South Wales where soil was collected for microbiological
analyses. Samples were collected during disease surveys and from experimental trial sites
This project has provided additional insights into long term disease implications of systems, as
well as short term. Field trials found that a bare fallow and corn rotation both yielded
significantly better than cotton and sorghum, producing at least 1.6 bales/ha more cotton.
Changes in the microbial diversity and activity in the short-term rotation experiment clearly
indicated the significant and important contribution of soil microbiome (bacteria and fungi) for
16Final Report – Digital technologies for dynamic management of disease, stress and yield
the suppression of Verticillium wilt disease in cotton. The influence of rotation crops such as
sorghum and corn could be attributed to: (i) increased microbial catabolic diversity and activity (ii)
higher diversity of bacteria and fungi, (iii) increased abundances of specific groups of
microorganisms involved in antibiosis, antifungal (cell-wall degradation) and plant growth
promoting capabilities, and (iv) lower pathogen levels. These changes would have contributed to
the suppression of the pathogen, disease incidence and impact. Whereas the fallow treatment
caused a significant decline in the total microbial activity and catabolic diversity, genetic diversity
of bacteria and fungi resulting in lower pathogen suppression capacity. Although the lower
pathogen levels would help in the reduction of disease incidence, long-term adoption of fallow
would not benefit in maintaining or improving the overall soil biological health. The traditional
continuous cotton system seems to promote the growth of pathogenic fungi such as V. dahliae
and result in lower microbial diversity and abundances of beneficial microorganisms.
A laboratory-based pathogen suppression potential assay was developed which provides a
quantitative measure of a cotton soils ability to support or inhibit soil-borne fungal pathogens
such as V. dahliae.
Results from this study clearly indicate the presence of a genetically diverse fungal community in
cotton soils and distinct variation in the community composition and diversity between fields in
different cotton regions.
3.1.4 Verticillium wilt
Development of new assays to identify Verticillium and measure its risk to cropping
The aim of this research was to develop tools to inform grower decision making with regards to
Verticillium wilt. Using V. dahliae cultures in the long-term culture collection and those obtained
throughout this project enabled the team to assign presumptive Vegetative Compatibility Groups
(VCGs) without the use of Nit Mutants and further investigate the genetic diversity between
Australian isolates. Molecular studies indicated the Australian defoliating cotton isolates are
distinct from the defoliating isolates in the USA. Analysis of the USA VCG1A isolates revealed they
are genetically different to the Australian VCG1A. Molecular testing has also demonstrated the
presence of both pathogenic and non-pathogenic VCG1A isolates. Australian VCG1A does not
always cause severe crop damage as reported overseas, while VCG2A can cause more severe
damage compared to international isolates. This project has also identified that the Australian
VCG2A has two distinct molecular groups which correlates with their pathogenicity (non-
defoliating and defoliating) in cotton.
Isolates were also used in many laboratory and pot experiments. These were particularly useful
for inoculating soil with a known inoculum to determine the minimum number of propagules
required to cause disease for each VCG. Soil isolation techniques were optimised for estimating
inoculum levels as well as a protocol for soil sampling in cotton fields. This work provides
guidance on where to sample, how deep to sample, how many samples are required. It also
outlines the methods for soil preparation and isolation techniques such as the amount of soil to
be isolated per replicate and what semi-selective media to use.
17Final Report – Digital technologies for dynamic management of disease, stress and yield
Once an effective method for estimating inoculum levels was established using the dry plating
technique, work was undertaken to determine the minimum inoculum level required to cause
disease in fields. Extensive plots trials in commercial cotton fields were used to establish a disease
risk matrix and thresholds for minimum disease incidence. Two observations of the collected data
stood out. First, a large sample size of pre-plant inoculum levels showed there was an upward
trend - as the ppg increased, so too did the minimum disease incidence. Second, there was
considerable variation within any inoculum level. For example, in plots with 2 ppg, the disease
incidence ranged from 10 - 100%.
The effect of long-term rotation following cotton with non-hosts such as durum wheat and
sorghum on inoculum levels was evaluated over time. The inoculum levels significantly decreased
following these crops but increased again following the planting of cotton. The value in rotation is
when inoculum levels are low before the incidence levels cause yield loss. Care must also be taken
when selecting alternative crops to plant in cotton fields. Biofumigant blends containing mustard
and Ethiopian cabbage were confirmed hosts to V. dahliae as was safflower. Growers should seek
advice on what crops are potential hosts for Verticillium prior to planting.
The published LAMP assay was evaluated using nine Australian Verticillium isolates from different
VCGs, three USA VCG1A isolates and Verticillium theobromae as a specificity control. The LAMP
assay failed to work, even after multiple optimisation efforts and consultation with the published
authors and was not able to differentiate between Australian defoliating and non-defoliating
pathotypes.
A plant tissue assay was developed that is faster than traditional isolating techniques and is
capable of diagnosing V. dahliae and providing VCG in a higher proportion of infected plants
(Figure 5). This significantly reduces the turn-around time for diagnostics. This assay was
successfully validated by comparing traditional plating assays with the tissue assay on cotton and
other crops. The development of a V. dahliae specific inoculum quantification assay was
extremely challenging and semi-successful. The molecular soil assay can detect V. dahliae and the
sensitivity of detection was 10-30 ppg in naturally infected soil. This is not sensitive enough when
one propagule per gram of soil is enough to cause disease. The VCG of soil inoculum can be
determined using a combination of the dry plating soil assay and sequencing.
Figure 5. Flowchart comparing workflow and turn-around time for the newly developed plant tissue (direct
stem) assay for V. dahliae with traditional methods. Utilising the direct stem assay, identification of V.
dahliae can be achieved much quicker
18Final Report – Digital technologies for dynamic management of disease, stress and yield
Integrated management of Verticillium wilt
The management of Verticillium wilt requires an integrated approach that ultimately reduces soil
inoculum levels without deleterious effects on overall soil biological health. The field trials
conducted in this research have shown that rotation can reduce disease but needs to be longer
than one year out of cotton where Verticillium levels are high. Two years of rotation to either
non-hosts (sorghum and corn) or a bare fallow significantly reduced Verticillium levels compared
to growing three years of continuous cotton. One year of rotation (corn, sorghum or fallow) on
the other hand was not long enough to significantly lower disease levels. The assessment of
microbial changes in the soil under the different rotations sequences suggest that management of
this disease through cropping to other non-host crops that may also promote disease suppressive
microorganisms may be a better option than fallow as they reduce disease incidence but also
maintain overall soil biological health. A decline in overall microbial populations in the long term
could potentially make soils more conducive to soil borne diseases.
V. dahliae has one of the widest host ranges of any fungal pathogen, including over 400
susceptible crop and weed hosts. It may cause classic characteristic symptoms but also can
develop asymptomatic, endophytic infections. The susceptibility of some rotation crops
commonly grown in the Australian cotton farming system has been largely unknown to date. Our
studies have shown that grain sorghum is a non-host (previous study) and that faba bean
(previous study) and cultivars of chickpea, mungbean, wheat and barley are all susceptible
symptomatic hosts with some differential cultivar and strain reactions observed in some of these
crops. While the susceptibility of these crops has not been proven under natural field conditions
there is clearly the potential for infection to occur and close monitoring of field plants of these
alternative hosts should be carefully monitored and assessed when grown in fields known to have
a history of Verticillium.
To conclude, these analyses of laboratory and field-based research, have provided a wealth of
knowledge to address systems questions on disease management. Research to understand
management strategies that promote microbial diversity, increase specific groups of beneficial
microorganisms, and reduce pathogen capability to cause disease, is required.
3.1.5 Impact on productivity and profitability
Diseases are a major constraint to sustainable production in Australia. Cotton disease impacts on
profitability directly through crop losses estimated in 2014/15 at $27-75 million, as well as
indirectly, through inability to plant some affected fields to cotton due to risk of significant yield
losses of up to 40%.
Historically there has been a limited research focus to reduce the impact of boll rots as the impact
was not well understood and believed to be only an occasional issue in Central Queensland (CQ).
This project has provided the industry with new insights, given that the analyses of survey data
highlighted that tight-lock had the greatest impact on yield.
Environmental conditions are the key factors in determining infection rates of boll rots. Boll rots
are favoured by wet and humid conditions, especially from a thick rank canopy and high moisture
19Final Report – Digital technologies for dynamic management of disease, stress and yield
from rains and dews. Rainfall on exposed soil that splashes soil up onto low bolls enables infection
for some boll rots. Low mature bolls and lodged plants are at high risk of infection.
A type of boll rot referred to as tight-lock was identified in this project as having the strongest
negative relationship with yield. The main economic effect is that the boll’s lint is not harvestable
by mechanical cotton pickers. This disease is endemic to the south-eastern US and can cause
severe yield losses up to 70% in some fields. When conditions are conducive for tight-lock
development, cotton crops in CQ can be significantly affected with potential yield loss. The
relationship between previous crop and tight-lock in cotton requires further investigation as a
potential management strategy.
As determined on the Darling Downs in 2018/19 and in the Macintyre in the 2017/18 season,
losses due to boll rots are not restricted to CQ. On the Darling Downs, at time of surveying 11% of
bolls were tight-locked and 2% with seed rot and boll rot. At harvest, at least 0.5bales/ha yield
loss in one field was attributed to boll rot on lower lodged branches due to rain. This equates to
an estimate of $22,500 loss due to boll rot.
This project determined that crop rotation is key to reducing lost production from Verticillium
wilt. For example, two successive years of corn (a non-host for V. dahliae) increased the
subsequent cotton yield by 1.9 bales/ha. At $500/bale this equates to an additional $950/ha
compared to continuous cotton. An economic study would need to be conducted to understand
the full impact of crop rotation on the farm profitability, however the initial findings are very
promising. Integral to the management of Verticillim wilt and associated productivity
improvements was the development of the new, rapid assay plant assay to identify V. dahliae
and, importantly, the strain.
3.1.6 Lessons learnt
This project demonstrated benefits in collaborating internationally to fast-track improvements in
scientific methodology.
3.1.7 Collaboration and industry interaction
The cotton industry has historically conducted disease surveys separately in New South Wales and
Queensland to monitor disease severity and spread. While this surveillance has provided industry
with disease trends, improving disease management has relied on traditional R&D trials to inform
management advice. This sub-project developed new digital approaches to capture disease
survey data independent of state borders, and analyse it, in order to develop a holistic systems
approach to the management of cotton disease.
To ensure the goal a national disease survey was achieved, quarterly meetings of the Cotton
Pathology Survey Project team were convened, involving representatives from Department of
Agriculture and Fisheries Queensland, NSW DPI and CottonInfo. These multi-agency meetings
reviewed the progress of early season surveys and addressed any concerns participants may have
had regarding the new process.
20Final Report – Digital technologies for dynamic management of disease, stress and yield
The involvement of CottonInfo on surveys has resulted in a successful collaboration in which
CottonInfo now have a better understanding of cotton diseases and state pathology teams have a
better understanding of regional issues directly resulting in quick and effective dissemination of
research findings back to the cotton community. This has been through regional newsletters, field
day presentations (CottonInfo and Pathologists), research updates at annual general meetings
and Crop Consultants Australia (CCA) meetings, CottonInfo E News, industry articles and
CottonInfo presentations at Cotton Seed Distributors (CSD) roadshows. A summary of the
industry interaction is provided in Section 5.1.
Contacts developed in the wine industry through the project Industry Reference Group were built
upon and used to inform project methods and as a soundboard for ideas.
At the international level, the project team worked with researchers and students from Texas
A&M University, and our collaborators in Spain generated nit mutants used to identify eight
V. dahliae isolates. This project demonstrated benefits in collaborating internationally to improve
methodology approaches.
21You can also read