RIT Digital Institutional Repository - Rochester Institute of Technology - RIT Scholar Works
←
→
Page content transcription
If your browser does not render page correctly, please read the page content below
Rochester Institute of Technology
RIT Digital Institutional Repository

Theses

4-2022

Text Analysis of Airline Tweets
Essa ALTamimi
esa4675@rit.edu

Follow this and additional works at: https://repository.rit.edu/theses

Recommended Citation
ALTamimi, Essa, "Text Analysis of Airline Tweets" (2022). Thesis. Rochester Institute of Technology.
Accessed from

This Master's Project is brought to you for free and open access by the RIT Libraries. For more information, please
contact repository@rit.edu.
TEXT ANALYSIS OF AIRLINE
 TWEETS
 by

 Essa ALTamimi

A Capstone Submitted in Partial Fulfilment of the Requirements for

 the Degree of Master of Science in Professional Studies:

 Data Analytics

 Department of Graduate Programs & Research

 Rochester Institute of Technology
 RIT Dubai
 April 2022

 i
RIT
 Master of Science in Professional Studies:
 Data Analytics

 Graduate Capstone Approval

Student Name: Essa Ahmad ALTamimi
Graduate Capstone Title: TEXT ANALYSIS OF AIRLINE TWEETS

Graduate Capstone Committee:

Name: Dr. Sanjay Modak Date:
 Chair of committee

Name: Dr. Ehsan Warriach Date:
 Member of committee

 ii
Acknowledgments

I would like to extend my thanks and appreciation to Dr. Ehsan Warriach, my mentor, for

his continuous support and guidance during the capstone project, special thanks also to

all the RIT Dubai Members from the admission to all professors in the data analytics

program for giving me a chance to enter the world of data.

Moreover, I would like to extend my gratitude to Dr. Sanjay Modak, the Chair of Graduate

Programs and Research in RIT Dubai for his continuous support and cooperation

throughout the program. Finally, I want to express my gratitude to my friends and

colleagues and last but not the least, my family for supporting me since the research

began.

 iii
Abstract

By acting as a succinct summary, keywords and key phrases can be a useful tool for
swiftly assessing enormous amounts of textual material. A "keyword" is defined as a
"word that briefly and accurately characterises the subject, or an aspect of the subject,
presented in a text," according to the International Encyclopaedia of Information and
Library Science (Bolger et al., 1989) (Feather et al., 1996). People are more likely to
complain when they are anxious, according to research (Bolger et al., 1989)(Meier et al.,
2013), and moods are affected by time (Ryan et al., 2010). Due to this study, airlines will
have a tool to calibrate and judge the positivity/negativity of tweets based on the day of
the week, which is a topic that has yet to be researched. We want to do text and sentiment
analysis on extracted airline travel tweets, taking into account when the tweet was
‘tweeted’ and if it had a good or negative impact.

Keywords: social media, customer experience, supervised learning, airline tweets, text
analysis, classification.

 iv
Table of Contents
ACKNOWLEDGMENTS ..................................................................................................................................... III
ABSTRACT ....................................................................................................................................................... IV
TABLE OF CONTENTS ........................................................................................................................................V
LIST OF FIGURES .............................................................................................................................................. VI
CHAPTER 1 ....................................................................................................................................................... 1

 1.1 Background information ...................................................................................................................... 1
 1.2 Statement of problem ......................................................................................................................... 1
 1.3 Project goals......................................................................................................................................... 2
 1.4 Methodology........................................................................................................................................ 3
 1.5 Limitations of the Study ....................................................................................................................... 6
CHAPTER 2 – LITERATURE REVIEW .................................................................................................................... 7
CHAPTER 3 – PROJECT DESCRIPTION ............................................................................................................... 11

 3.1 Airline Tweets ....................................................................................................................................11
 3.2 Machine learning ...............................................................................................................................12
 3.2.1 Supervised Learning ....................................................................................................................13
 3.2.2 Unsupervised learning ................................................................................................................14
 3.3 Dataset description ............................................................................................................................15
 3.4 Exploratory Data Analysis (EDA) ........................................................................................................15
 3.5 Dataset pre-processing ......................................................................................................................20
 3.6 Model Evaluation Parameter .............................................................................................................24
CHAPTER 4 – PROJECT ANALYSIS ..................................................................................................................... 26

 4.1 Experimental results & Analysis ........................................................................................................26
 4.1.1 FastText .......................................................................................................................................26
 4.1.2 Linear SVC ...................................................................................................................................26
 4.2 Results ................................................................................................................................................27
CHAPTER 5 – CONCLUSION ............................................................................................................................. 31

 5.1 Conclusion....................................................................................................................................31
 5.2 Recommendations and Future Work ..........................................................................................31

 v
List of Figures

Figure 1: Top 10 Hashtags............................................................................................................................16
Figure 2: Word count distribution ...............................................................................................................17
Figure 3: Most Frequently Used Words .......................................................................................................18
Figure 4: Sentiment wise word count ..........................................................................................................19
Figure 5: Airlines companies mentioned by month number .......................................................................19
Figure 6: Pre-processing of airline attribute - Sentiment of training data ..................................................20
Figure 7: Selection of rows in training data .................................................................................................20
Figure 8: Handling encodings and htmls .....................................................................................................21
Figure 9: Removal of tabs and newlines ......................................................................................................21
Figure 10: Emot and regex based emoticon handling .................................................................................21
Figure 11: Basic final text cleanings .............................................................................................................22
Figure 12: Addition of data column .............................................................................................................22
Figure 13: Bias of Sentiments ......................................................................................................................23
Figure 14: SVC Model explanation...............................................................................................................27
Figure 15: Cross validation...........................................................................................................................27
Figure 16: Confusion Matrix on the crawled testing data ...........................................................................28
Figure 17: Model Classification Report ........................................................................................................28
Figure 18: Weekend effect on sentiment of tweets ....................................................................................29
Figure 19: Word cloud - Positive and Negative Tweets ...............................................................................29

 vi
Chapter 1
1.1 Background

Social media is a powerful source of communication. Information extracted and analysed
from social media offers valuable insight for companies regarding their products and
services. A customer’s experience is an important concern for the air-travel industry in
particular, and Twitter has become a popular platform for travellers to share feedback.
Airline companies invest time and resources to enhance customer loyalty. By exploring
customer feedback, airlines can allocate resources to the weak areas of customer
satisfaction, increasing economic and social development of the company. Without the
use of machine learning and artificial intelligence, orthodox businesses spend hours of
human effort completing manual annotations of tweets to group them into
positive/negative sentiments, thus increasing the Time to insights.

Moreover, errors that occur from humans can affect the manual text tagging accuracy,
such errors can result from fatigue or overconfidence. However, computer aided Text
Analysis (NLP) can reduce this time to a few minutes.

1.2 Statement of problem

Interpreting and classifying opinions and emotions in subjective data (like tweets) is
referred to as sentiment analysis. Sentiment analysis of customer experience is a hot
topic and is applied in various industries, such as finance, business, politics, and risk
assessment. Some researchers (Kandasamy et al., 2020) (Rezaeinia et al., 2019) (Yadav
et al., 2020) have discussed various machine learning, artificial intelligence, and deep
learning, and other techniques for sentiment analysis such as Word embedding, Deep
Belief Network, Recursive Neural Network, Recurrent Neural Network, and approaches
involving Refined Neutrosophic Sets.

 1
While general frameworks have been explored, we will be utilizing these in conjunction
with machine learning methods on a twitter sentiment analysis for this project.

Keywords and key phrases can be a useful tool for analysing large amounts of textual
material quickly by serving as a concise summary. International Encyclopaedia of
Information and Library Science (Bolger et al., 1989) defines a “keyword” as a “word that
succinctly and accurately describes the subject, or an aspect of the subject, discussed in
a document.” (Feather et al., 1996). Research suggests that people tend to be more
willing to complain when they are stressed (Bolger et al., 1989) (Meier et al., 2013), and
moods are affected by time (Ryan et al., 2010). Therefore, this project will provide airlines
with a tool to calibrate and judge the positivity/negativity of the tweet based on the
weekday (Sunday, Monday, …), which is an issue that has yet to be studied. We aim to
perform text & sentiment analysis on extracted airline travel tweets while also taking into
consideration when the tweet occurred, and whether it has resulted in a positive or
negative effect.

1.3 Project goals

(a) To scrape the tweets mentioning the top airlines of interest

(b) To identify the sentiment of the above scraped tweets

(c) To analyse the relationship, if any, between time of the tweet and the sentiment of
the tweet

Research questions we aim to answer

1) What causes negative sentiments in a tweet?

2) What causes positive sentiments in a tweet?

3) What is the effect of time on the sentiment of the tweet?

 2
1.4 Methodology

List of innovations and why the method and visualization are better than state of the art:

● Comparing the accuracy of the results for both logistic regression and SVM.

● Making it possible to create a good classification model with greater than 65% f1
score after manually labelling as few as 10 samples per class

● Creating a new list of better stop words and processing the text based on these
custom stop words to avoid changing the meaning when filtering the tweets while
ensuring that the words that do not contribute much to the meaning of the text are
removed.

● Studying the behaviour and correlation of sentiment with day of week.

Steps and algorithm:

1) Gathering data:

To gather data quickly and efficiently, we planned to use the web scraping software,
Octoparse. Octoparse takes in a given URL and scrapes selected data. We spent some
time testing this method and found that even if every team member commits to scraping
data for a week, Octoparse would still fail to provide a large enough dataset. So, we
explored other methods, and decided to use ScrapeHero.

To determine the airlines we want to analyse, we used those that have the largest
revenues and most passengers carried, thus selecting Delta, American, Lufthansa,
United, Air France, Southwest, China Southern, and Ryanair. Since COVID-19 disrupted
the airline industry, we took tweets that mentioned these airlines prior to the pandemic,
from August 2019 to December 2019. Using the advanced search provided by Twitter,
we got a url for all the tweets meeting these criteria. ScrapeHero used this url and scraped
the webpage, capturing the user’s handle, the user’s name, the tweet, the number of

 3
retweets, replies, and likes, and the time and date of the tweet (unix timestamp). We
exported this data as a csv file.

While cleaning this data, we found that ScrapeHero included tweets from outside the date
range we specified, and some tweets that did not mention any airline. After excluding
these, our data reduced by about 1,000 data points.

2) Collecting external resources/data:

While the above data was being labelled, we looked for a representative dataset and
found the airline tweets dataset of “Crowdflower's Data for Everyone library” to train our
sentiment classification model and build our model for few shots classification. We then
applied these models in the relevant sections on our scraped dataset. This dataset
(Crowdflower, 2019) was scraped in February 2015 and the tweets were classified into
positive, negative, and neutral.

3) Building a machine learning model:

Several machine learning methods can be used to classify tweets. We explored two
methods: logistic regression and support vector classifiers (SVC).

3.1) Logistic Regression model:

In this project, we train and test logistic regression that classifies tweets into positive and
negative using the following algorithm, Python 3 and its relevant libraries:

First, we import the “Crowdflower’s airline tweets” dataset and identify relevant features
(tweet text and airline sentiment). This dataset doesn’t include missing values. Then, we
extract two subsets: one for positive tweets and the other for negative tweets. After that,
each subset is further divided into training and testing sets. Then, the positive and
negative sets are combined to form a training and test datasets. This ensures that each
set has an equal number of positive and negative tweets.

 4
Then, we process the tweets. This includes the removal of stop words, hashtags,
username mentions, old RT style, hyperlinks, signs (such as $). After cleaning the tweets,
we split them into a list of tokenized words. Since negative stop words (non, not, nor, no,
…) can change the meaning and sentiment if removed, they are not included in the stop
word list. Moreover, duplicate words are removed. Next, a dictionary is constructed
counting the number each word appeared in positive and negative tweets. This dictionary
is used to build a logistic regression model. Gradient descent is used to reach
convergence. A cutoff of 0.5 is used to classify the tweets and predict the outcome.
Finally, the test dataset is used to test the model and calculate the accuracy. In our model,
the accuracy is around 82%.

3.2) SVC model with word embeddings:

SOTA techniques use word embeddings along with Machine learning models to increase
accuracy. Word embeddings which convert text into numbers to create a dictionary
decrease the amount of training data set and increase the performance of the Machine
Learning model. For the prediction of sentiments, we had explored a combination of
Word2Vec with SVC and FastText embeddings with SVC. From the crowdflower dataset,
we had filtered and kept only the data instances whose confidence is 1 for training the
model.

After applying the preprocessing steps on the tweets as we had done during logistic
regression, we used the language model for generating the word embeddings of the clean
tweets. These word embeddings then became the training feature for the Support Vector
Classifier which could then give the output of sentiment. For the FastText approach, we
used gensim to load the vector file from the common crawl models downloaded from
fasttext (FastText, 2020) and converted it to a bin model because the loading time of the
vector was more. We then continued to use gensim to load the bin model which helped
in converting clean and processed tweets into embeddings of size 300. Such embeddings
were generated on each tweet of both, crowdflower dataset as well as our crawled
dataset. We trained the SVC model on the embeddings of tweets from crowdflower

 5
dataset and we used the embeddings of each tweet from our crawled dataset as input
features to give sentiment predictions on our crawled dataset,

4) Correlation of tweet sentiment with day of the week:

We extracted the day of the week from the date_stamp of each tweet using Python’s
datetime module. Once the sentiment was predicted, we then gave a score of +1 to
positive, -1 to negative and 0 for the neutral sentiment. After some missing value
imputations and handling outliers, we then calculated the mean sentiment score for each
day of the week in our crawled twitter dataset which we crawled using the mentioned
tools.
After some further analysis, we got a correlation of -0.44 between day of the week and
sentiment which means people were more negative towards the weekends than the
weekdays. We also plotted the mean sentiment vs day of the week and also vs dates
(August 1st to December 31st)

1.5 Limitations

In the past few years, the world of travel has seen a drastic change due to the pandemic,
which led to various crests and troughs in the travel seasons. Due to this, there was a
quick change in airline ticket fees which will definitely have an impact on the actual study
of the airline tweets. Therefore, a model will be built based on the data from the pre
pandemic era which would be the ideal solution.

 6
Chapter 2 – Literature Review
There have been several studies in the past which analysed the airline travel tweets
across the globe. They had employed the usage of various methods and pipelines. They
achieved varying reports of accuracy ranging between 50% to 90%.

Several papers available in literature have analysed social media complaints such as
(Tsakalidis et al., 2018). They proposed an unsupervised method, utilizing information
from the network and time sensitive text. In comparison to simply text-based models, their
examination in a real-time simulation environment revealed the efficacy and resilience of
their technique versus competing baselines, attaining a substantial 20 percent boost in F-
score.

The research in (Suryotrisongko et al., 2018) used a tweet dataset of 3000 rows which
was of the feedback for Surabaya’s City Government. It was classified as a complaint or
non-complaint tweet, and it resulted in systems that can categorise tweets automatically
with an accuracy of 82.5 percent.

The fuzzy system which was proposed in (Vashishtha et al., 2019) integrated NLP
techniques with Disambiguation of Word Sense leveraging a new unsupervised 9 fuzzy
rule-based system which classifies the post into either of positive/ neutral or negative
sentiments. Their results helped in choosing which lexicons are best for the use case of
social media. Their method of fusion of fuzzy logic with lexicons for sentiment classes can
be adjusted to any lexicon. They can also be adjusted for any dataset.

Recently, some papers have also analysed tweets of airline travel such as (Kumar et al.,
2019), which used Python to retrieve tweets about airlines using twitter API and then used
support vector machines and artificial intelligence networks methods to analyse those
tweets. It demonstrated how to use ML to analyse tweets in order to improve the user
experience. Word embedding with Glove dictionary technique and n-gram approach were
used to extract features from tweets. CNN outperformed ANN and SVM models in this
study, and it used association mining to map the link between tweets and sentiment
categories.

 7
In contrast, (Tiwari et al., 2019) proposed using machine learning to identify passenger
tweets about aircraft services in order to better understand the emotional trend. On an
actual dataset, they were able to reach an accuracy of around 80% using Random Forest
(RF) and Logistic Regression (LR) to categorise each tweet into positive, negative, and
neutral sentiment.

In (Khan et al., 2018), the paper's major goal was to analyse tweets about airlines from
four different regions: Europe, India, Australia, and America, with the goal of predicting
consumer loyalty. The TextBlob analyzer was used to do the sentiment analysis. The
positive and negative mean sentiment ratings were then calculated and visually shown
using the tweets. Random Forest, Decision Tree, and Logistic Regression were the three
classifiers used. Random Forest has a maximum classification accuracy of 99.05 percent
after 10-fold cross validation.

There were other models based on Transformers. Like, for example, for Twitter sentiment
analysis, (Naseem et al., 2020) employed Transformer-based Deep Intelligent Contextual
Embedding. In this, Deep intelligent contextual embedding was used to improve the
quality of tweets by reducing noise and taking into consideration word sentiments,
polysemy, syntax, and semantic knowledge.

(Jain et al., 2020) compared Random tree and Decision tree ML techniques to provide
recommendations to customers using airline reviews. People are more likely to complain
when they are anxious, according to research in (Meier et al., 2013).

An examination of the temporal effects of weekend and weekdays was required. We
found (Ryan et al., 2010) which does exactly that in addition to exploring work versus
nonwork experiences on mood and other well-being indicators too.

(Utama et al., 2019) did Sentiment classification on Airline Tweets. They used Mutual
Information for Feature Selection. Despite recent advances in text analysis, many
approaches have limitations for tweets (Wang et al., 2017). They proposed using
convolutional neural networks framework. It combined implicit as well as explicit
representations of short text for classification. They obtained the short text embedding by

 8
joining the words and relevant concepts on top of pre-trained word vectors and further
incorporating character level features into the model.

Text from twitter (tweets) fall under the category of short-texts since Twitter allows a
maximum character length of 280 characters only and using supervised and
unsupervised natural language processing methods, they performed analysis on
approximately 350,000 tweet replies to U.S. politicians in (Jaidka et al., 2019). Therefore,
unlike large paragraphs or documents, tweets might not observe the syntax of natural
language thus including heavy usage of abbreviations and internet slangs (eg: LOL,
ROFL, …).

(Rezaeinia et al., 2019) utilised techniques such as POS tagging, lexicon-based
approaches, and Word2Vec/GloVe methodologies in their method. They discovered that
Improved Word Vectors (IWV) are particularly successful for sentiment analysis after
comparing the method's accuracy with several deep learning models. (Yadav et al., 2020)
looked at more of these methods.

Research in (Gautam et al., 2020) presented a semi-supervised bootstrapping approach
that calculated transportation services related complaints on social media platforms and
their main strategy began with a limited set of annotated samples, which were used to
establish a preliminary set of language indicators relevant to complaints, which were then
used to supplement data. This enriched data is then utilised to extract other indications
using the same procedure, which is done until no more indicators can be located.

From 1961 to 2021, a survey publication (Li et al., 2020) was valuable in assessing state-
of-the-art methodologies, concentrating on models ranging from classical models to deep
learning. This study concluded with a summary of significant implications, future research
directions, and issues facing the research area, as well as a complete comparison of
different approaches and outlining the benefits and downsides of various assessment
measures.

In summary, after studying through all the papers mentioned in the literature review, we
feel inspired by the psychology paper and also found that there is a lack of papers which
study the weekend effect on the emotional state and mood of the travellers thereby

 9
affecting the sentiment of the tweets that they are posting. For this, we will have to scrape
twitter for tweets and build a machine learning model that predicts the sentiments for us
and execute the analysis for this. The literature papers referenced the use of traditional
machine learning algorithms like Support Vector Classifiers and Random Forest
Classifiers. We also got some insights into special cleanings and pre-processings that
are required for a dataset involving social media and short texts. Finally, the survey paper
(Li et al., 2020) was instrumental in providing a comprehensive list of different techniques
so that we could design our experiments accordingly.

 10
Chapter 3 – Project Description
3.1 Airline Tweets

Companies can gain important information into their products and services by extracting
and analysing data from social media. The air travel business, in particular, is concerned
about the consumer experience, and Twitter has become a popular venue for travellers
to communicate their thoughts. Without machine learning and artificial intelligence,
traditional firms waste hours of human work manually annotating tweets to categorise
them as good or bad, lengthening the time to get insights. Airlines devote time and
resources to improving consumer loyalty. Airlines can direct resources to the weak areas
of customer satisfaction by analysing customer input, resulting in increased economic and
social development for the organisation.

Furthermore, human mood influence such as tiredness and skills might affect the manual
text tagging accuracy. Computer-assisted Text Analysis, on the other hand, can cut this
time in half. Sentiment analysis is the process of interpreting and classifying opinions and
emotions in subjective data (such as tweets). Customer sentiment analysis is an
important issue that is used in a variety of areas, including banking, business, politics,
and risk assessment. Word embedding, Deep Belief Network, Recursive Neural Network,
and approaches incorporating Refined Neutrosophic Sets are some of the machine
learning, artificial intelligence, and deep learning technologies that can be utilised for
sentiment analysis, according to some researchers.

While broad frameworks have been investigated, for this project, we will be using them in
combination with machine learning approaches on a twitter sentiment analysis.
By acting as a succinct summary, keywords and key phrases may be a valuable tool for
swiftly assessing enormous volumes of textual content. A "keyword" is defined as a "word
that briefly and accurately represents the subject, or an element of the subject, covered
in a document" by the International Encyclopedia of Information and Library Science.

 11
People are more likely to complain when they are worried, according to research, and
moods are impacted by time.

As a result of this study, airlines will have a tool to calibrate and assess the
positivity/negativity of tweets based on the day of the week, which is a topic that has yet
to be researched. We want to do text and sentiment analysis on extracted airline travel
tweets, taking into account when the tweet was made and if it had a good or negative
impact.

3.2 Machine learning

The purpose of machine learning (ML) is to use mathematical models of data to assist a
computer in learning without being explicitly directed to do so. Machine learning is a
subset of artificial intelligence (AI). Algorithms are used to analyse data and find trends,
which are then utilised to develop prediction models. Machine learning, like humans,
improves with more data and experience.

ML can be subdivided into further 2 subcategories:

 1. Supervised Learning
 2. Un-supervised Learning

The most popular methods of learning are supervised and unsupervised, with
reinforcement being a sequential decision maker technique. Until now, machines have
been unable to make decisions without being trained (Matthew Botvinick, May 2019).

Supervised learning is derived from the word supervisor, which meaning teacher. The
class will be categorised or predicted in this scenario. The right answers were already
marked with the matching class labels during what is called algorithm training. Support
Vector Machines (SVMs), Random Forest Trees (RFTs), and Decision Trees (DTs) are
common supervised machine learning techniques (Singh, Thakur, & Sharma, 2016).
When there are no class labels on the input data, unsupervised learning happens. We
wish to model the data's underlying structure in order to learn more about the data.

 12
Association and clustering are the two main forms (Ceriottia, 2019). K-means clustering,
affinity propagation, and other unsupervised methods are well-known.

3.2.1 Supervised Learning
The following are the workings and specifics of some well-known supervised machine
learning algorithms that were employed in this project:

Logistic Regression:

When the output variable is discrete (categorical), and the class should be predicted
rather than categorised, the logistic regression technique should be abandoned. When it
comes to machine learning techniques for categorising binary data, logistic regression is
frequently used. The purpose of Logistic Regression is to enhance outcomes by
combining data from several sources (Swaminathan, 2018). The default label class is
always used to predict outcomes, but the results and probability are always determined
after all categorical values have been changed to numerical values and all data has been
normalised.

In ecological study, logistic regression, also known as sigmoid regression, was developed
by statisticians to explain the characteristics of a population that was rapidly growing and
depleting its ability to wear out the environment. An S-shaped curve may translate any
real-valued range into a number between zero and one, but not precisely at the limit of
one.

 1
 1 + −

 Equation 1 Sigmoid equation

Where e is the logarithms' base (Euler's broad variety or the EXP () function on your
spreadsheet), and price is the true numerical price to be changed.

While the following is the regression equation in which the intercept and slope are
combined:

y=mx+c

 13
Equation 2 Regression equation

A generalised equation for a multivariate regression model is given below:

 y = β0 + β1.x1 + β2.x2 +….. + βn.xn

The regression is created in a few steps, starting with feature selection, normalising
features, choosing a loss function and hypothesis, setting hypothesis parameters,
minimising the loss function, and lastly testing the data's function.

Random Forest Regressor:

Random Forest has previously demonstrated that it creates a forest before randomising
it. It builds the forest with an collective of Decision Trees and trains it with the Bagging
Method for the most part. Because the ensemble approach is used, the result is improved.

The steps below will help us understand how Random Forest works:

To begin, select random samples from the dataset.

After then, each sample will be given a decision tree to work with. It will generate a
projected final outcome based on those options.

Voting may take place in this phase for each expected outcome.

Finally, because it is the very final prediction outcome, the prediction output which gets
the maximum votes gets chosen.

3.2.2 Unsupervised learning
Unsupervised learning algorithms are taught on data that hasn't been classified or
labelled, allowing them to operate on it without supervision. Dispersed data is organised
with patterns or similarities and differentiations using this approach, which requires no
prior training.

The algorithm didn’t get any training from a training dataset, unlike supervised learning.
As a result, the algorithm concentrates on us uncovering the hidden pattern in unlabelled
facts.

 14
3.3 Dataset description
Utilization of a product called Octoparse, which is a web scraping platform, to collect data
rapidly and effectively was the plan. So, we put Octoparse to the test and discovered that
even if every team member committed to scraping data for a week, Octoparse would still
fall short of providing a large enough dataset required for our task. We decided to use this
strategy on other platforms as well. After experimenting with others, another product
called ScrapeHero was selected.

The airlines we wanted to look at where those with the highest revenues and the most
passengers with an active twitter timeline. Delta, American, Lufthansa, United, Air France,
Southwest, and China Airlines were among the airlines that carries highest passengers.
Southern and Ryanair are two of the most popular airlines too. Since COVID-19 wreaked
havoc on the aviation sector, we compiled a list of tweets that highlighted it prior to the
pandemic, that is, from July 2019 to December 2019.

Twitter provides an advanced search option. Using that, we obtained the url for all tweets
meeting the above criterias. Then, ScrapeHero used this url & scraped the webpage,
capturing user’s handle, user’s name, tweet, number of retweets, replies, & favorites, and
time and date of the tweet (unix timestamp). We exported this data as a csv file. This will
act as our main master data from Twitter and act as the test data too.

We got our training dataset of airline tweets from Kaggle which originally came from
Crowdflower's "Data for Everyone library". Crowdflower has a large library of 'Off-the-
Shelf' datasets that are meant to increase accuracy, overall performance, and supply
high-quality datasets at scale for specific AI programme requirements. They're continually
creating fresh datasets to fulfil the demands of their worldwide clientele.

3.4 Exploratory Data Analysis (EDA)
After cleaning, the master dataset had about 629k rows while crowdflower dataset had
about 15k rows.

We performed some exploratory data analysis on the master data, looking at word lengths
in the tweets, number of words used in the tweets, mentions (@), hashtags (#), tweet
sentiments, and airlines mentioned.

 15
Figure 1: Top 10 Hashtags

Most tweets used words that are 4 characters long, and the average word length in the
dataset is 5 characters long.

 16
Figure 2: Word count distribution

Maximum tweets, that is approximately 4200 tweets, had a word count in the range of 9-
12 words.

The top 10 most frequently used words are (in order): ‘flight’, ‘not’, ‘no’, ‘so’, ‘get’, ‘time’,
‘service’, ‘one’, ‘plane’ and ‘like’.

 17
Figure 3: Most Frequently Used Words

Tweets with a negative sentiment have an average of 14 words, while both neutral and
positive sentiment tweets have an average of 9 words.

 18
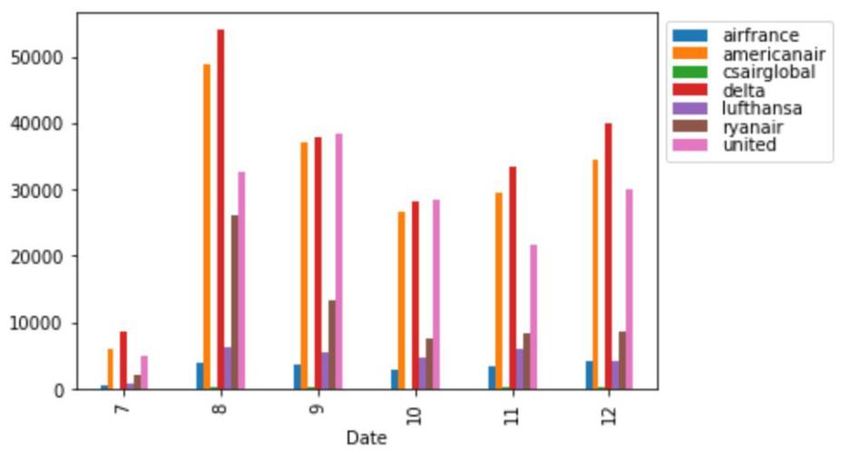
Figure 4: Sentiment wise word count

The two graphics below show the relationship between time and airlines mentioned. The
figure 5 shows the airlines mentioned by month number.

 Figure 5: Airlines companies mentioned by month number

 19
3.5 Dataset pre-processing

When we convert raw data into an understandable and clean form it is called Pre-
processing. Real data is often unclean and filled with incorrect data points. It can be
caused due to poor data collection. And in case of data models, it is said that if we feed
models unclean data, the models are inaccurate. Preprocessing the data solved the
problem.

We perform the following steps to clean and preprocess the training dataset.

1. We remove the duplicates or Nan values

 Figure 6: Pre-processing of airline attribute - Sentiment of training data

2. Only selecting the rows where the data tagger was 100% confident of the sentiment

 Figure 7: Selection of rows in training data

 The dataset becomes smaller with 10409 rows instead of 14640 previously.

3. Since it is tweets dataset, there can be encoding problems or htmls. So, we convert
 the text forcefully to ascii characters

 20
Figure 8: Handling encodings and htmls

4. Text might contain characters like ‘\r’ and ‘\n’ for tabs and newlines. We remove such
 special characters.

 Figure 9: Removal of tabs and newlines

5. Since it is a social media text, there will certainly be emojis, emoticons etc. We handle
 them using the function below which uses a python library named emot

 Figure 10: Emot and regex based emoticon handling

6. Finally, we do all the basic text cleanings like removal of user name mentions,
 hashtags, numbers etc using the function below

 21
Figure 11: Basic final text cleanings

7. We combine 3 columns related to date into a single ‘Date’ column

 Figure 12: Addition of data column

It is evident from the EDA of the training data that number of tweets that are tagged as
negative are the highest. The numbers are very unbalanced. We need to take care that
this bias does not creep into our model.

 22
Figure 13: Bias of Sentiments

 23
3.6 Parameters for Model Evaluation
To evaluate the classification model, the following metrics can be analyzed:

 1. 10-fold cross validation:

Cross-validation is a resampling technique for evaluating machine learning models on a
small sample of dataset.

The following is the usual procedure for performing a 10-fold cross validation:

a) Shuffling the dataset.

b) Divide the data into k groups.

c) For each distinct group:

d) Use the group as a holdout or test data set. e) Use the remaining groups as training
data sets.

f) Fit a model to the training data and test it on the test data.

g) Save the evaluation score but reject the model. h) Summarize the model's skill using
the sample of model evaluation scores.

The mean of the model skill scores is frequently used to describe the outcomes of a 10-
fold cross-validation run.

 2. Confusion Matrix:

The confusion matrix is an N x N matrix, that is used to evaluate the performance of a
machine learning classification model, N represent the output classes number. The matrix
cross check how the model been able to correctly classify each output correctly or not.
Moreover, then we can observe certain metrics from the matrix such as accuracy, which
can let us know how good is the model.

 24
3. Classification Report:

The classification report displays the model's accuracy, recall, F1 score, and support
score.

 25
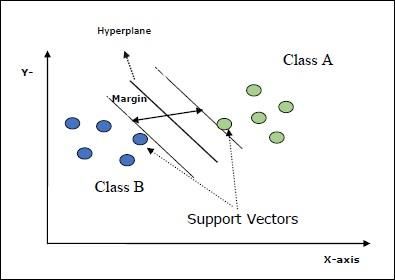
Chapter 4 – Project Analysis
4.1 Experimental results & Analysis

Following deep learning models and ML models are implemented.

 1. FastText
 2. Linear SVC

4.1.1 FastText
FastText is a library for quickly learning word representations and categorizing sentences.
It's the result of a Facebook study. 294 languages on Facebook are available in pre-
trained model.

For English language, we will be utilizing the pre-trained model.

4.1.2 Linear SVC
Support vector machines (SVMs) or Support Vector Classifiers (SVCs) are supervised
machine learning models that are commonly used for classification and regression.

The basic blocks of SVC or SVM are :

The closest datapoint to the hyperplane are known as Support Vectors.

The Margin is the space between two lines on the nearest data points of distinct classes.

The HyperPlane is a decision plane or space that splits a set of objects into multiple
classes.

The fundamental purpose of SVMs is to partition datasets into various groups so that a
maximum marginal hyperplane (MMH) may be found.

This may be accomplished in two steps:

 26
1. Support Vector Machines will first iteratively construct hyperplanes that best divide
 the classes,
 2. and then it will pick the hyperplane that best separates the classes.

 Figure 14: SVC Model explanation

4.2 Results
We got a 10-fold cross validation of 85% on our training dataset of tweets which we
sourced from Kaggle.

 Figure 15: Cross validation

Given the evaluation parameters defined above, we checked the confusion matrix and it
looked like:

 27
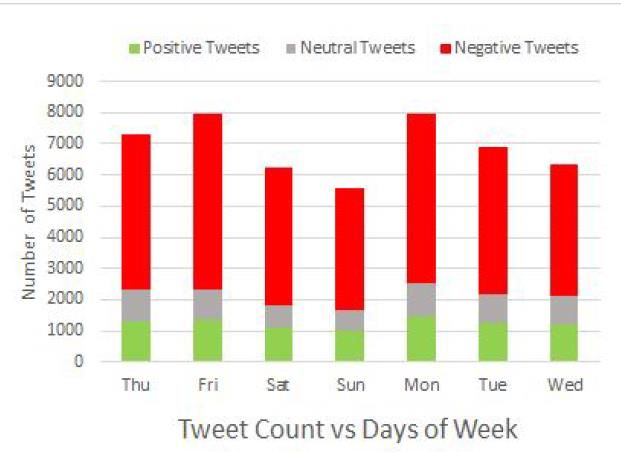
Figure 16: Confusion Matrix on the crawled testing data

We see that from the confusion matrix, there were total 37 (26 + 5 + 1 + 0 + 2 + 1 + 0 + 0
+ 2) tagged samples from our crawled dataset. Out of this 37, there were 32 (26 + 5 + 1)
which were truly in NEGATIVE class. Our model predicted 26 correctly.

In a similar way, out of 2 tweets that were tagged as POSITIVE, our model predicted both
correctly.

We now check the classification report for further details.

 Figure 17: Model Classification Report

Our model has a good weighted average f1 score of 84% on our crawled dataset.

From this, it can be inferred that the errors of Support Vector Classifier when used with
FastText embeddings for English are more than 65%. Hence, we use SVC for predicting
on all the tweets.

When we analyze the results with days of the week, we observe a significantly higher
number of negative tweets on Fridays and Mondays and very low on Saturday and
Sunday.

 28
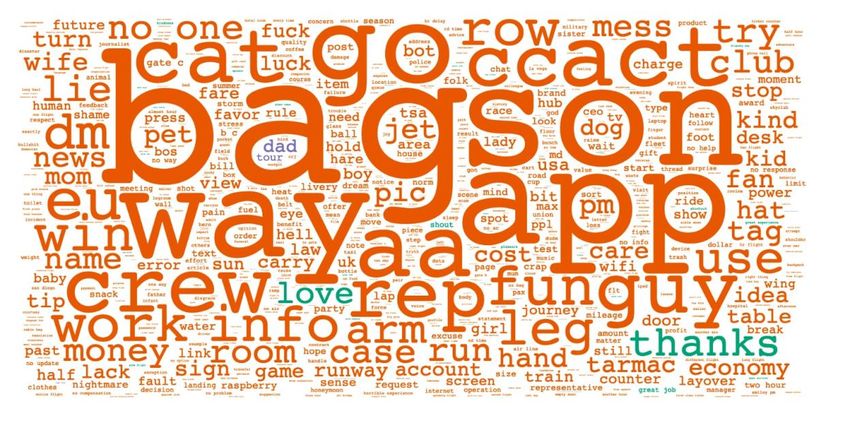
Figure 18: Weekend effect on sentiment of tweets

 Figure 19: Word cloud - Positive and Negative Tweets

We observe from the word cloud that tweets related to “bags” are causing the most
negative tweets. It means the airlines need to focus the most on their luggage problems

 29
like bags being lost, allowed baggage limits. Other complaints were related to getting no
response, layover, flight times and bills as seen in the word cloud.

We also see that people are complaining mostly about crews, wifi, cost etc.

For the positive side, people were happy with the experience “great experience”, however
the number is very less as seen by the size of the word in the word cloud.

 30
Chapter 5 – Conclusion
5.1 Conclusion
Deep learning embeddings and machine learning approaches

This project proposed an approach to analyzed the airline tweets using 3 class sentiments
by utilizing deep learning embeddings and machine learning. Twitter was scraped using
third party tools and we used training data from a dataset in Kaggle which was tagged
with 3 class sentiments. An effective machine learning model was built by training, testing,
and evaluating Support Vector Classifiers along with FastText embeddings. After several
steps of cleaning and pre-processing, Linear SVC gave a weighted average f1 score of
84%.

Since the sentiments clearly differs by the days of the week, the airline industry may have
to consider business decisions which take this analysis into account. For example, having
a varied work force of customer service representatives depending on the day of the week
may prove beneficial. Digging deeper down into the causes of negative sentiments may
also reveal some pain points, helping the airline industry in forming a plan of action to
mitigate these issues.

5.2 Recommendations and Future Work

More data can be scraped from Twitter using the third-party scraping tool and more
machine learning models can be tested.

To crystallize the analysis, all one has to do is take airline tweets from a larger duration
of choice and use this same approach of tagging the tweets, training using machine
learning models and predict the sentiments using our model. Further statistical analysis
can be done to check the correlation between the sentiment with the day of the week.

 31
References

1. Bolger, N., DeLongis, A., Kessler, R. C., & Schilling, E. A. (1989). Effects of daily

 stress on negative mood. Journal of Personality and Social Psychology, 57(5),

 808–818. https://doi.org/10.1037//0022-3514.57.5.808

2. Crowdflower dataset. (2019). https://www.kaggle.com/crowdflower/twitter-airline-

 sentiment

3. FastText common crawl vectors. (2020).

 https://dl.fbaipublicfiles.com/fasttext/vectors-english/crawl-300d-2M-subword.zip

4. Feather, J., & S. P. (1996). Implementing online archiving. International

 encyclopedia of information and library science, London and New York.

5. Gautam, A., Mahata, D., Gosangi, R., & Shah, R. (2020). Semi-Supervised

 Iterative Approach for Domain-Specific Complaint Detection in social media.

 Proceedings of the 3rd Workshop on E-Commerce and NLP.

6. Jaidka, K., Zhou, A., & Lelkes, Y. (2019). Brevity is the soul of Twitter: The

 constraint affordance and political discussion. Journal of Communication.

7. Jain, P.K., & Pamula, R. (2020). Sentiment analysis in airline data: Customer

 rating -based recommendation prediction using Weka. Machine learning

 algorithms for industrial applications, Springer.

8. Kandasamy, I., Vasantha, W. B., Obbineni, J. M., & Smarandache, F. (2020).

 Sentiment analysis of tweets using refined neutrosophic sets. Computers in

 Industry, 115. https://doi.org/10.1016/j.compind.2019.103180

 32
9. Khan, R., & Urolagin, S. (2018). Airline sentiment visualization, consumer loyalty

 meas- ure and prediction using twitter data. International Journal of Advanced

 Computer Science and Applications, 9.

 https://doi.org/10.14569/IJACSA.2018.090652

10. Kumar, S., & Zymbler, M. (2019). A machine learning approach to analyze

 customer satisfaction from airline tweets. Journal of Big Data, 6.

 https://doi.org/10.1186/s40537-019-0224-1

11. Li, Q., Peng, H., Li, J., Xia, Congyin, Yang, R., Sun, L., & Philip, S. Yu, and

 Lifang he. (2020). A survey on text classification: From shallow to deep learning.

 ACM computer survey, article 35.

12. Meier, L. L., Gross, S., Spector, P. E., & Semmer, N. K. (2013). Relationship and

 task conflict at work: Interactive short-term effects on angry mood and somatic

 complaints. Journal of Occupational Health Psychology, 18(2), 144–156.

 https://doi.org/10.1037/a0032090

13. Naseem, U., Razzak, I., Musial, K., & Imran, M. (2020). Transformer based deep

 intelligent contextual embedding for twitter sentiment analysis. Future Generation

 Computer Systems, 113, 58–69. https://doi.org/10.1016/j.future.2020.06.050

14. OctoParse documentation. (2022).

 https://www.octoparse.com/file/octoparse_doc.pdf

15. Rezaeinia, S. M., Rahmani, R., Ghodsi, A., & Veisi, H. (2019). Sentiment

 analysis based on improved pre-trained word embeddings. Expert Systems with

 Applications, 117, 139–147. https://doi.org/10.1016/j.eswa.2018.08.044

 33
16. Rose, S. et al. (2010). Automatic keyword extraction from individual document.

 Text Mining: Applications and theory.

17. Ryan, R. M., Bernstein, J. H., & Brown, K. W. (2010). Weekends, work, and well-

 being: Psychological need satisfactions and day of the week effects on mood,

 vitality, and physical symptoms. Journal of Social and Clinical Psychology, 29(1),

 95–122. https://doi.org/10.1521/jscp.2010.29.1.95

18. Tiwari, P., Pandey, H. M., Khamparia, A., & Kumar, S. (2019). Twitter-based

 opinion mining for flight service utilizing machine learning. Informatica, 43(3).

 https://doi.org/10.31449/inf.v43i3.2615

19. Tsakalidis, A., Aletras, N., Cristea, A. I., & Liakata, M. (2018). Nowcasting the

 stance of social media users in a sudden vote: The case of the Greek

 Referendum. Proceedings of the 27th ACM International Conference on

 Information and Knowledge Management.

20. Utama, H. (2019). Sentiment analysis in airline tweets using mutual information

 for feature selection. 4th International Conference on Information Technology,

 Information Systems and Electrical Engineering.

21. Vashishtha, S., & Susan, S. (2019). Fuzzy rule based unsupervised sentiment

 analysis from social media posts. Expert Systems with Applications, 138.

 https://doi.org/10.1016/j.eswa.2019.112834

22. Wang, J., Wang, Z., Zhang, D., & Yan, J. (2017). Combining knowledge with

 deep convolutional neural networks for short text classification. Proceedings of

 the Twenty-Sixth International Joint Conference on Artificial Intelligence.

 34
23. Yadav, A., & Vishwakarma, D. K. (2020). Sentiment analysis using deep learning

 architectures: A review. Artificial Intelligence Review, 53(6), 4335–4385.

 https://doi.org/10.1007/s10462-019-09794-5

 35
You can also read