Rider Happiness Benchmarking Report - Spring 2021 - U.S. edition - Prepared by - Transit - Blog
←
→
Page content transcription
If your browser does not render page correctly, please read the page content below
Rider Happiness
Benchmarking Report
Spring 2021 — U.S. edition

 Prepared by

1 SPRING 2021
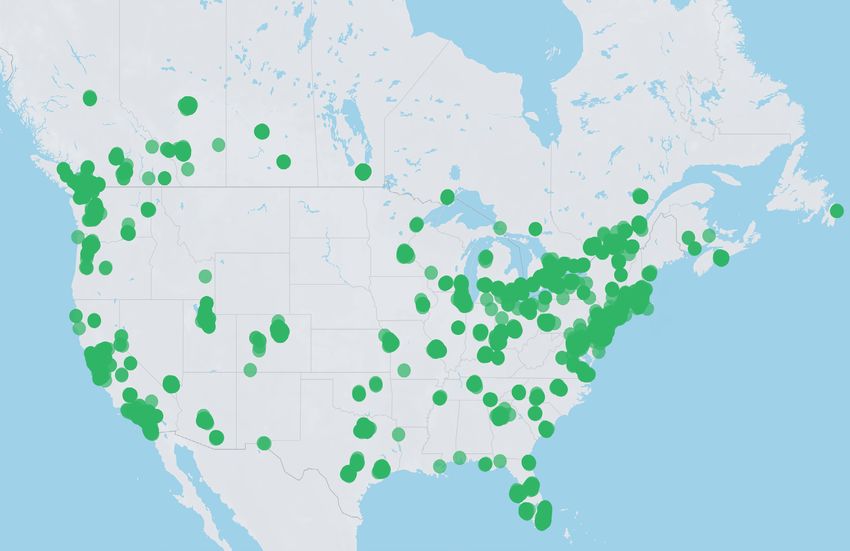
ABOUT THE RIDER HAPPINESS
BENCHMARKING PROGRAM

By distributing surveys in-app to our representative sample of riders 3 EXECUTIVE SUMMARY
spanning hundreds of agencies across North America, Transit’s Rider
Happiness Benchmarking (RHB) program offers an industry-leading set 6 SURVEY RESULTS: US
of metrics. Transit offers a subscription service for agencies to receive
 6 RIDING DURING THE PANDEMIC
detailed, local quarterly survey results on key customer satisfaction 8 MODE SHIFT
indicators. Participating agencies sit on the program’s steering committee 9 PERCEIVED RISK OF RIDING PUBLIC TRANSIT
to influence questions asked in each survey. The goal is to help public 12 NET PROMOTER SCORE
transit agencies both benchmark for inter-agency comparison and amass 15 AGENCY SATISFACTION RATINGS
longitudinal data to track their own performance over time. 30 COVID-19 RESPONSE

Agencies such as Pierce Transit (Tacoma, WA), GDRTA (Dayton, OH),
 32 RIDER DEMOGRAPHICS
STO (Gatineau, QC), and WMATA (Washington, DC) are already
 32 VACCINATION PROGRESS FOR TRANSIT RIDERS
subscribers. While only subscribers will have access to all local,
 33 CAR OWNERSHIP
agency-specific data, Transit continues to publish topline national results
 34 AGE
for the U.S. and Canada publicly. The next RHB survey is scheduled
 35 RACE
to be launched in the Transit app in late July 2021.
 36 INCOME
 36 ACCESSIBILITY
 37 GENDER
 38 OCCUPATION

 39 BACKGROUND
 39 GOALS
 39 METHODOLOGY
 41 ABOUT TRANSIT

1 SPRING 2021 RIDER HAPPINESS BENCHMARKING REPORT — U.S. EDITION 2
 Want to see how your agency compares?
 Reach out to partners@transitapp.com

 EXECUTIVE
 to subscribe to quarterly reports.

 SUMMARY
As shots get in arms and our cities slowly start This report examines survey results in detail, → Riders are not shy about what would get them → Riders are just as concerned about COVID-19
to reopen, many transit agencies across the U.S. including rider satisfaction ratings for local to ride more: on public transit as they were 6 months ago,
and Canada are getting ready for their COVID transit agencies, Net Promoter Scores, and but some agencies are doing better than
 – Almost 50% strongly agreed they would ride more
 others at making riders feel that they are being
recovery. A key part of that recovery is being in more. Larger themes that arose from the often if agencies stepped up cleaning of vehicles
 and distributed masks. protected from coronavirus onboard. 63% of
touch with how riders are feeling. survey results include:
 U.S. respondents reported that they are satisfied
 – 59% of users said they would ride transit more often
At Transit, we use our platform to get regular → Riders are incrementally returning to transit. with agency safety measures during the
 if agencies improved safety on board vehicles, and
 They’re still riding less than before the pandemic, 67% stated they would ride more if agencies improved pandemic. This has not changed significantly
updates from riders, helping agencies gauge
 but they’re also hopeful about riding more safety at transit stops. from November results, where 65% reported
rider sentiment about service, safety, and more.
 in three months. In November, 50% of riders – A whopping 80% of users stated that they would ride
 they were satisfied.
With this information, agencies can better
 indicated they were riding less frequently, while more often if trip information was more accurate. → Public transit still has a perception problem.
understand what riders need, their future in April, 32% of riders now say they are riding less This, too, varies significantly by agency, with some A surprising 23% of respondents, up from 16%
plans, and their perceptions of public transit. than before the pandemic. already receiving high marks on the quality of their
 in November, said that public transit is riskier
Our surveys represent the sentiment of people real-time information.
 than a set of listed indoor activities, such as
 → Respondents are beginning to plan for recovery.
who are actively riding the transit system in – Riders stated they would ride more often if their
 large indoor gatherings or grocery shopping.
 Only 11% of riders will not return to public transit
their cities, not those who plan to return to agencies made bus and train departures more
 until the pandemic ends, down from 24% in → Riders are getting vaccinated at high rates,
 frequent (86%), if they sped up service (77%), and if
public transit in the future. The results yield November. 10% of respondents said they will they created routes that were more convenient for beating trends from the general population.
some surprising insights and highlight return to their prior riding patterns by July. riders’ travel needs (75%). Across respondents in April, 61% reported having
potential low-cost opportunities for agencies. → Riders are generally more satisfied with their received at least one vaccination, and 39% were
 transit agencies than they were in November. fully vaccinated. There were no differences in
 Among selected agencies, the average Net vaccination rates between Spanish and English
 Promoter Score (NPS) in November was -12, speaking respondents.
 improving to -4 in this most recent survey. → April 2020’s extreme racial disparity seems to
 But NPS continues to vary significantly across have lessened incrementally over time, although
 the more than 100 agencies in our survey with people of colour are still disproportionately
 a sufficient sample size for consistent tracking. represented compared to both the population at
 large and pre-pandemic ridership.

3 SPRING 2021 RIDER HAPPINESS BENCHMARKING REPORT — U.S. EDITION 4
SURVEY RESULTS:
 U.S.

 RIDING DURING THE PANDEMIC
 The majority of the Rider Happiness Benchmark According to our APTA ridership dashboard,
 survey is about measures that can be used ridership nationally from November to April
 during this period of recovery, and into the was up only 8% from 36% of pre-pandemic
 new normal. It’s especially timely to consider demand to 44%, suggesting that, overall,
 some pandemic-specific questions, as agencies people are returning but not riding as much
 look to understand what’s ahead over the next as they were prior to the pandemic.
 3 to 6 months.
 82% of U.S. respondents took the survey in
 We’ve surveyed Transit’s users three times English and 14.5% took it in Spanish. Amongst
 since the beginning of the pandemic.1 Unlike Spanish speakers, 79% of respondents said
 in the two previous surveys, many more that they were riding transit as often as (or
 respondents are now reporting that they are more than) before the pandemic, 11 points
 riding the same or more than they were prior higher than the U.S. average.
 to the pandemic, with 68% of U.S. respondents

 30 k
 telling us they are back on transit as much as
 they were prior to the pandemic (up from 50%

 20 k + 9 k+ in November).

 RESPONSES IN
 FROM THE US FROM CANADA
 NORTH AMERICA
 1 These surveys predominantly represent people who are, at the time of the survey, either still riding or still interested in riding
 public transit, and not people who have given up on public transit altogether. This is because respondents take the survey by
 tapping on a push notification or in-app banner, meaning that people who stopped using the app to ride public transit between
 April and November are underrepresented.

5 SPRING 2021 RIDER HAPPINESS BENCHMARKING REPORT — U.S. EDITION 6
People who own cars are more likely to report of non-car owners now riding is high. Among MODE SHIFT
riding less, while people who do not own cars people who are using public transit, over 30%
are more likely to report riding with the same are riding less frequently than they were We asked users which modes they utilized more frequently
frequency as before the pandemic. This pattern according to our results. This speaks to than before the pandemic. Interestingly, in November 64%
did not significantly change between the two changing travel patterns as a result of the of respondents reported that they rely on public transit more
prior surveys (April and November 2020), pandemic and we suspect this number may go during the pandemic. In this survey 6 months later, that
but in the April 2021 responses, all riders are down as more people start to commute again. number is up to 73%. Walking increased slightly from November,
reporting more of a return their pre-COVID Also, the measure still lags for car owners, as did biking, carpooling, and ridehail.
levels of transit usage (70% of non-car owners suggesting that some car-owning riders may
now - up from 54% - and 53% of car owners, not be returning to transit for a while.
up from 38% in November). The percentage

 Less often
How often do you ride, compared to before the pandemic? Which modes do you rely on more than before the pandemic?
 Same or more

 80% Nov 2020
 49.6% 50.4%
 April 2021

 NOVEMBER 2020

 32.3% 67.6% 40%

 APRIL 2021

 0%

 TRANSIT WALKING DRIVING CARPOOL BIKE RIDEHAIL OTHER

Looking for stats about your riders?
Reach out to partners@transitapp.com
to learn about subscribing to regular rider
experience reports.

7 SPRING 2021 RIDER HAPPINESS BENCHMARKING REPORT — U.S. EDITION 8
PERCEIVED RISK OF RIDING
PUBLIC TRANSIT
Due to the fears at the outset of the pandemic There is no single, consistent source of → In November, 53% of respondents said they → Fortunately, U.S. respondents are beginning to
 COVID-19 contact tracing to estimate an were riding with the same frequency as they did plan for recovery as only 11% of them will not
that overstated the actual risks of riding
 empirical risk level for each of these activities. before the pandemic. This is now up to 69% return to public transit until the pandemic ends
transit, public opinion had been set to believe
 of respondents as of April. Again, this is an (down from 24% in November). This suggests
that transit was dangerous. We continue There is evidence, however, that very few
 important reflection of the sampling frame that riders from November have begun riding
to be curious how riders perceive the risk COVID-19 cases traced back to contact on
 for this survey: it consists of people who have more as the U.S. vaccinates more people.
of contracting COVID-19 on public transit, public transit ( Joselow, Maxine, “There Is Transit on their phone, with a bias towards Additionally, 10% of respondents said they will
so we included the question: “Check all that Little Evidence That Mass Transit Poses a Risk those who are actively using the app, so current return to public transit within the next three
apply. Where do you feel at greater risk of of Coronavirus Outbreaks”, Scientific American, riders are disproportionately represented. months (May through July 2021).
contracting COVID-19 compared to riding public 28 July 2020). → Only 4.7% of all respondents said they will never
transit?”. We use this question as a barometer return to public transit.
 The results from this question demonstrate
of how much of that perception has affected
 that public transit still has a perception
ridership, and to give agencies a sense of
 problem. A surprising 23% of respondents said
whether their efforts to counteract these
 that public transit is riskier than all of the given
false perceptions have been successful.
 activities, up from 16% in November — that’s a
Respondents could choose multiple options, substantial fraction of riders who increasingly
so percentages represent the portion of users feel safer at the gym than on public transit.
who think that the given activity is riskier And only half of respondents thought a large
than riding public transit. indoor gathering, such as a wedding, is riskier
 than riding public transit! When riders will resume using public transit

 I ALREADY RIDE AS OFTEN
Percentage of riders who consider transit less risky than... AS I DID BEFORE COVID-19

60% AFTER COVID-19 IS DECLARED
 NO LONGER A THREAT

40% MORE THAN 3 MONTHS
 FROM NOW
 Nov 2020
20%
 WITHIN THE NEXT 3 MONTHS April 2021

0%
 I’LL NEVER USE PUBLIC TRANSIT
 AS OFTEN AS I DID BEFORE
 LARGE GYM MARKET SMALL RETAIL OFFICE NONE
 GATHERING GATHERING STORE OF THESE 0% 20% 40% 60% 80%

9 SPRING 2021 RIDER HAPPINESS BENCHMARKING REPORT — U.S. EDITION 10
In April 2021, 55% of respondents said they already commute NET PROMOTER SCORE
to school or work by public transit at least once per week.
We asked what they expected to do in July 2021 in order to get As an overall indicator of how transit systems are doing, we use
a better understanding of the pandemic recovery process. the Net Promoter Score. This allows agencies to have one number
Overall, 64% of respondents expected to commute at least once with which to measure their progress against themselves
per week in July. As further evidence of the fact that app users and their peers over time. The Net Promoter Score is a scoring
and respondents are already overwhelmingly returning to using system common in marketing that uses a 10-point scale.
public transit, only 21% of respondents said they currently The calculation is the percentage of responses of 9 or 10 minus
worked or attended classes from home exclusively, and 24% the percent of responses of 6 or below. In the marketing world,
stated they expected to continue to be working from home full a common rule of thumb is :
time in July 2021. This change is driven by an anticipated → -100 to 0 Needs improvement
reduction in riders that expect to remain unemployed after
 → 0 to 30 Good
three months, and respondents who expect to return to school
or work at least 3 days per week. → 30 to 70 Great

 → 70-100 Excellent

Current and expected work or study commuting patterns Among this group of agencies, the average NPS in November
 was -12, improving to -4 in this most recent survey. As ridership
ON LEAVE / TAKE CARE slowly returns post-pandemic, Transit looks forward to
OF OUR HOME OR FAMILY determining the level of stability of this measure over time.

UNEMPLOYED Interestingly, these results are not geographically distributed :
 Current in April 2021
 it really does matter what individual agencies are doing.
COMMUTE 1 DAY Expected in July 2021
OR FEWER PER WEEK For example, VTA and Muni in the San Francisco Bay Area are
 neighbours and may share an overlapping set of riders, but
COMMUTE 2 DAYS
PER WEEK riders on VTA are much more likely to recommend their agency
 to a friend than riders on Muni.
COMMUTE 3 DAYS
PER WEEK
 For reference, Internet service providers like Comcast
COMMUTE 4 DAYS come in around -1 NPS, health insurance companies at 13,
PER WEEK
 and airlines come in at 44. Netflix receives 62.
COMMUTE 5 DAYS (Source: Net Promoter Benchmarks)
OR MORE PER WEEK
 Spanish speakers tend to be more likely to recommend their
RETIRED
 agency to a friend: their average response was an 8.2 out of 10,
WORK FROM HOME while English speakers rated their agencies at only a 6.8 of 10
EXCLUSIVELY on the same question.

OTHER

 0% 10% 20% 30% 40% 50%

11 SPRING 2021 RIDER HAPPINESS BENCHMARKING REPORT — U.S. EDITION 12
Looking at individual agencies can reveal some useful trends. How likely are riders to recommend their transit agency to a friend?
 For example OCTA in Orange County, CA, went from being
 barely “good” in November to solidly “great.”
 OCTA (ORANGE COUNTY, CA) 5 42

 → Almost half of respondents rated OCTA a 10 of 10 when asked if
 they would recommend OCTA to friends and family (48%) in April, UTA (SALT LAKE CITY) 25 29
 while in November only 31% of respondents rated OCTA this highly.
 WMATA (WASHINGTON, DC) 16 25
 → OCTA also saw improvements in how riders rated the agency’s
 service offerings in response to COVID-19 (3.9 in November
 KING COUNTY METRO 6 22
 vs. 4.2 in April), as well as improvements to rider perception that (SEATTLE)
 the agency is doing the best it can with available resources (3.76
 in November vs. 4.24 in April). METRO (LOS ANGELES) -4 14

 → The April survey received almost double the number of responses
 VTA (SAN JOSE) 9 19
 from OCTA riders as compared to November. While there may be
 some external factors related to the types of users filling out the
 STM (MONTREAL) 0 6
 survey, the demographic composition (age, gender, income, race,
 etc.) remained consistent from November to April.
 HSR (HAMILTON, ON) -22 -2
 On the other hand, Edmonton Transit System in Alberta is one
 of the few agencies that saw a drop in rider satisfaction over METRO (ST. LOUIS) -2-1

 the course of six months.
 RTC (LAS VEGAS) -15 -6
 → Edmonton released a major bus network redesign with new routes
 and major service changes at the beginning of April. During
 TRANSLINK (VANCOUVER) -7-5
 the survey, riders were still getting used to the new routes and
 expressing their displeasure with some of the changes.
 MBTA (BOSTON) -21 -9

 TTC (TORONTO) -31 -14

 SEPTA (PHILADELPHIA) -28-25

 MTA (NEW YORK) -28
 -26

 WPG (WINNIPEG) -42 -27
 What’s a good NPS score? November 2020

 ETS (EDMONTON) -44 -28
 -100 0 30 70 100

 MDTA (BALTIMORE) -49
 -48

 SEE YOUR AGENCY’S SCORE

 -50 -25 0 25 50

13 SPRING 2021 RIDER HAPPINESS BENCHMARKING REPORT — U.S. EDITION 14
AGENCY SATISFACTION Agency satisfaction
RATINGS Agency alerts

To dig deeper into these top line trends, and Baltimore’s MDOT MTA ranked highest on the
 Do riders agree?
help agencies identify focus areas, survey res- increased frequency measure with an average
pondents were asked to rate their local agency rating of 4.6, while even the lowest-ranking “I feel well informed by my agency about route disruptions and changes.”
on a five-point scale across five categories: agency, TriMet in Portland, OR, scored above
communications and reliability, safety, clean- 4.0, at 4.2. Baltimore also rated highest on the
liness, data and infrastruwcture quality, and request to improve real-time accuracy (4.6), and 5
schedules and routes. On both communications Portland the lowest (3.9). Respondents highly
and reliability measures, agencies have seen value frequency of service, which requires 4
declines across the board from November to investment at every level of government.
April. This could be attributed to some riders Real-time data accuracy improvements, on the 3
returning to different systems than they left other hand, can be achieved incrementally and
 AVG RATING:
in March 2020, as agencies have changed their requires much less expensive investments 2 3.34 (NEUTRAL)
service patterns or partially restored service. on the agency’s part. Many other factors were
The secret to increasing these numbers may lie considered important, but were less significant
 1
in new initiatives, or in better communicating than increasing frequency and increasing data
existing initiatives to returning riders. Across all accuracy.
 0% 20% 40%
of the measures for safety improvements, data
improvements, and network changes, the most
important factors that respondents said would
encourage them to ride more often were In April 2021, across North America, Transit differently based on the type of service they
making departures more frequent (avg rating users felt lower satisfaction with agency alerts utilize. For example, Manhattan bus riders
4.5, standard deviation of 0.1) and improving and updates than in November of 2020. made a significant drop in their ratings between
the accuracy of real-time information coming On average, scores reduced by a quarter of a November and April on this measure (3.82 to
from vehicles (avg rating 4.31, standard point from 3.64 to 3.34. Of the 50 agencies with 3.08), while bus riders in Queens were more
deviation of 0.17). the most survey responses, only four agencies consistent in their ratings (dropping slightly
 improved on this measure while the others from 3.34 to 3.33). DDOT in Detroit saw a
 declined. The agencies with improvements were significant drop in rider satisfaction, as riders
 Montgomery County, MD, RTD in Denver, CO, reported a somewhat positive 3.5 in November
 TARC in Louisville, KY, and VTA in San Jose, CA. but dropped to 2.6 in April.
 Of those, VTA was already towards the top of

 Spanish speakers tend to be more satisfied with
 the ratings.
 their agency’s communications and updates
 Generally, West Coast agencies had a less severe than English speakers. In April, Spanish
How’s your agency doing? drop in the ratings for this measure, while speakers rated agencies 3.64 (versus 3.3 for
 agencies on the East Coast experienced English speakers), but this is still much lower
Subscribers get detailed quarterly reports.
 more significant drops in the past six months. than the 4.0 that Spanish speakers rated
Reach out to partners@transitapp.com
 Interestingly, MTA riders in New York responded agencies in November.
to learn more.

15 SPRING 2021 RIDER HAPPINESS BENCHMARKING REPORT — U.S. EDITION 16
Rider satisfaction: agency alerts Agency satisfaction
Highest- and lowest-rated agencies from November 2020 Agency reliability

 3.9 4.2
DAYTON RTA (DAYTON)
 In April 2021 across North America, Transit who may be returning to public transit for the
 4.05 4.05
 users felt lower satisfaction overall with agency first time in the past year and finding the sys-
TRIMET (PORTLAND)
 performance on reliability as compared to tem degraded from their previous experiences.
 3.5 4.0
 November (3.1 in April vs. 3.4 in November). The biggest change came for Rhode Island’s
PSTA (ST. PETERSBURG)
 Only 8% of agencies improved on this measure RIPTA, which experienced a significant drop in
 3.12 4.03
RTA (ROCHESTER) in the past six months (Montgomery County, rider satisfaction, with agency reliability falling
 3.65 4.03
 MD, VTA in San Jose, CA, KCATA in Kansas City, from an average rating of 3.75 in November to
FAIRFAX CONNECTOR (DC) MO, and OCTA in Orange County, CA). KCATA 3.25 in April.
 and OCTA have been working over the past
 Spanish speakers rated agencies higher on
 3.4 3.66 year to make improvements to their real-time
MONTGOMERY COUNTY reliability than English speakers (3.5 vs. 3.05),
TRANSIT (DC) data with our partner Swiftly, so it is possible
 but this is down from November, when they
 2.9 3.3 that this is having an impact on this measure
SEPTA (PHILADELPHIA) rated agency reliability at 3.8 (vs. 3.3 for English
 for these agencies.
 2.7 3.2 Nov 2020 speakers).
PAAC (PITTSBURG) More generally, the overall reduction in
 April 2021
 2.7 3.0 satisfaction with agency reliability could be
MDOT MTA (BALTIMORE) attributed to a change in the users of the app,
 3.0 3.0
TARC (LOUISVILLE)

 Do riders agree?
SEE YOUR AGENCY’S SCORE
 “My agency is on time and reliable.”

 0 1 2 3 4 5

 AVERAGE RATING (OUT OF 5) 5

 4

 3

 2
 AVG RATING:
 3.15 (NEUTRAL)
 1

 0% 5% 10% 15% 20% 25%

17 SPRING 2021 RIDER HAPPINESS BENCHMARKING REPORT — U.S. EDITION 18
Rider satisfaction: agency reliability Agency satisfaction
Highest- and lowest-rated agencies from November 2020 Safety and cleanliness
 Transit asked for feedback on the performance Using this aggregated safety score, respondents
 3.9 4.2
 of the agency’s driver/operator, as well as how for RTA in Dayton OH, VIA Metropolitan Transit
DAYTON RTA (DAYTON)
 they felt about safety throughout their trip. in San Antonio, TX, and Miami-Dade Transit
 4.05 4.05
TRIMET (PORTLAND) Notably, people feel positively about operators, in Miami, FL, reported feeling the most comfor-
 3.5 4.0 but those feelings do not have an impact on table with every element of riding transit, from
PSTA (ST. PETERSBURG) how safe they feel. mask compliance to feeling safe on board and
 3.12 4.03 at transit stops. SEPTA in Philadelphia, MTA
RTA (ROCHESTER) Other measures of perception of safety are
 New York City Subway, and MDOT MTA in
 3.65 4.03 highly correlated. Agencies that performed well
 Baltimore scored lowest on this measure.
FAIRFAX CONNECTOR (DC) on safety on board also performed well on how
 Generally, the agencies that scored well on
 safe respondents felt while waiting for their bus
 safety do not have any below-ground transit
MONTGOMERY COUNTY
 3.4 3.66
 or train to arrive (correlation coefficient = 0.9).
 stops or stations and are in warmer/temperate
TRANSIT (DC) However, respondents almost universally rated
 2.9 3.3 climates where riders can feel more comfortable
SEPTA (PHILADELPHIA) their feeling of safety on the vehicle higher
 waiting for their vehicle and on-board vehicles.
 2.7 3.2
 than while waiting for the bus/train. There is
PAAC (PITTSBURGH) Nov 2020 also a strong correlation between how safe
 2.7 3.0 April 2021 respondents felt on board and mask compliance
MDOT MTA (BALTIMORE) on board (correlation coefficient = 0.87).
 3.0 3.0 Therefore, we created an aggregated “safety
TARC (LOUISVILLE)
 score” to bring together all three of these
 measures for an individual agency to simplify
SEE YOUR AGENCY’S SCORE
 the information and better compare agencies
 to each other.
 0 1 2 3 4 5

 AVERAGE RATING (OUT OF 5) Questions:
 → “My driver/operator was good at their job”
After the survey we ran in November, represents users who are actively riding the → “Everyone on board was wearing a mask”
we received feedback from agencies on the transit system in their cities, not those who
 → “I felt safe while riding”
Rider Happiness Benchmarking program plan to return to transit in the future.
steering committee that they could use more → “I felt safe while waiting for my bus/train”
 For those riders who said they had ridden
specific satisfaction metrics to better make
 transit in the prior two weeks, Transit asked a
decisions about adjusting service and making
 series of questions about their most recent trip
improvements for their customers. So in the
 specifically on a five-point scale. The responses
April survey, we introduced a new set of
 are divided into the following three categories:
questions asking about a respondent’s most
 safety and cleanliness, data quality, and planned
recent transit ride. Of all respondents, 93% said
 schedules and routes.
they had taken transit in the past two weeks.
This survey group

19 SPRING 2021 RIDER HAPPINESS BENCHMARKING REPORT — U.S. EDITION 20
Satisfaction ratings for U.S. agencies Rating Scale 1-5 Two-thirds of respondents agreed or strongly Mask compliance sees the greatest variation
Safety and cleanliness 1 2 3 4 5 agreed that they felt safe while riding transit, between agencies. Overall, riders had greater
 while slightly fewer respondents agreed that divergence in their responses when asked
 they felt safe while waiting for their bus whether everyone onboard was wearing
 (average rating for safety onboard was 3.88 a mask; 11% reported that not everyone
50% 50% while safety at stops averaged 3.77). on board was wearing one. Responses were
 The individual safety factor with the lowest polarized, with 48% of respondents providing
 average score from respondents was how a score of 5 of 5 on this measure.
40% 40%
 comfortable riders felt while waiting at their
 There was only one set of riders in the U.S.
 bus or train stop/station. Respondents from
 that reported an exactly neutral average rating
30% 30% smaller DC-area agencies (Fairfax County
 of 3.0 for this question: LA Metro rail riders in
 and Montgomery County) reported the highest
 Los Angeles. 40% of these respondents gave
 safety ratings while onboard and the highest
 the agency a 1 or 2 rating on this measure,
20% 20% overall safety score, while MTA New York City
 while only 23% rated the agency 5 out of 5.
 Subway and LA Metro Rail scored lowest on
 Surprisingly, LA Metro bus riders rated this
 overall how safe their riders felt. Interestingly,
10% 10% question a 3.56, so even within the same agency
 those riders felt safer waiting for trains on the
 different riders have different perspectives on
 platforms than they did while in the vehicles.
 overall safety. The overall average rating for
 The lower an agency scores on onboard safety,
 0% 0% the mask compliance question across the U.S.
 the higher the likelihood that their riders will
 DRIVER WAS GOOD AT THEIR JOB EVERYONE ON BOARD WORE MASKS was 3.93.
 also feel less comfortable waiting for the vehicle
 to arrive.

50% 50% Almost 70% of respondents across the U.S.
 agreed or strongly agreed that their vehicle
 driver was good at their job. Overall, respon-
40% 40%
 dents gave agencies a 4 out 5 rating (the highest
 average in this category). TriMet in Portland,
 OR, scored highest on this measure, while
30% 30%
 MDOT MTA in Baltimore scored lowest.

20% 20%

10% 10%

 0% 0%

 FELT SAFE WITH RIDING FELT SAFE WITH WAITING

21 SPRING 2021 RIDER HAPPINESS BENCHMARKING REPORT — U.S. EDITION 22
Safety and cleanliness measures Rider desire for improved safety at transit stops
to increase ridership
 Riders who want stop safety improvements the most and the least, April 2021
Respondents were asked to report how strongly In terms of safety, 59% of users said they would
they felt about safety and cleanliness measures, ride transit more often if agencies improved METRO (HOUSTON) 4.4

and the impact that would have on their desire safety on board vehicles, and 67% stated they METROLINK (LOS ANGELES) 4.3

to ride transit more frequently. would ride more if agencies improved safety
 MTA (NEW YORK) 4.25
 at transit stops. Respondents showed little
Questions:
 variation in the answers to the question about MIAMI-DADE TRANSIT (MIAMI) 4.2

I would ride more often if my agency… bus stop safety, with an average rating of 3.83 OCTA (ORANGE COUNTY, CA) 4.15
 and a low standard deviation. Universally,
→ Improved safety on board
 respondents suggest that an investment in RTS (ROCHESTER, NY) 3.7
→ Improved safety at transit stops improving the experience of waiting for public
 RIPTA (RHODE ISLAND) 3.65
→ Improved cleanliness on board transit will result in more ridership. This conti-
 nues to match research and recommendations PAAC (PITTSBURGH) 3.65
→ Distributed masks to everyone who needs one
 on a vehicle from industry experts including journalist
 RTD (DENVER) 3.6
 David Zipper, who stated ”sometimes a new bus
The survey shows that agencies can encourage
 shelter is a better investment than flashy new UTA (SALT LAKE CITY) 3.55

more ridership by improving the cleanliness
 technology,” and who referenced Alon Levy’s
of the vehicles and distributing masks to
 Little Things That Matter: Bus Shelter. SEE YOUR AGENCY’S SCORE
everyone who needs one on a vehicle. Almost
50% of respondents strongly agreed they would Agencies that performed the best on this 0 1 2 3 4 5

ride more if agencies cleaned the vehicles more measure were UTA in Salt Lake City, UT, Rhode
 AVERAGE RATING (OUT OF 5)
and distributed masks. Mask distribution was Island’s RIPTA, Port Authority in Pittsburgh, PA,
particularly important to MTA bus riders in and RTS in Rochester, NY. Agencies that should
New York and Miami-Dade Transit riders, consider making more investments in their
who rated mask distribution most highly when riders’ perception of safety at stops are MTA
asked what would get them to ride more often. New York City Transit, LA Metro, OCTA in
 Orange County, CA, and Miami-Dade Transit.
Vehicle cleanliness was a top concern in this
category for LA Metro rail and bus riders,
SEPTA bus riders, and MTA New York City
Transit riders. When agencies have a lower
rating on this question, it suggests that these
agencies are performing better on this measure
such as UTA in Salt Lake City, UT, PSTA in
St Petersburg, FL, RTD in Denver, CO, and
COTA in Columbus, OH. These agencies have
had success in communicating their cleaning
measures to riders, and it shows in their ratings
on this question.

23 SPRING 2021 RIDER HAPPINESS BENCHMARKING REPORT — U.S. EDITION 24
Agency satisfaction
Data and infrastructure quality
Questions: trip, 21% of respondents reported that they Additionally, physical infrastructure investments Whether or not people currently feel safe
→ “I was able to get to my destination in the amount were unable to get to their destination in the are important to Transit users: Almost 50% at bus stops, they overwhelmingly want better
 of time I expected” amount of time they expected, and more than of respondents reported that their stop/station ones, and indicate that bus stop improvements
 one in four respondents stated the arrival pre- did not provide a good place to wait for their will make them ride more. 69% of respondents
→ “The predictions in the app for when the vehicle
 was arriving were accurate” dictions in the app, which in most cities Transit vehicle to arrive, with the average rating of reported that they would ride more if
 receives from transit agencies, were inaccurate. U.S. agencies slightly better than neutral at 3.5. agencies improved the quality of the transit
→ “My stop/station provided a good place to wait”
 Rider responses to this measure are positively stop infrastructure (average rating 4.1). That’s
 The pandemic has significantly changed traffic
Transit is devoted to ensuring that riders have correlated with their feelings of safety at transit true with the agencies that rated highest for
 patterns. Many agency predictions and sche-
as much accurate information as possible about stops (R= 0.83). However, average infrastructure safety at stops, including VTA in San Jose, CA,
 dules haven’t been modified to match the new
their transit system. We work with transit quality ratings tended to be lower than those WMATA in Washington, DC, VIA Metropolitan
 normal, leaving passengers with lower-quality
agencies to provide feedback on data quality for safety. Transit in San Antonio, TX, and the lowest-
 information about how long it will take to get
from on-board vehicle location, arrival predic- rated on safety, including Detroit DOT, MDOT
 where they are going. Some buses are moving
tions, and capacity systems. The results of this MTA in Baltimore, and SEPTA in Philadelphia.
 along much faster than they were, while others
survey indicate that accurate information is
 are more delayed due to budget constraints and
highly valued by riders. On their most recent
 cancelled trips caused by operator shortages. Rider satisfaction: “My stop/station provided a good place to wait”
 Highest- and lowest-rated agencies, April 2021

 METRO (HOUSTON) 4.35

 Rating Scale 1-5
Satisfaction ratings for U.S. agencies MIAMI-DADE TRANSIT (MIAMI) 4.3

Data and infrastructure 1 2 3 4 5
 NICE (NASSAU COUNTY, NY) 4.3

 DDOT (DETROIT) 4.25
40%
 MTA (NEW YORK) 4.25

30%
 CTA (CHICAGO) 3.7

 PIERCE TRANSIT (TACOMA, WA) 3.65

20%
 TRIMET (PORTLAND, OR) 3.65

 MUNI (SAN FRANCISCO) 3.6

 10%
 UTA (SALT LAKE CITY) 3.55

 0% SEE YOUR AGENCY’S SCORE

 ABLE TO ARRIVE IN TIME ARRIVAL TIME PREDICTIONS STOP PROVIDED A GOOD
 0 1 2 3 4
 WERE ACCURATE PLACE TO WAIT

 AVERAGE RATING (OUT OF 5)

25 SPRING 2021 RIDER HAPPINESS BENCHMARKING REPORT — U.S. EDITION 26
Data accuracy and infrastructure Rider desire for improved accuracy of real-time info
measures to increase ridership Riders who want real-time info improvements the most and the least, April 2021

Respondents were then asked to report how use the system more (average rating 4.6), MDOT MTA (BALTIMORE) 4.6

strongly they felt about data accuracy and essentially tied with MTA New York City
 MTA (NEW YORK) 4.6
infrastructure measures and the impact that Transit (4.6), and Detroit DDOT (4.5).
would have on their desire to ride transit more Respondents for TriMet in Portland, OR, (3.9), MONTGOMERY COUNTY (DC) 4.55

frequently. Metro Transit in Minneapolis (4.0), and UTA
 DDOT (DETROIT) 4.5
 in Salt Lake City (3.9) stated that improved
Questions: LA METRO (LOS ANGELES)
 accuracy would be helpful in feeling more 4.45

→ I would ride more often if my agency… comfortable about using transit more, but
→ Improved the accuracy of real-time information they are more mixed as to whether they were RTD (DENVER) 4.05

 already receiving inaccurate predictions for DAYTON RTA (DAYTON) 4.0
→ Made it easier to buy and use tickets
 their systems.
→ Improved the quality of the transit stops I use METRO TRANSIT (MINNEAPOLIS) 3.99

 More than half of users reported that making
The biggest impact agencies can have in UTA (SALT LAKE CITY) 3.95
 it easier to buy and use transit tickets would
encouraging more ridership in the lead them to ride more (average rating 3.8). TRIMET (PORTLAND, OR) 3.9

data/infrastructure category is to improve Miami-Dade Transit riders expressed the most
the accuracy of real-time information (average interest in easier fare purchases, with a rating SEE YOUR AGENCY’S SCORE
rating across agencies was 4.34). A whopping of 4.2. For the 10 agencies in the top 50 that
80% of users stated that they would ride more already have ticketing available within Tran-
 0 1 2 3 4 5

often if the information was more accurate. sit directly, those users were less likely to say AVERAGE RATING (OUT OF 5)
The agencies with respondents who said it that additional fare purchase options would get
would make the biggest difference for them them to ride more, with a lower average rating
are also the agencies where riders reported of 3.7.
the most inaccurate information: MDOT MTA
in Baltimore’s users felt the most strongly that
improved accuracy would encourage them to

27 SPRING 2021 RIDER HAPPINESS BENCHMARKING REPORT — U.S. EDITION 28
Agency satisfaction COVID-19 RESPONSE
Schedules and route changes
 As the transit industry prepares for recovery 2. COVID-19 service
Planned schedules and route changes from the pandemic, understanding how riders
to increase ridership “During the COVID-19 pandemic, I can still get
 perceive measures taken by agencies will be
 where I need to go on public transit (even if I’m
 instrumental in learning from peers. These
As agencies are planning for the return of U.S. riders stated they would ride more often not riding).”
 measures, such as mask mandates, have
riders, they know that ridership patterns have if their agencies made bus and train departures remained relatively unchanged since winter, → Average rating: 4.0 (agree)
changed and they want to understand fully the more frequent (86%), if they sped up service with a few notable exceptions. Compared with
 70% of respondents reported they could continue
way riders will return by modifying services (77%), and if they created routes that were more November, riders report greater satisfaction to get where they needed to go using transit in April.
to best meet returning riders’ needs. Many convenient to rider’s travel needs (75%). None in how well agencies are doing given their This has not changed significantly from November
agencies are already undertaking or planning of these responses are surprising; with infinite budget constraints. results, when 68% reported they were satisfied.
for these changes, like SEPTA in Philadelphia, resources, all transit agencies would love
 Respondents rated this measure at 4.0 in April,
where Transit is helping our partner Nelson\ to have all buses and trains arrive every minute Survey respondents were asked to rate their
 rating TriMet in Portland, OR, highest at 4.3 and
Nygaard as part of the bus network redesign in every direction people desired them to go. local agency on a five-point scale, with the
 DDOT in Detroit lowest at 3.4. This measure does
process. In this survey, respondents were asked In the absence of an unlimited piggy bank, following prompts:
 not appear to be impacted by regional differences or
to report how strongly they felt about planned however, one way that agencies have responded agency size.
schedule and route changes, and the impact is to refocus their attention and resources on 1. Agency COVID-19 safety
that would have on their desire to ride transit core services. Agencies have been monitoring
more frequently. “I am satisfied with my local agency’s safety 3. Use of resources
 crowded routes and supplementing them with
 more vehicles where possible, evaluating measures during COVID-19.” “My agency has done the best they can with the
Questions:
 microtransit as a replacement for underutilized → Average rating: 3.8 (agree) budget and resources available.”
I would ride more often if my agency... fixed-route service, and working to ensure that
 63% of U.S. respondents reported that they are → Average rating: 3.8 (agree)
 they can “build back better” when making plans
→ Made bus and train departures more frequent satisfied with agency safety measures during
 for the next few years of bus and train service. 63% of U.S. respondents reported that they are
 the pandemic. This has not changed significantly
→ Sped up service, allowing me to get to satisfied with agency budgeting and resource
 my destination faster from November, where 65% reported they were
 efficiency during the pandemic. This measure has
 satisfied. Generally, smaller agencies have perfor-
→ Created routes that were more convenient improved from November, when only 56% of users
 med better on this measure both in November and
 for my travel needs were satisfied with how agencies were using their
 in April. Dayton, OH rated 4.3 on this measure,
 resources. Given the influx of additional funds
 while MTA New York City Transit (3.3) and SEPTA
 from the federal government, this measure speaks
 (3.2) scored lowest. This measure also had a large
 to a broader level of support for transit and transit
 variance, so differences between agencies, even
 agencies.
 within the same metropolitan areas, can be stark.
 For example, Big Blue Bus in Santa Monica, CA
 rated 3.89 while LA Metro rail riders rated this
 measure at 3.39.

29 SPRING 2021 RIDER HAPPINESS BENCHMARKING REPORT — U.S. EDITION 30
Rider satisfaction with local transit agency
response to COVID-19
 Rating Scale 1-5
 1 2 3 4 5
 Curious about your
 ridership demographics?
 Reach out to partners@transitapp.com
 to learn about subscribing to regular rider
 experience reports.
50% 50%

40% 40%

30% 30%

 RIDER
 DEMOGRAPHICS
20% 20%

10% 10%

 0% 0%

 SAFETY DURING COVID-19 I CAN STILL GET WHERE I NEED TO GO
 VACCINATION PROGRESS
 FOR TRANSIT RIDERS
50% Does the extent to which transit riders are we see in overall vaccination rates also appear
 vaccinated throughout the U.S. influence for Transit users: in Los Angeles, 67% of
 overall satisfaction with transit service? respondents reported at least one vaccination,
40%
 Does a rising tide lift the outlook on all boats while in San Antonio only 53% had received at
 (or buses)? least one shot. But, these variations do not have
 a measurable impact on how well riders report
30% Not quite, but the rates of vaccination provide
 their agencies are performing on COVID-19
 some hope. Across respondents, 61% reported
 measures, like safety, service, or resource
 having received at least one vaccination, and
20% usage. LA Metro, for example, had middle of the
 39% were fully vaccinated, surpassing general
 pack ratings for all three satisfaction questions,
 population vaccination rates at the time of the
 while VIA Metropolitan Transit in San Antonio,
 survey. There were no differences in vaccination
10% TX, rated in the top five agencies on all three
 rates between Spanish and English speaking
 measures.
 respondents. The same regional trends that
 0%

 USE OF BUDGET / RESOURCES

31 SPRING 2021 RIDER HAPPINESS BENCHMARKING REPORT — U.S. EDITION 32
CAR OWNERSHIP AGE
→ Right after the lockdowns in 2020, only the most → It’s important to filter this result through → The percentage of college-age riders continues → Overall, the 18-34 age bracket is less present in
 essential workers were riding public transit. the survey methodology: all survey respondents to decrease with each survey, following the the April 2021 sample than either the November
 The percentage of car owners riding transit in have Transit installed on their phones and the closing and only partial reopening of campuses or the April 2020 sample, suggesting that other
 November was more than twice the percentage majority learned of the survey from an in-app in the U.S. age groups are returning to transit more quickly,
 at the beginning of the pandemic, and now a year banner, meaning they had to open the app first. therefore reducing the percentage of the respon-
 after that first survey the pendulum has settled One might expect the car ownership rate to dents who are young adults.
 back towards what appears to be an equilibrium be lower in the November 2020 and April 2021
 on car ownership: in April of this year, 74% of samples, assuming that car owners would not
 users did not own a vehicle or have access to one. open Transit at all, but this is not the case.
 Age
 April 2020 vs. November 2020 vs. April 2021
 April 2020
Car ownership 25% November 2020
April 2020 vs. November 2020 vs. April 2021
 April 2021
 20%

 8.6% 15%

 5.8% 19.1%
 10%

 5%
 APRIL 10% NOVEMBER
 2020 2020 0%
 < 18 18-24 25-34 35-44 45-54 55-64 65+

 85.6% 70.9%

 Age by riding frequency Not riding
 April 2021
 Riding less

 80% Riding same
 amount

 17.2% Do not own a car
 60%
 Do not own a car,
 but have access to one
 8.9% 40%
 APRIL Own a car
 2021
 20%
 73.9%

 0%
 < 18 18-24 25-34 35-44 45-54 55-64 65+

33 SPRING 2021 RIDER HAPPINESS BENCHMARKING REPORT — U.S. EDITION 34
RACE AND ETHNICITY INCOME
→ April 2020’s extreme racial disparity seems to → Black and Hispanic respondents report that they Income
 have lessened incrementally over time, although are now riding the same (or more) as they were April 2020 vs. November 2020 vs April 2021
 people of colour are still disproportionately pre-pandemic (over 70% in April 2021, up 10-20%
 represented compared to both the population from November 2020). White respondents stayed
 at large and pre-pandemic ridership. around the same from November, with around
 60% of respondents saying they ride the same APRIL 2020
 or more as before the pandemic.

 NOVEMBER 2020

Race
April 2020 vs. November 2020 vs. April 2021
 APRIL 2021
 April 2020
50%
 November 2020

40% April 2021 0% 25% 50% 75% 100%

 * “Middle Eastern” was not
30% an option in April 2020
 Under $10,000 $30,000 to $39,999 $75,000 to $99,999

 $10,000 to $19,999 $40,000 to $49,999 $100,000 to $149,999
20%
 $20,000 to $29,999 $50,000 to $74,999 $150,000 or more

10%

 0%
 WHITE BLACK HISPANIC ASIAN NATIVE MIDDLE PACIFIC OTHER PREFER
 AMERICAN EASTERN* ISLANDER NOT TO SAY

 Do you have difficulty with...
 ACCESSIBILITY April 2021
Race by riding frequency Not riding
April 2021 Riding less Our surveys ask respondents if they have
 Riding same any difficulty, even with aids, doing specific SEEING
 amount
80% actions: seeing, hearing, using fine motor
 skills, and walking. Nearly 39% of respondents WALKING

60%
 said they have difficulty in at least one of these
 categories, with 93% of all respondents MOTOR SKILLS

 answering this question. This has remained
40%
 consistent between the November survey HEARING

 and this one, meaning that those with
 AT LEAST
20% accessibility needs continue to be major ONE OF THESE
 stakeholders in agency policies beyond
 0% 10% 20% 30% 40%
 0% the general transit-riding population.
 WHITE BLACK HISPANIC

35 SPRING 2021 RIDER HAPPINESS BENCHMARKING REPORT — U.S. EDITION 36
GENDER OCCUPATION
→ In April 2021, the gender balance returned to → Among Spanish speakers, gender disparity is still Top five occupations, April 2021
 an even split between female and male riders stark in this survey (female:male = 1.38) but it was APR 2020 NOV 2020 APR 2021
 (female:male = 1.00). There was a slightly much more disparate in the November survey
 smaller gender imbalance in November 2020 (female:male = 1.58) so the pattern of trending Food preparation and serving 17.0% 8.4% 9.4%
 (female:male = 1.22) than at the beginning of towards parity is apparent in the Spanish
 the pandemic (female:male = 1.37). The return speaking population as well.
 to pre-pandemic gender balance is complete,
 Retail (including grocery and pharmacy sales jobs) 9.0% 9.7% 8.1%
 a year after the pandemic began.
 Building and grounds cleaning
 6.3% 4.2% 6.2%
 and maintenance occupations

 Healthcare support 10.2% 5.6% 5.5%
Gender
April 2020 vs. November 2020 vs April 2021
 Healthcare practitioners and technical occupations 6.4% 5.6% 5.5%
 2.75 % 1.18 % 4.4 % 2.25 %

 In April 2020, the top five occupations were While essential workers are still the most
 food preparation and serving, healthcare represented groups among survey respondents,
 support, sales and related occupations, the proportion of healthcare workers has
 APRIL NOVEMBER healthcare practitioners, and building and decreased incrementally, and the proportions of
 40.5 % 2020 41.95 % 2020
 55.5 % 51.4 % grounds cleaning and maintenance. non-essential workers (people with occupations
 In November 2020, the top five occupations in computers and mathematics, law, or similar
 were retail, food preparation, healthcare fields) have increased over the course of a year.
 support, healthcare practitioners and This reflects an overall trend: all types of
 education roles. In April 2021, building and riders are returning to transit, and a new era
 grounds workers are returning to the top list. of post-pandemic transit usage is beginning to
 take shape.
 4.7 % 2.35 %

 Female
 Male
 Prefer not to say
 APRIL Non-binary or
 46.3 % 2021 46.7 %
 non-conforming

37 SPRING 2021 RIDER HAPPINESS BENCHMARKING REPORT — U.S. EDITION 38
BACKGROUND

GOALS METHODOLOGY
The survey summarized in this report ran DISSEMINATION DUPLICATION EXCLUSION
during a two-week period in April and May
2021, with the goal of providing a snapshot The survey consists of 31 ridership questions, The survey software prevents users from Responses were included when the user
of agency satisfaction and ridership needs 12 demographic questions, and one responding to the same survey twice, but this responded to all of the survey questions,
during the recovery period from the COVID-19 meta-survey question, asking whether the would not prevent individuals from responding including the meta-survey question (whether
pandemic. Transit app ran similar surveys in respondent is willing to answer the optional from two devices. This kind of occurrence is the user is willing to answer demographic
April 2020 and November 2020, allowing for a demographic questions. The survey launched quite rare in Transit surveys, but Transit does questions). Approximately 96% of responses
comparison of relevant topics between surveys. on April 23, 2021, remained open for two weeks, scan for duplicate responses by user ID, IP met this criterion.
Topics asked about in the survey include agen- and was disseminated to Transit users in North address, demographic information, and survey
 Responses were not excluded based on answers
cy satisfaction measures, perception of safety America in English, Spanish and French entirely responses.
 to demographic questions, since these were
on public transit, and plans to return to public digitally via:
 Repeat responses on surveys do occur, but typi- optional. Consequently, demographic data are
transit use. → In-app banners on the home screen cally at a low rate. In this survey, there not available for every respondent. Over 95%
 of the Transit app
Questions in the survey, developed by Transit were no suspected repeat responses. of respondents, after exclusion, answered the
with input from a steering committee of tran- → Push notifications to Transit app users (which demographic questions.
sit agency representatives, fell into four main they see as a notification on their mobile device)

groups: agency ratings, current riding habits
and needs, future riding habits and needs, and
demographics, including work-from-home plans
and industry of employment.

39 SPRING 2021 RIDER HAPPINESS BENCHMARKING REPORT — U.S. EDITION 40
ABOUT TRANSIT
Launched in 2012 in Montreal, Transit is Transit’s goal has always been to enable users
North America’s most popular public transit to get from A to B without their own car, and
app, with millions of active users in more than our ease-of-use plays an important role in
200 cities. Transit is the highest ranked public improving the public transit rider experience.
transit-focused app in the App Store in North Because of our ubiquity with public transit
America. The app has received Apple’s coveted riders within markets across North America,
Editor’s Choice tag in the App Store, and has an Transit is able to reach a sometimes-difficult
App Store rating of 4.7 stars. segment of the population to access, and based

Right on launch, Transit shows users all nearby on the surveys we have run thus far, our

transport options and departure times in big responses are generally reflective of the age,

text and bright colours. Users can easily race, income, and other demographics of

navigate public transit with accurate real-time public transit riders overall. Transit’s surveys

predictions, simple multimodal trip planning, provide quick temperature readings within

and step-by-step navigation. With public a region, benchmarked comparisons across

transportation at its core, Transit also regions, and in-depth analysis linked to user

integrates real-time information and payment behaviours in the app itself.

functionalities for other sustainable mobility
modes, including ridehail, bikeshare, scooters
and carshare.

Get a custom report for your agency
Join our steering committee and can subscribe
to quarterly rider experience reports by reaching
out to partners@transitapp.com.

41 SPRING 2021 RIDER HAPPINESS BENCHMARKING REPORT — U.S. EDITION 42
You can also read