Revisiting Property Taxes in Nevada: A Comparative Analysis - Guinn ...
←
→
Page content transcription
If your browser does not render page correctly, please read the page content below
Revisiting Property Taxes in Nevada: A Comparative Analysis
I.   Introduction
In Nevada, property taxes supply budgetary support for local governments, such as school districts.
Amongst all jurisdictions in Nevada, schools receive the largest share of property tax dollars.
Historically, Nevada’s plan for funding K-12 education was called the Nevada Plan. Under the Nevada
Plan, two-thirds of property tax collections remained in the county that levied those taxes, and one-
third of those revenues was returned to the county through the state’s Distributive School Account.
During the 80th (2019) Legislative Session, the enactment of Senate Bill (SB) 543 replaced the 53-
year old Nevada Plan with the Pupil-Centered Funding Plan.

As part of SB 543, the Legislature created the Commission on School Funding, which has been tasked
with monitoring the implementation of the new Pupil-Centered Funding Plan and providing
recommendations to the governor and the Legislature. As part of its mandate, the Commission shall
“recommend any revisions [determined] to be appropriate to create an optimal level of funding for
the public schools in this State.”1 However, if the optimal level of funding is greater than the funding
available, the Commission must “identify a method to fully fund the recommendation.”2 During the
August 2020 meeting of the Commission on School Funding, several members raised the possibility
of examining property taxes to increase education revenues.3

As legislators and members of the Commission consider and evaluate proposals that seek to raise
revenues for schools (e.g., property tax), legal and constitutional parameters may ultimately
constrain their policy choices. These include, amongst others, caps on the property tax rate, the
manner in which the school tax operating rate functions as part of the Pupil-Centered Funding Plan,
and potential inequities that could arise out of adjustments to the system.

This policy brief is intended for legislators, members of the Commission on School Funding, and
other relevant stakeholders, should the question of changes to revenue limitations that feature in
Nevada’s property tax system be taken under advisement.

It begins with a brief overview of the relationship between property taxes and K-12 Education
Funding (see Section II). Section III examines structural characteristics of Nevada’s property tax
system that limit revenues. Section IV examines whether property taxes are a comparatively limited
revenue source for Nevada, with a particular emphasis on states that, like Nevada, do not collect
individual income taxes: Alaska, Florida, South Dakota, Texas, Washington, and Wyoming. Section V
analyzes the composition of revenue sources in the focus states’ General Funds to determine whether
property taxes help strengthen their budgets and the extent to which these states exhibit a reliance
on particular revenue sources. Section VI discusses recent efforts to effect legislative change in
Nevada, summarizes recent property tax legislation and proposals in other states, and compiles the
statutory and constitutional authorities pertaining to Nevada’s property tax revenue limits in an
accessible table.

                                               ●●●
                                                                                                      1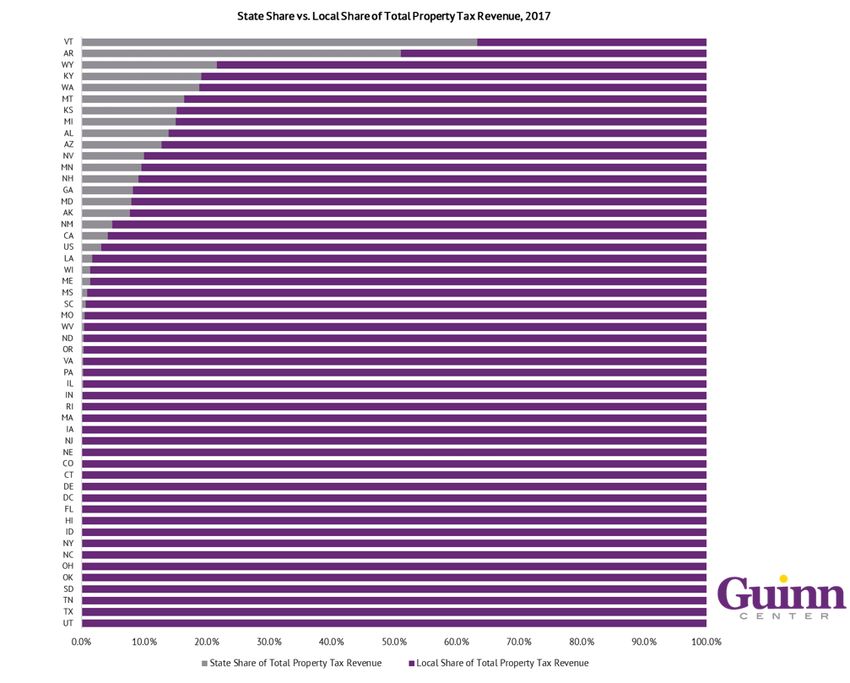
II. What Is the Relationship Between Property Taxes and K-12 Education Funding?4

Property tax revenues provide budgetary support for local governments, such as school districts, in
the Silver State. While local jurisdictions have some discretion in setting property tax rates, provided
that they conform to certain statutory and constitutional requirements, there are legal constraints
on rate setting for school districts. Nevada law requires that 75 cents per $100 of assessed valuation
of the combined property tax rate must be levied for school operating costs. This rate cannot vary
by school district.

For FY 2018, school districts’ total resources—amounts realized from both the school operating tax
and the school debt service tax—equaled $6.9 billion when aggregated statewide. Property taxes
contributed about $1.1 billion (16.4 percent) to total resources. However, while schools are not overly
reliant on property tax revenue, most property tax collections are apportioned to school districts.
Schools were the largest beneficiary of property tax dollars in FY 2018; 40 percent all property tax
money collected statewide in FY 2018 was distributed to school districts.

Nevada is one of the least dependent states on property taxes as a source of local school revenue,
though it is one of the most dependent of all states for local revenues to finance elementary and
secondary school education.5 This may be attributed, in part, to the design of the Nevada Plan – the
Silver State’s current but soon-to-be-replaced K-12 funding mechanism – and also to a series of
legislative changes in the early 1980s that combined to reduce local governments’ reliance on
property tax in favor of the more variable sales tax.

The Pupil-Centered Funding Plan and Senate Bill 543

Under the Nevada Plan, two-thirds of property tax collections remained in the county that levied
those taxes and one-third of those revenues was returned through the state’s Distributive School
Account payments. During the 80th (2019) Legislative Session, the enactment of Senate Bill (SB) 543
replaced the 53-year old Nevada Plan with the Pupil-Centered Funding Plan. Under Senate Bill (SB)
543, the Pupil-Centered Funding Plan requires that property taxes collected for school district use
must be remitted to the State Treasurer and credited to the State Education Fund.6 The new
requirement that all county-levied property taxes earmarked for local school districts are now to be
remitted to the State Treasurer removes the (two-thirds versus one-third) distribution that existed
previously under the Nevada Plan.7

SB 543 created the Commission on School Funding to monitor the implementation of the new
funding plan and provide recommendations to the governor and the legislature. As part of its
responsibility, the Commission shall “recommend any revisions [determined] to be appropriate to
create an optimal level of funding for the public schools in this State.” However, if the optimal level
of funding is greater than the funding available, the Commission must “identify a method to fully
fund the recommendation.”8 Recently, property taxes have been identified as one possible source of
revenue. However, a number of legal and constitutional parameters may constrain policy choices.
The following section examines the structural characteristics of Nevada’s property tax system that
limit revenues.

                                                                                                      2
III. What Are the Major Property Tax Limitations in Nevada?
Nevada’s property tax system is enshrined in the State’s Constitution. Article 10 § 1 of the Nevada
Constitution enumerates that “[t]he Legislature shall provide by law for a uniform and equal rate of
assessment and taxation…[.]”9 While legislators are granted the authority to effect certain statutory
changes to property tax law pursuant to Article 10 § 1, the “uniform and equal rate” precept limits
the scope of policy options. This section will highlight these where relevant.
The term most often used to characterize Nevada’s property tax system is “complex.” Before we
examine the limitations of the system, we provide a brief overview of the property tax calculation.
What we do in Nevada is take the land at full cash value. We then consider improvements—any
structure or any buildings that have been placed on that land at the replacement cost, less 1.5
percent per year for up to 50 years….There is a rate applied to whatever that total is—35 percent—
and that is how we get to the assessed value. Beyond that, we apply a tax rate, the difference
between the assessment rate, which is 35 percent of the value, and the tax rate—which is how many
dollars per $100 of assessed value.10
The State’s reference manual on property taxation, Nevada Property Tax: Elements and Application,
expresses the above in the following formula.11 (Note that taxable value is the cash value of land,
plus the replacement cost of improvements [net of the depreciation factor].)
Taxable Value x Level of Assessment = Assessed Value
Assessed Value x Tax Rate = Total Property Tax
We will unpack the various elements further in our discussion of limitations, below, which primarily
will be guided by those identified in Nevada Property Tax: Elements and Application.
Assessment Limits
Taxable Value
Nevada uses a system that is called the cost approach to arrive at taxable value.12 Under the cost
approach, taxable value is not premised on the property’s full cash value (i.e., market value). Instead,
the property’s value is split into two parts: the cash value of land and the replacement cost of
improvements (typically, buildings). Depreciation is established in statute, as “Nevada law directs
assessors to subtract depreciation at a set rate of 1.5 [percent] of the cost of replacement for each
year of adjusted actual age of the improvement, up to a maximum of 50 years.”13 The depreciation
factor is applied to improvements only, not to the cash value of land. Taxable value thus is composed
of three parts: (1) the cash value of land; (2) the replacement cost of improvements; and (3) the
depreciation factor.
The cost approach, which relies on the depreciation factor, results in a substantial annual reduction
as the improvement continues to age. In fact, depreciation cumulates over the life of the
improvement. While the depreciation percentage is zero in Year One, it is 1.5 percent in Year Two,
3.0 percent in Year Three, 4.5 percent in Year Four, and so forth, up until the maximum of fifty years
is reached, for a depreciation percentage that settles at 75.0 percent. The cost approach implies that,
3even if property values rise, the yearly compounded reductions can help offset some of the market-
driven increases.
Application of the depreciation factor also means that taxable valuable less closely approximates
market value over the life of the improvements. Moreover, it erodes the effective tax rate, which is
the tax liability as a share of taxable value before depreciation. Assuming an annual growth rate of
2.5 percent, by the time maximum depreciation is reached – after 50 years, or in Year 51 – the
effective tax rate is 0.51 percent of assessed value.14
The tension between depreciation of improvements and appreciation, through property value
increases and/or inflation, creates a structural deficit in Nevada. The costs of providing services to
residents increase with inflation, but the depreciation factor partially offsets market forces, and, as
such, property tax collections do not increase in kind. For example, $1 in 1979 is the equivalent of
$3.69 in 2019, due to inflation. However, the impact of the depreciation suggests that $3.69 is
actually worth $1.48 in 2019.15 This means that, “[c]osts and assessed value are going up, but
depreciation is bringing the tax receipts that local governments and schools are receiving down, and
inevitably, there will be a gap.”16 This is the structural deficit.
While the total annual amount of revenue forgone to depreciation in Nevada is unknown, a recent
study showed that, were depreciation to reset upon sale or transfer of real property, an additional
$240.9 million in property tax revenue would have been collected statewide in FY 2019.17
The depreciation factor is statutorily determined, which implies that it is within the Legislature’s
purview to increase or decrease it.18 But more “conceptual” changes tend to necessitate clearing the
hurdle of the uniform and equal clause of the Nevada Constitution.19 Thus, while there is no explicit
reference to the depreciation factor in the Nevada Constitution, certain adjustments raise
constitutional questions because of the Article 10 § 1 precept.
Nevada is the only state to use the cost approach, that is, applying the depreciation factor to obtain
taxable value. The last state that applied the depreciation factor as part of the replacement cost
approach was Indiana. However, in 1998, the Indiana State Supreme Court ruled the practice
unconstitutional, which permitted that state to move to a market value appraisal approach that it
began to use in 2002.20
Level of Assessment
To obtain assessed value, or the amount at which a property is taxed, taxable value is multiplied by
the level of assessment. The level of assessment, or the rate of assessment, “is generally expressed
as the overall ratio of assessed value to market value.”21 Nevada Revised Statutes (NRS) 361.225
fixes the level of assessment at thirty-five percent of its taxable value.22 As with depreciation, the
rate of assessment lowers the amount upon which the property tax rate is applied.
The level of assessment is not defined as a property tax limitation in Nevada Property Tax: Elements
and Application. But the assessment rate is the vehicle through which the reduction from taxable
value to assessed value is made possible. As such, it acts as a limit on property tax bills, decreasing
property tax revenue in kind. It is difficult to gauge whether Nevada’s rate of assessment is
4comparatively low. However, the lower the level of assessment, the greater the reduction. With a
fixed assessment rate of 35 percent in Nevada, assessed value is 65 percent lower than taxable
value. A property with a taxable value of $300,000 would be taxed at $105,000.
As the assessment rate increases, the more closely assessed value approximates taxable value. A
level of assessment that is set at 100 percent means that assessed value and taxable valuable are
equivalent. In Nevada, the depreciation factor reduces market value to taxable value, and the level
of assessment reduces taxable value to assessed value. Thus, the reductions compound on one
another, lowering individual property tax bills. Reductions across many individual properties,
collectively, can result in depressed property tax revenue for governments in Nevada.
Comparison of the assessment rate across states presents a challenge because property systems are
structured differently. Some states cap increases on properties’ assessed value, which can lead to
variation in assessment ratios.23 In general, assessment ratios can range from zero to 100 percent;
with an assessment rate of 100 percent, taxes are based on actual market value, as discussed above,
provided that there are no factors that reduce market value to taxable value.24
Moreover, a number of states permit property tax classification, allowing “states to tax different
types of property in a non-uniform manner.”25 Broadly speaking, the level of assessment can vary in
accordance with property type, which may be categorized as residential, commercial, industrial, and
agricultural, amongst others.26 If property is classified by type, it “allows policymakers to assign
different assessment ratios to different classes of property.”27 Nevada is one of 15 states that does
not permit statewide classification, though an additional six states only permit classification for
certain geographies within their states or specific property tax levy types; Delaware does not allow
statewide classification, but its three counties establish their own assessment ratios.28
Nevada’s disallowing of statewide property tax classification means that the assessment rate is fixed
for all property types. Although the State treats certain property types different for the purposes of
valuation methodology, such as agricultural property and open-space land, that does not appear to
hold true for the rate of assessment.29 NRS 361.225 specifies that, “All property subject to taxation
must be assessed at 35 percent of its taxable value” (emphasis added).30 It is possible that statewide
property tax classification would contravene the uniform and equal clause of the Nevada
Constitution.31 The statutory language suggests that legislators have the authority to change the
level of assessment, should they so choose, but it appears that statewide property tax classification
would require a constitutional amendment.
Tax Limitation by Abatements
Nevada law allows for partial abatement of property taxes, such that property tax bills for owner-
occupied single family residences cannot increase by more than three percent over the previous
fiscal year (Residential Tax Cap); tax bills on all other property types cannot increase by more than
eight percent over the previous fiscal year (General Tax Cap).32 The respective ceilings – three
percent and eight percent – are called primary caps, which limit property tax revenue by placing a
ceiling on tax liability. For example, if the year-over-year percent change in total property tax for an
5owner-occupied single-family residence exceeds three percent, the bill is reduced so that the amount
of increase equals three percent.
Consider again a property with a taxable value of $300,000 and for which the assessed value,
accordingly, is $105,000. It is a residential property that is located in Tax District 200 (Las Vegas
City, Clark County), which has a property tax rate of $3.2782 per $100 of assessed valuation.33 Its
property tax liability in a given year is about $3,442. In the next year, the property tax rate remains
unchanged, but its taxable value increases to $350,000, for an assessed value of $122,500. Total
property tax would amount to approximately $4,016. The year-over-year increase is 16.7 percent.
But the property tax liability cannot increase by more than three percent, so the bill is reduced to
roughly $3,545. The dollar difference of $471 is the abated amount.
The current system also imposes what are known as secondary caps. Existing law sets a General Tax
Cap for all properties other than owner-occupied single-family residences, but the General Tax Cap
can have implications for the Residential Tax Cap because of the secondary caps. Specifically:
• “The General Tax Cap is calculated by taking the greater of the moving average growth rate
or twice the CPI, up to a maximum of 8 [percent].”34 If the greater of the moving average
growth rate or twice the CPI is less than eight percent, that percentage is established as the
General Tax Cap.35 (CPI is the Consumer Price Index.)
• “The Residential Tax Cap is 3 [percent] unless the General Tax Cap is less than 3 [percent].
If the General Tax Cap is less than 3 [percent], then the Residential Tax Cap must equal the
General Tax Cap.”36
For example, in FY 2018, twice CPI (2 × 1.3 percent = 2.6 percent) exceeded moving average growth
rate (-2.8 percent) in Clark County.37 The General Tax Cap for Clark County was set at 2.6 percent, as
2.6 percent is less than eight percent, and the Residential Tax Cap also was set at 2.6 percent,
because if the General Tax Cap is less than three percent, the Residential Tax Cap must equal the
General Tax Cap.
What this means in practice is that the limit of increase can fall below the primary caps of three
percent and eight percent, resulting in a flatter or reduced tax bill for those who pay property taxes
but less-than-expected revenue for local governments. In FY 2019, the Residential Tax Cap was set
at three percent for all counties, though the General Tax Cap ranged from a low of four-point-two
(4.2) percent in 10 counties to the maximum of eight percent in just one county (Lander County). 38
Roughly $839.3 million in property tax revenue was forgone to partial abatements in FY 2019.39
Constitutional and Statutory Tax Rate Limits
The property tax rate is defined by the State as, “[t]he rate necessary to support the budgets as
determined by the elected governing boards.”40 It is the amount levied on the property’s assessed
value. Property tax rates vary by tax districts. A tax district “is an area defined within a county for
taxing purposes.”41 Tax districts do not cross county lines, and no tax district in the State is
coterminous with a county in its entirety.42 The process for establishing tax rates is fairly complex
6and beyond the scope of this report, though for additional information, see the Guinn Center’s 2017
policy report, Property Taxes in Nevada: An Overview.43
The Nevada Constitution places a rate cap of five cents on one dollar of assessed valuation, or $5.00
per $100 of assessed valuation.44 As it is enshrined in Article 10 § 2, it establishes a hard ceiling on
the property tax rate in Nevada. A constitutional amendment would be necessary to raise the cap
above $5.00 per $100 of assessed valuation.
There is also a statutory cap of $3.64 per $100 of assessed valuation.45 This does not include an
amount of two cents allowed “outside the cap,” first authorized under Senate Bill (SB) 507 (2003
Legislative Session)—and reauthorized biennially since—for capital projects and the conservation of
natural resources, resulting in an effective cap of $3.66 per $100 of assessed valuation.46 Legislation
would be required to raise the statutory cap above $3.64 per $100 of assessed valuation.
Across 10 of Nevada’s 17 counties, approximately 30 local governments had property tax rates that
were at the effective cap of $3.66 per $100 of assessed valuation in FY 2019, including, amongst
others, West Wendover (Elko County), Tonopah (Nye County), Reno and Sparks (Washoe County), and
Ely (White Pine County).47 Property tax rate increases are prohibited where the effective cap has been
reached, as such an increase would exceed the statutory limit. This upper bound constrains these
jurisdictions from raising property tax rates to support their budgets, which can dampen property
tax collections, particularly over the long term.
Moreover, there are two mandatory elements that form part of the property tax rate in all tax
districts: the school operating rate and the State debt rate. All jurisdictions (tax districts) in Nevada
are required, by statute, to levy these exact tax amounts as part of their total property tax rates. No
tax district is exempt from these statutory requirements.
As required by NRS 387.195, 75 cents per $100 of assessed valuation of the property tax rate must
be levied for school operating costs.48 School operating costs include salaries, benefits, professional/
technical services, property services, and supplies. The dedicated amount for the support of local
public schools in the combined property tax rate is unvarying across tax districts, and, concomitantly,
counties, which are coterminous with school districts. In other words, the school operating rate of
75 cents per $100 of assessed valuation is the same for every school district in Nevada.49
State law requires a levy of 17 cents per $100 dollars of assessed valuation to service debt.50 The
actual debt rate is 15 cents per $100 but also includes the aforementioned two cents “outside the
cap,” reauthorized most recently in the 80th (2019) Legislative Session under Assembly Bill (AB) 541
for capital projects and “debt service for bonds issued specifically for state projects for the
conservation of the state’s natural resources.”51
Short of legislative action to raise the statutory cap, neither the school operating rate nor the State
debt rate can be increased, as such changes would apply to all tax districts. But that is not possible,
given that some jurisdictions are at the cap. Increases to these rates currently would violate the
statutory cap in certain parts of Nevada. The same holds true for local governments seeking to raise
their property tax rates in areas where the effective cap has been reached.
7Revenue Limits: Local Government Operating Rule
Property tax revenues collected by local governments can increase by a maximum of six percent
over the previous fiscal year, but the property tax rate itself cannot be lower than that imposed in
the previous fiscal year under a “hold harmless” provision. Specifically:
Pursuant to NRS 354.59811, the revenue a local government entity receives from property taxes is
allowed to be increased by a maximum of 6 [percent] per year. The previous fiscal year’s property
tax revenue is multiplied by 106 [percent]. This amount is then divided by the projected assessed
valuation for the upcoming fiscal year to determine the tax rate necessary to generate that amount
of revenue. The NRS also provides for a “hold harmless” scenario, in which the new calculated tax
rate cannot be less than the previous fiscal year’s rate. 52
What this suggests is that local governments can increase property tax rates, provided that the
revenue generated would not increase by more than six percent over the previous fiscal year. The
“hold harmless” provision implies that, if property tax revenue were projected to increase by more
than six percent over the previous fiscal year, the property tax rate would not have to be lowered
beneath the floor – the rate set in the previous fiscal year – to ensure that the revenue limit is not
exceeded; the rate would be set to equal that established in the previous fiscal year.
The local government operating rule limits revenue by design. When assessed values increase from
one fiscal year to the next, the tax rate necessary to generate a six percent increase in revenue tends
to fall below the property tax rate floor. Under the “hold harmless” provision, local governments
then set their rates at the floor. They cannot exploit revenue gains realized from higher assessed
values to the fullest extent possible.
This may explain why property tax rates in Nevada tend to remain relatively flat. For example, in
Clark County, there are 111 separate tax districts.53 Over three fiscal years – FY 2019, FY 2020, and
FY 2021 – property tax rates did not change in 87 districts (78.4 percent).54 Property tax rates:
• increased in four tax districts between FY 2019 and FY 2020 (8.33 cents per $100 of assessed
valuation; all four tax districts are in Boulder City);
• decreased in five tax districts between FY 2019 and FY 2020;
• increased in 13 tax districts between FY 2019 and FY 2020 and again between FY 2020 and
FY 2021 (all 13 tax districts are in Henderson; each saw the same total increase between FY
2019 and FY 2021 of 3.02 cents per $100 of assessed valuation); and
• increased in two districts between FY 2019 and FY 2020 but saw the amount zeroed out
between FY 2020 and FY 2021 (17 cents per $100 of assessed valuation in Renewable Energy
tax districts).55
Structural attributes of Nevada’s property tax system that are enshrined in the Nevada Constitution
and/or codified in law collectively depress revenues. For a given property, application of the
depreciation factor to the replacement cost of improvements reduces market value to taxable value.
The level of assessment further reduces taxable value to assessed value. Partial abatements limit
year-over-year increases in tax liability to no more than three percent or eight percent, depending
8on property type, but secondary caps mean that those percentages can be lower. Across the millions
of parcels in Nevada, the reductions add up to a considerable sum of forgone revenue.
The constitutional cap of $5.00 per $100 of assessed valuation sets a hard upper bound on the
property tax rate. But the statutory rate cap of $3.64 per $100 of assessed valuation, which is more
accurately an effective rate cap of $3.66 per $100 of assessed valuation, prohibits several local
governments from raising their rates, as they have reached the cap. Furthermore, absent a
conforming statutory change to the rate cap, legislative changes to the school operating rate and
the State debt rate are proscribed, since those are statewide rates that are required in every tax
district but cannot be effected in tax districts that are at the cap. The local government operating
rule, moreover, allows property tax revenues to increase by no more than six percent over the
previous fiscal year, which may have flattened property tax rates even in those tax districts that do
not have rates that have reached the cap.
As Nevada has a fair number of property tax limitations, its revenue collections may be relatively
low. On the other hand, most, if not all, states use some form of exemptions, deductions, and credits
to limit tax liability.56 The limitations embedded throughout Nevada’s property tax system may be
an artifact of institutional design rather than explicit revenue-dampening measures. The next section
evaluates whether property taxes are a comparatively limited revenue source for Nevada.
●●●
IV. How Does Property Tax Revenue in Nevada Compare to Other States?
This section situates Nevada’s property tax system in comparative context by analyzing current
aggregate data on property taxes in Nevada relative to other states. We evaluate the following: (1)
total property tax revenue per capita; (2) share of property tax in total state and local tax revenue;
and (3) state versus local shares of total property tax revenue. The data suggests that, after adjusting
for population, property taxes in Nevada are relatively low. Property taxes contribute somewhat
small shares to total tax revenue. However, Nevada has one of the highest state shares of total
property tax revenue distribution in the nation.
Figure 1 displays property revenue per capita for Nevada as compared to our focus states: those, like
Nevada, that do not collect individual income taxes.57 They are Alaska, Florida, South Dakota, Texas,
Washington, and Wyoming. (See Appendix A for a table of all states, ranked.)
Of all states and the District of Columbia, Nevada ranks in the bottom third, or 40th, with a property
tax revenue per capita (just over $1,000) that is low enough to differentiate it from its counterparts
that do not impose individual income taxes. Relative to the focus states, Nevadans enjoy the lowest
property tax burden, followed by Florida, which is ranked 30th in the nation ($1,376 per capita).
Florida is followed by Washington (25th; $1,551), South Dakota (18th; $1,654), Texas (14th; $1,934),
9Alaska (12th; $2,124), and Wyoming (10th; $2,172). Florida, Washington, and South Dakota rank in the
“middle 17” states, while Texas, Alaska, and Wyoming are in the top third.
Figure 1. Total Property Tax Revenue per Capita: Nevada vs. Focus States, 2017
Nevada’s property tax revenue per capita of $1,041 is below the U.S. average of $1,638, and well
below the highest-ranked of all, the District of Columbia, which has a property tax revenue per capita
of $3,617. To put this into perspective, the District of Columbia’s property tax revenue per capita is
about 3.5 times that of Nevada, while Nevada’s property tax revenue is just 1.8 times that of the
lowest-ranked state, Alabama, for which property tax revenue per capita is $585.
However, it is important not to draw inferences from property tax revenue per capita in isolation.
First, it must be considered in conjunction with other metrics to form a more complete picture.
Second, it does not speak to adequacy. Nevada’s property tax per capita indicates only that, after
adjusting for population, total property tax revenue is low when compared to other states. Third, a
relatively low property tax burden can mean a greater reliance on other taxes to offset the difference,
as we will discuss in the next section.58
Figure 2 shows the share of property tax revenue in total state government tax revenue, total local
government tax revenue, and total state and local government tax revenue.59 Only Nevada and the
focus states are displayed. (See Appendix B for a table of all states, ranked.)
10Figure 2. Share of Property Tax in Total Tax Revenue, by Level of Government: Nevada vs. Focus
States, 2017
One study observes that, “[w]hile property taxes are a significant source of local government
revenue, they are a very small revenue source for most states[.]”60 This finding is consistent with the
data in Figure 2. Property taxes to not contribute to total state government tax revenue in three of
the six focus states (Florida, South Dakota, and Texas). Property taxes make up about 3.5 percent of
total state government tax revenue in Nevada, which is above the U.S. average of 1.7 percent. Nevada
ranks 15th amongst the 36 states that distribute property tax dollars to their state governments. But
it is still lower than the three focus states that have state property tax shares. Of the 36 states,
Wyoming ranks 2nd (16.6 percent), Alaska ranks 6th (10.2 percent), and Washington ranks 7th (8.7
percent). Across all states, the state contribution tends to be quite low, with the exception of
Vermont, ranked highest (33.5 percent); Nebraska’s contribution is the lowest at 0.002 percent.
Compared with the focus states, Nevada contributes the smallest share of property tax to total local
government tax revenue, and it ranks 43rd in the nation (56.3 percent). It is followed by Washington
(42nd; 57.6 percent), South Dakota (28th; 74.8 percent), Florida (25th; 76.6 percent), Alaska (24th; 78.7
percent), Texas (17th; 82.5 percent), and Wyoming (16th; 85.0 percent). The U.S. average is 72.1
percent, meaning that Nevada’s share is more than 15 percentage points lower than the national
average. The highest-ranked state is Maine, at 98.9 percent. The District of Columbia has the lowest
rank at 32.6 percent, which is of note, as its property tax revenue per capita is highest in the nation.
The apparent disconnect may suggest that, while property taxes are fairly high, other taxes, if
relatively higher, may counterbalance the influence of the property tax.
11Share of property tax revenue in total state and local government revenue is a metric that captures
the impact of property tax collections on total tax revenues. Nevada does not fare well on this
indicator, both nationwide and in comparison to the focus states. It is ranked 43 rd, with property
taxes contributing less than one-quarter of total state and local government tax revenue (22.4
percent). It is below the U.S. average of 31.8 percent. Washington is ranked 30th, with a 28.0 percent
property tax contribution to total state and local government tax revenue. It is followed by Florida
(15th; 35.9 percent), South Dakota (13th; 38.0 percent), Wyoming (5th; 45.0 percent), Texas (4th; 45.0
percent), and Alaska (2nd; 51.8 percent). Most notably, property tax contributions to state and local
government tax revenues are amongst in the highest in the nation for three of the six focus states,
with Alaska, Texas, and Wyoming in the top five of all states. The highest-ranked state is New
Hampshire (66.6 percent), and the lowest-ranked state is Alabama (17.3 percent).
The property tax burden in Nevada is comparatively low, and so too is its influence on local
government tax revenue and total state and local government tax revenue. Collectively, this
suggests that property taxes in Nevada are intrinsically low and may imply that the revenue
limitations in Nevada’s property tax system structurally reduce collections.
We also observed, however, that Nevada contributes a comparatively high share of property tax to
total state government tax revenue, ranking 15th amongst the 36 states that remit property tax
collections to their state governments. Figure 3 shows the distribution of property taxes to state
governments versus local governments.61 All states are displayed, as the focus states that do not
have a state contribution otherwise would be omitted, that is, Florida, South Dakota, and Texas. (See
Appendix B for a table of all states, ranked.)
Nevada exceeds the U.S. average of 3.1 percent, with a state share of about 10.0 percent. It is ranked
11th in the nation. Amongst the focus states, Wyoming ranks the highest, 3rd, with a state share of
21.6 percent, followed by Washington, ranked 5th (18.9 percent). Alaska ranks below Nevada (16th),
with a state share of 7.7 percent. The highest-ranked state is Vermont (63.4 percent), and the lowest
is Nebraska, with a small share that is close to zero.
Figure 3 provides evidence that three of the six focus states, plus Nevada, distribute property money
to their state governments. Amongst these states, are property tax dollars used to shore up
unrestricted revenue in the absence of individual income taxes? The next section examines the
relationship between property taxes and General Fund revenues in the focus states, as compared to
Nevada, and also considers whether the seven states exhibit reliance on particular revenue sources.
12Figure 3. State Share vs. Local Share of Total Property Tax Revenue, 2017
●●●
V. What Is the Relationship Between Property Taxes and General Fund Revenue in Nevada?
Does It Differ in the Focus States?
To establish a foundation for this analysis, it is necessary to situate unrestricted General Fund
revenue in comparative context. States’ General Funds typically comprise own-source revenues, such
as taxes, licenses, and fees, which are used for operational expenses with no special purpose
attached (though there are exceptions). Figure 4 displays FY 2019 total General Fund revenues per
capita, by focus state and for Nevada, with total General Fund revenues included in the labels.62
With approximately $4.4 billion in its General Fund for FY 2019, Nevada does not have the lowest
total general revenue amongst the seven states. That distinction goes to Wyoming ($1.4 billion),
followed by South Dakota ($1.6 billion). Alaska’s total FY 2019 General Fund amount of $5.3 billion
13is just slightly higher than Nevada’s but then the amounts increase progressively, with Washington
at $22.4 billion, Florida at $33.8 billion, and Texas at $110.9 billion.
Figure 4. Total General Fund (GF) Revenues per Capita: Nevada vs. Focus States, FY 2019
General Fund revenues per capita vary quite a bit. Alaska has the highest per capita amount at
$7,313, derived, in large part, from petroleum sources.63 It is followed by Texas ($3,823), Washington
($2,946), Wyoming ($2,409), South Dakota ($1,860), Florida ($1,574), and, finally, Nevada ($1,429).
This indicates that Nevada relies on less general revenue per resident for discretionary spending
than the focus states. Excluding Alaska, for which General Fund revenues per capita are
disproportionately high, we compare Nevada to Texas, which is the second-highest per capita
amount. General Fund revenues per capita in Texas are roughly 2.7 times that of Nevada. It does not
appear that Nevada’s own-source general revenue offsets its relatively low property tax burden.
In the previous section, we queried whether relatively high state shares of property taxes in Nevada
and three of the focus states that contribute property taxes to total state government tax revenue –
Alaska, Washington, and Wyoming – might mean that property taxes contribute to unrestricted
General Fund revenue. Figures 5.1–5.7 show the composition of General Fund revenue sources in
Nevada and each of the six focus states.64 Here, we note the following:
• Although Florida, South Dakota, and Texas do not contribute any property tax revenue to
their state governments, they are displayed here, as they will form part of the discussion in
a subsequent part of this section.
• Some states deposit a vast number of revenue sources in their General Funds. This required
categorization by our research team. We endeavored to make the categories as comparable
14as possible, but they are not perfect analogous. For example, the cigarette tax is displayed
as a unique revenue source for Nevada but aggregated in the excise taxes category for Alaska.
• South Dakota and Wyoming do not impose a corporate income tax or gross receipts tax.
Alaska and Florida levy corporate income taxes, and Nevada, Texas, and Washington impose
taxes on gross receipts.65 The gross receipts tax is a sales tax that is levied on a business
(sellers) as a percentage of its total sales/gross revenue.66 It is known as the commerce tax
in Nevada.
• Amongst the seven states, Alaska is the only one that does not impose a statewide sales
tax.67
As the previous section noted, four states, including Nevada, distribute property tax money to their
state governments. However, the figures show that only two states – Alaska (Figure 5.2) and
Washington (Figure 5.6) – deposit property tax money in their General Funds. We examine further.
Recall that Nevada mandates two statewide elements in each tax district’s property tax rate: 17 cents
per $100 dollars of assessed valuation for the State debt rate and 75 cents per $100 of assessed
valuation for the school operating rate. Only the revenue generated from the State debt portion of
the property tax rate is distributed to the State. It is deposited in Nevada’s Other Fund, which contains
amounts from “…licenses, fees, fines, loan repayments, charges for services or other revenues…which
are not deposited into the General Fund for use in the appropriations process.”68 This revenue is
restricted, which means that it can be used only for specific purposes. It is not part of the General
Fund for unrestricted operational expenses.
In FY 2019, approximately $184.4 million generated from property taxes was deposited in the Other
Fund, of which about 85.6 percent was used for bond interest and redemption. 69 Smaller portions of
the total had allowable uses for indigent hospital care and renewable energy.70 In that year, the
State’s share of property taxes, net of abatements, was 5.3 percent.71
Figures 5.1–5.7: General Fund Revenues, FY 2019: Nevada (5.1), Alaska (5.2), Florida (5.3), South
Dakota (5.4), Texas (5.5), Washington (5.6), and Wyoming (5.7)
Nevada’s General Fund Revenues, FY 2019
Sales and Use Tax, 29.1%
Gaming Taxes–State, 18.5%
Modified Business Tax, 15.6%
Insurance Taxes, 10.1%
Non-Tax Revenue, 6.3%
Commerce Tax, 4.9%
#
Other Taxes, 4.2%
#4
Cigarette Tax, 3.7%
#4F
Live Entertainment Tax, 2.9%
#F44
Real Property Transfer Tax, 2.3%
#F43
Mining Taxes and Fees, 1.2%
#F4 35
#F43 50Transp. Connect. Excise Tax, 0.7%
F#34 0Governmental Services Tax, 0.5%
5
15
FF53 0
FFA05
D
F0
A
DEAlaska’s General Fund Revenues, FY 2019
Investment Revenue, 52.6%
Petroleum Royalties, 20.8%
Oil and Gas Production Tax, 11.1%
Petroleum Corporate Income Tax, 4.1%
Excise Taxes, 2.7%
Non-Tax Revenue, 2.7%
#
4 Petroleum Property Tax, 2.2%
#
F4Corporate Income Tax, 2.1%
#4
F4Other Tax, 1.1%
3
#4
F4
5 Fisheries Tax, 0.5%
3
4 #
F0
54
3
4
Florida’s General Fund Revenues, FY 2019 0
5
F
34Sales Tax, 75.1%
0
53Corporation Income Tax, 9.3%
05
Other Taxes, Licenses, and Fees, 3.1%
0Documentary Stamp Tax, 2.7%
Insurance Premiums Tax, 2.6%
Highway Safety Licenses and Fees, 1.6%
Service Charges, 1.4%
Intangibles Tax, 1.1%
Beverage Tax and Licenses, 0.9%
Counties’ Medicaid Share, 0.9%
Interest, 0.7%
Tobacco Taxes, 0.5%
Pari-Mutuels Tax, 0.1%
South Dakota’s General Fund Revenues, FY 2019
Sales and Use Tax, 62.9%
Lottery, 7.4%
Contractor’s Excise Tax, 7.0%
Other Charges, Fees, Misc., 6.8%
Insurance and Bank Franchise Tax, 6.3%
Alcohol and Tobacco Tax, 3.8%
Unclaimed Property Receipts, 2.9%
Trust Funds, 2.3%
Telecommunications Tax, 0.3%
Severance Taxes, 0.3%
16Texas’s General Fund Revenues, FY 2019
Sales Taxes, 30.6%
Federal Income, 25.7%
Other Revenue, Sources, Taxes, Misc., 22.0%
Motor Vehicle Sales and Rental Taxes, 4.5%
Oil Production Tax, 3.5%
Motor Fuel Taxes, 3.4%
Franchise Tax (Gross Receipts), 2.7%
Insurance Taxes, 2.3%
Natural Gas Production Tax, 1.5%
Licenses, Fees, Fines, and Penalties, 1.5%
Alcoholic Beverages Taxes, 1.2%
Hotel Occupancy Tax, 0.6%
Cigarette and Tobacco Taxes, 0.5%
Washington’s General Fund Revenues, FY 2019
Retail Sales and Use, 52.9%
Business and Occupation (Gross Receipts), 19.8%
Property (State School Levy), 10.7%
Real Estate Excise, 4.9%
Other Revenue, Sources, Misc., 2.8%
Insurance Premiums, 2.7%
Non-Tax Sources, 2.1%
Cigarette and Tobacco, 1.9%
Alcoholic Beverages, 1.4%
Cannabis Excise Taxes, 0.6%
Other Taxes, 0.3%
Wyoming’s General Fund Revenues, FY 2019
Sales and Use Tax, 37.2%
Permanent Wyoming Mineral Trust Fund, 26.2%
Severance Tax, 19.5%
Pooled Income, 6.2%
Charges–Sales and Services, 3.7%
All Other, 3.5%
Franchise Tax, 2.7%
Revenue from Others, 0.6%
Penalties and Interest, 0.4%
17The levy from the school operating rate is collected by counties, which are the fiscal agents in
Nevada, and distributed to school districts directly under the Nevada Plan, which is primary funding
mechanism for K-12 education in Nevada; no portion is received by the State.72 Net of abatements,
school districts received roughly $1.2 billion in FY 2019 from property taxes, representing 40.1
percent of total property tax collections in Nevada.73 However, that may change under the Pupil-
Centered Funding Plan, which will go into effect beginning with the 2021-2023 biennium pursuant
to Senate Bill (SB) 543 of the 80th (2019) Legislative Session.74 All property tax revenue generated
from the school operating rate will be deposited in the State Education Fund, a special revenue fund
to be administered by the Superintendent of Public Instruction.75
Thus, in Nevada, though there are two statewide mandatory portions of the property tax rate, only
the portion for the State debt rate currently is distributed to the State itself. No property tax money
is deposited in the General Fund for general support of the budget, unrestricted operating expenses,
the appropriations process, and/or discretionary spending. That will not change when the State
Education Fund is established. While the money may be treated as state government revenue, it will
be a special revenue fund with dedicated resources.76
As for the three focus states that contribute property taxes to state government revenues, we will
take each in turn, in order of most to least similar with Nevada.
• Wyoming (Figure 5.7) levies a state tax of 12 mills for the State School Foundation Fund. 77
(The millage rate is defined such that 1 mill is equal to $1 in property tax levied per $1,000
of a property’s assessed value, so 12 mills is equal to $12 per $1,000 of assessed valuation,
or, for comparability with Nevada, $1.20 per $100 of assessed valuation.) “This levy is
collected from all counties and remitted to the state where it is distributed to school districts
based on a foundation formula.”78 While property tax money is received by the State of
Wyoming, no property taxes in Wyoming are deposited in the General Fund, and there is no
statewide amount for unrestricted operational expenses.79 Wyoming is similar to Nevada in
that it has a statewide school property tax rate portion but dissimilar in that the money is
remitted from the counties to the state, which then distributes the revenue to school districts,
rather than from the counties to the school districts, as in Nevada. However, Nevada may
look more like Wyoming once the State Education Fund is established.
• Figure 5.6 shows that property taxes contribute about 10.7 percent to Washington’s General
Fund. The amount was $2.4 billion in FY 2019. Washington imposes a state property tax levy
that was set at a levy rate of $2.40 per $1,000 of market value in 2019.80 This is a state levy
for support of common schools that is deposited in the Washington General Fund. 81 In fact,
all property tax revenue generated from the state property tax rate is deposited in the
General Fund, but it is earmarked for school support.82
– Like Nevada and Wyoming, Washington imposes a mandatory state portion of its property
tax rate that contributes to state government tax revenue. Where Nevada’s portion is
used to service debt, Wyoming and Washington’s state portions are dedicated for school
funding, though Nevada has a school operating rate portion of its property tax rate that
is distributed directly from counties to school districts (under the current Nevada Plan).
18– Unlike Wyoming, which deposits state property tax revenue in a special revenue fund,
the Washington’s state property tax levy is deposited in the General Fund. Both states
earmark the state portions entirely for education. Ultimately, the distinction is one of
fiscal organization: all three states distribute property tax revenue to their state
governments, and all dedicate a portion of the property tax levy for education. With
respect to the latter, Nevada distributes the money from counties to school districts,
Wyoming deposits the money in a special revenue fund, and Washington places the
money in the General Fund but earmarks it for education. None of these states use
property tax revenue for general operating expenses.
• Alaska (Figure 5.2) is the outlier amongst the four under consideration here that distribute
property tax revenue to state governments. There is no statewide property tax on real
property, and of the 19 boroughs in Alaska – which are similar to counties – only 15 levy a
property tax.83 However, pursuant to Chapter 43.56 of Alaska Statutes, an annual property
tax of 20 mills, or $2.00 per $100 of assessed valuation, is imposed on oil and gas
exploration, production, and pipeline transportation.84 The levy is deposited in the Alaska
General Fund.85 The petroleum property tax amounted to approximately $119.5 million in FY
2019 and accounted for about 2.2 percent of Alaska’s General Fund revenues. It is an
unrestricted revenue source.86 And while Alaska contributes a substantial state portion to
education under its K-12 funding formula, there is no state-level property tax element that
is earmarked for school support.87
We theorized that states that do not impose individual income taxes may fortify their General Funds
with property taxes to offset forgone revenue from the absence of this major funding stream.
However, with the exception of Alaska, which is unique in that its state property tax is levied only
on petroleum, that does not appear to be the case. Florida, South Dakota, and Texas do not distribute
property tax money to their respective state governments. Nevada has a state property tax share but
restricts its use to debt servicing. Wyoming distributes its state property tax to a special revenue
fund from which the money is allocated to school districts, while Washington deposits property tax
revenue in its General Fund but earmarks it entirely for school support.
Figures 5.1–5.7 reveal insights into the composition of revenue sources in states that do not have
individual income taxes. These states tend to have high sales tax dependence and/or come to rely
on sectors in which they have a comparative advantage to supply general revenue.
In Nevada, the sales and use tax and gaming taxes collectively account for nearly half of the General
Fund (47.6 percent). Tourism-dependent Florida disproportionately relies on the sales tax, with more
than three-quarters (75.1 percent) of its General Fund revenues derived from that source. Sales tax
dependence is comparatively high, as well, in South Dakota (62.9 percent), Washington (52.9
percent), Wyoming (37.2 percent), and Texas (30.6 percent). In fact, excluding Alaska, which does not
have a state sales tax, sales and use taxes form the largest share of each state’s General Fund.
Alaska’s dependence on petroleum is in evidence, not just through the petroleum property tax but
petroleum royalties, the oil and gas production tax, and the petroleum corporate income tax; in
19combination, they contribute 36.0 percent to the General Fund. Moreover, investment revenue, which
makes up more than half of Alaska’s General Fund (52.6 percent), rests primarily on returns from the
Alaska Permanent Fund, which comprises investment income from oil revenue.88 Nearly 90.0 percent
of Alaska’s General Fund is petroleum-dependent. Wyoming imposes a six percent excise tax on
normal production of oil and gas – the severance tax – which contributes a nearly one-fifth share
to its General Fund (19.5 percent).89
Although the aforementioned taxes are distinct from one another, the share a common trait:
volatility. Sales and use taxes are vulnerable to economic cycles, meaning that they fluctuate with
short- and long-term local and national economic conditions, thus making them a volatile source of
revenue. Oil prices are governed by national and international market forces.90 An oversupplied
market, for example, can reduce oil prices significantly, depressing collections in states that are
dependent on these revenues.
The analysis suggests that Nevada and the focus states are reliant on revenue sources that are
susceptible to economic oscillations, leaving them highly exposed to budgetary shortfalls on the
downside of the cycle. Only Alaska deposits a portion of the property tax in its General Fund, and
even then, the contribution is quite small. Nevada and the remaining focus states do not use the
more stable property tax to shore up general revenue, the drawback of which is amplified during
economic crises.
●●●
VI. Has Legislation Been Enacted Recently in Nevada to Address Property Tax Revenue
Limitations? What Measures Have Other States Implemented or Considered?
Local governments have stated that certain policy interventions – particularly, partial abatements –
have challenged their ability to continue providing the same level of services. The long-term
structural shift over time – away from property taxes and towards a greater reliance on sales taxes,
which are inherently more volatile – has challenged revenue management and planning for local
governments.91 But there is an inherent tension between financing local governments while not
imposing undue burdens on property owners, as was acknowledged by the Nevada Legislature in
one of the pieces of enabling legislation (Assembly Bill 489) for the establishment of partial
abatements in 2005. The Legislature found, in part, that the:
rapid growth in population has resulted in a tremendous increase in both commercial and residential
development which has contributed to an extreme rise in land values, in some cases up to 300
percent[.] Increased land values translate into increased property tax bills, which is an unexpected
financial burden to many property owners, a large number of whom are forced to live on fixed
incomes which typically only increase minimally each year[.] 92
The structural features of Nevada’s property tax system that place limits on property taxes, resulting
in potentially lower revenue collections, simultaneously provide substantial tax relief to property
owners. These measures offer protections to Nevada taxpayers both in overheated real estate
20markets and during economic downturns. Legislators must grapple with striking a balance between
revenue collection and financial security for Nevada’s residents and businesses.
In recent years, certain solutions have been proposed in Nevada to address structural issues
associated with property taxes and their impact on local government financing. Those that have
gained legislative traction recently—partial abatements and depreciation—are discussed below.
These solutions are not the only options available to Nevada policymakers, but they are the two that
have been advanced in recent years. Table 1 summarizes the various ways property tax calculations
can be revised in Nevada and the statutory and/or constitutional requirements for action. In addition,
we examine recent property tax legislation and proposals that have been taken under advisement
in other states.
Partial Abatements
Two pieces of proposed legislation, Assembly Bill (AB) 43 in the Assembly and Senate Bill (SB) 425
in the Senate, were introduced in the 79th (2017) Session to amend the way in which partial
abatements are calculated.
AB 43 would have adjusted the formulas for calculation of the secondary caps beginning in FY 2018.
It would have established similar calculations for both owner-occupied single family residences and
all other property, only permitting the limit of increase to dip below three percent for FY 2018 if
certain conditions were met.93 After FY 2018, the limit of increase for owner-occupied single family
residences would have fixed at the secondary cap established for FY 2018 or three percent,
whichever is less, and the limit of increase for all other property would have fixed at the secondary
cap established for FY 2018 or eight percent, whichever is less.94 The primary caps of three percent
for owner-occupied single family residences and eight percent for all other properties would have
remained intact under the proposed legislation. The legislation effectively proposed to “set a floor
on the cap,” not on the property tax bill. Therefore, the legislation would not have meant that owners
of properties not subject to abatement would have seen their bills ratcheted up to meet a minimum
percentage of three percent or eight percent, depending on property type. The legislation died in
committee.95
Like the Assembly bill, SB 425 would have maintained the primary caps of three percent for owner-
occupied single family residences and eight percent for all other property.96 However, it would have
eliminated the secondary caps entirely, beginning July 1, 2017.97 Like AB 43, the language of the
Senate bill did not require that any tax bill would be forced up to meet a floor.
Depreciation
Nevada’s use of the cost approach has garnered criticism over the years. According to critics, the split
of cash value of land and replacement cost of improvements, less depreciation, has produced a
bifurcated system with valuation inequities from property to property.98 The principal issue is
whether it violates the Nevada Constitution’s mandate for a uniform and equal rate of assessment
and taxation, given that adjacent properties with different age-adjusted improvements, would have
dissimilar taxable values in kind.99
21You can also read