SURVEYING STATE LEADERS ON THE STATE OF STATE TAXES - Lucy Dadayan and Kim Rueben July 2021 - Tax ...
←
→
Page content transcription
If your browser does not render page correctly, please read the page content below
SURVEYING STATE LEADERS ON THE STATE OF
STATE TAXES
Lucy Dadayan and Kim Rueben
July 2021
ABSTRACT

State taxes were upended in the aftermath of the COVID-19 pandemic as governments shut down large parts of
the economy. While overall state tax revenues have fared better than expected since then, state leaders have
been closely examining existing tax policies and considering changes in the wake of the pandemic to adjust to
the new fiscal and business environment.

We surveyed state budget officials to understand the fiscal situation in each state and fiscal policies under
consideration. The survey findings confirm that the impact of the downturn varied significantly across states
depending on their economy, tax structures, and government actions. Revenue drops were mitigated due to
strong income taxes, as well as sales taxes that were bolstered by states' expanded authority to collect taxes on
on-line sales. The survey results indicate that because of how sales taxes are remitted, many states cannot
differentiate between different types of sales to monitor for changes in spending patterns for retailers that have
a physical presence within a state. In addition, state officials remain concerned about the longer-term fiscal
picture because of the uncertainty related to federal policy actions and post-pandemic consumer and business
behavior.

A B O U T T H E T A X P OL I CY CE N T E R
The Urban-Brookings Tax Policy Center aims to provide independent analyses of current and longer-term tax issues and to
communicate its analyses to the public and to policymakers in a timely and accessible manner. The Center combines top
national experts in tax, expenditure, budget policy, and microsimulation modeling to concentrate on areas of tax policy that
are critical to future debate.

Copyright © 2021. Tax Policy Center. Permission is granted for reproduction of this file, with attribution to the Urban-
Brookings Tax Policy Center.

T A X P O L I C Y C E NT E R | U RB AN IN ST I T U T E & B RO O K I N G S IN ST I T U TI O N                               ii
CONTENTS

ABSTRACT                                                                                        II

CONTENTS                                                                                       III

ACKNOWLEDGMENTS                                                                                IV

INTRODUCTION                                                                                    1

HIGHLY UNCERTAIN REVENUE PICTURE DURING THE PANDEMIC                                            4

STATE REVENUE FORECASTS                                                                         9

STATE SALES TAX REFORM PLANS FOR FY 2022                                                       15

STATES’ CONSUMPTION PATTERNS DURING THE PANDEMIC                                               22

STATES’ ONLINE SALES TRANSACTIONS AND TAXATION                                                 26

TAXATION OF DIGITAL GOODS AND SERVICES                                                         37

STATE CURRENT AND FUTURE FISCAL CHALLENGES                                                     39

CONCLUSION                                                                                     43

APPENDIX A. SURVEY ADMINISTRATION                                                              45

APPENDIX B. SURVEY INSTRUMENT                                                                  47

ENDNOTES                                                                                       48

T A X P O L I C Y C E NT E R | U RB AN IN ST I T U T E & B RO O K I N G S IN ST I T U TI O N         iii
ACKNOWLEDGMENTS

The Tax Policy Center thanks Avalara for its support of this work.

    The views expressed are those of the authors and should not be attributed the Urban-Brookings Tax Policy
Center, the Urban Institute, the Brookings Institution, their trustees, or their funders. Funders do not determine
research findings or the insights and recommendations of our experts. Further information on Urban’s funding
principles is available at http://www.urban.org/aboutus/our-funding/funding-principles; further information on
Brookings’ donor guidelines is available at http://www.brookings.edu/support-brookings/donor-guidelines.

T A X P O L I C Y C E NT E R | U RB AN IN ST I T U T E & B RO O K I N G S IN ST I T U TI O N                     iv
INTRODUCTION
The COVID-19 pandemic hit state finances hard in the spring of 2020. The public health emergency and
government-ordered restrictions shut down large parts of the economy, causing steep declines in state and
local government tax revenues. Over the rest of the year, however, economic activity and tax revenue
rebounded or fully recovered in most states. On net, state revenues declined by nearly $14 billion or 1.8
percent between April and December 2020 compared with the same period a year earlier (Figure 1). But there
were dramatic changes in the sources and timing of revenues, and the national picture masks large variations
across states.
FIGURE 1
State Tax Revenue Trends during the Pandemic
Year-over-year percent change in cumulative state tax revenues
10%
Total taxes Sales tax Personal income tax Corporate income tax
0%
-10%
-20%
-30%
-40%
-50%
-60%
-70%
Apr-20 May-20 Jun-20 Jul-20 Aug-20 Sep-20 Oct-20 Nov-20 Dec-20
Source: State and Local Finance Initiative, Urban Institute.
In April 2020, state tax receipts shrank nearly $61 billion, or 49 percent, compared with April 2019.1 But part
of this decline was related to delays in tax deadlines: the federal government postponed its income tax
deadline from April 15 to July 15; most states also postponed that deadline as well as various other deadlines.
Indeed, state revenues have generally rebounded: year over year, total state tax revenues declined by $77
billion or 26 percent for the April–June 2020 period but increased by $49 billion or 23 percent for the July–
September 2020 period, in part reflecting these deadline delays.
How did state tax revenue recover if unemployment remained relatively high compared with levels before
the pandemic in many states? First, higher unemployment rates during the pandemic were largely concentrated
T A X P O L I C Y C E NT E R | U RB AN IN ST I T U T E & B RO O K I N G S IN ST I T U TI O N 1among low-income workers, especially those in the service sector; high-income workers were largely unaffected.
As a result, states did not see large declines in income tax revenue (especially states with progressive taxes).
Second, the federal assistance passed in spring 2020 mitigated the impact on individuals, businesses, and state
and local governments. And third, although sales tax revenues saw immediate declines, these also recovered as
they were buoyed by most states receiving sales tax revenues from online sales.
However, it is also important to recognize the severity of the economic downturn and its affect on state tax
revenue varied significantly across states. During the April–December 2020 period, state revenues declined 10
percent or more in seven states (Alaska, Hawaii, Florida, Nevada, North Dakota, Oregon, and Texas), and they
increased in 22 states (and by more than 5 percent in four of them—Idaho, Colorado, South Dakota, and Utah).
As such, analyzing the economic downturn by state requires understanding each state’s fiscal situation and
economic conditions as well as how state policies mitigated the impact of the pandemic on state budgets.
Thus, with funding from Avalara, we conducted a survey of state government officials involved in fiscal
policy decisions and revenue forecasting.
Our survey and this report focus on the following areas:
◼ The impact of the pandemic on state overall finances and sales tax revenues
◼ Revenue forecasts for fiscal year (FY) 2021 and beyond
◼ Possible tax policy changes
◼ Changes to the consumption of goods and services
◼ Practices and challenges for collecting sales taxes from online sales transactions
◼ The taxation of digital goods and services
We sent surveys to representatives in the executive and legislative branches in every state. In some cases,
we received collaborative responses; in others we received information from only one branch that felt better
able to respond. In total, we have information from 44 states, including 4 states where we received information
from both branches (Alaska, California, North Dakota, and Pennsylvania). The responses below reflect
information from 33 officials on the executive side and 11 from the legislative side. (See Appendix A for more
details on methodology and Appendix B for our survey instrument.) Our survey results correspond with what we
saw in the revenue data: The overall revenue picture is not great but not as grim as initially feared. In most
places, after initial belt-tightening, officials are now stepping back and thinking about their fiscal future.
Here are the key findings from our survey:
◼ State fiscal leaders are generally optimistic about the fiscal future for the next year or two but face
uncertainty around evolving consumer activity and the the timing of economic activity resuming.
T A X P O L I C Y C E NT E R | U RB AN IN ST I T U T E & B RO O K I N G S IN ST I T U TI O N 2◼ States with progressive income tax structures were better able to weather the pandemic-induced
recession, and the states that rely heavily on leisure and hospitality industry suffered the most.
◼ Many states saw online sales tax revenue as important to their fiscal health, but did not necessarily
have complete information on how sales were made. Because of how sales taxes are remitted, many
states cannot differentiate between in-person or online sales for retailers that have a physical
presences within their state.
Because of the timing of our survey, many state officials responded to it before the passage of the
American Rescue Plan Act (ARPA), and many indicated that uncertainty related to additional federal assistance
to state and local governments was hindering their policy decisions. The ARPA provides $350 billion to state,
local, and tribal governments to mitigate the fiscal effects of the pandemic. It allows states and localities to
spend on activities related to fighting COVID-19, restore public services that were cut because of revenue
losses during the pandemic, rehire or increase compensation for some types of public service workers, invest in
selected infrastructure, and restore economic sectors that were hurt by the pandemic. Most notably, the law
prohibits states from using federal funds to make additional payments to public pension funds or to pay for tax
cuts. The limitations on paying for tax cuts have since been further clarified: generally, states must have
revenues higher than those reported in FY 2019 to do so.
Officials in some states delayed responding to our survey because they wanted to wrap up their current
legislative sessions and be better positioned to respond to the questions. Officials in one responded, “The final
actions taken by our Legislature are directly associated with many of your questions. It would be premature
today to respond to your survey being so close to factual results.” In general, respondents indicated they only
felt comfortable sharing information about policy decisions that were final. For example, officials in one state
said, “We are currently in legislative session and things may evolve by the end of April 2021.”
With this in mind, we evaluate some of the results based on whether we received the survey responses
before or after passage of ARPA. A follow-up survey with similar and additional questions, preferably outside of
the legislative session, would be very helpful.
T A X P O L I C Y C E NT E R | U RB AN IN ST I T U T E & B RO O K I N G S IN ST I T U TI O N 3HIGHLY UNCERTAIN REVENUE PICTURE DURING THE PANDEMIC
Key takeaway: Most states were unable to fully assess the impact of the pandemic on their budgets.
As found in our state revenue analysis work and documented in our State Tax and Economic Review reports, the
pandemic had a very uneven effect on state budgets.2 States that have more diverse tax structures and states
that have progressive income tax structures fared much better than states that rely heavily on taxes related to
tourism, hospitality, and leisure industries (e.g., Hawaii and Nevada).
We asked respondents if their state was able to gauge the impact of the pandemic on overall tax revenues
and what those revenue impacts were. Survey responses indicate that 15 states were able to assess the impact
of the pandemic on state revenues, 28 states were only partially able to assess the effects, and one state was
unable to assess the effects (Table 1).
One reason policymakers could have difficulty assessing how the pandemic affected tax collections is
because most state governments delayed tax collections and thus moved tax revenue from one fiscal year to
another. When the pandemic spread across the United States, the federal government delayed the income tax
filing due date from April 15 to July 15, which led all states with broad-based income taxes to delay their state
income tax due dates as well. Moreover, about half of the states also extended filing and remittance deadlines
for sales tax payments by retailers or waived interest and penalties for late payments.
These policy measures, although important for helping taxpayers and businesses navigate the pandemic,
created budgetary challenges for many states and especially increased uncertainty about how the dramatic
change in economic activity would translate into lower revenues. Most notably, the delayed income and sales
tax due dates shifted revenues in many states from FY 2020 into FY 2021.
Officials in 33 states indicated that the federal and state policy changes, including shifts in dates for income
tax returns or shifts in general sales tax remittance deadlines, had affected their state’s FY 2020 revenues;
officials in 11 states indicated no impact (Table 1). It appears the states that indicated no impact are either those
that have different fiscal year start dates or those that accrued revenues received in July 2020 back to FY 2020.
T A X P O L I C Y C E NT E R | U RB AN IN ST I T U T E & B RO O K I N G S IN ST I T U TI O N 4TABLE 1
States’ Ability to Gauge the Impact of the
Pandemic and FY 2020 Revenue Picture
Was your state able to gauge the impact of the pandemic on Yes No Partially
overall tax revenues?
15 1 28
Were your state’s FY 2020 revenues affected in important ways Yes No Not sure
due to federal and state policy changes, including shifts in due
dates for income tax returns or shifts in general sales tax
remittance deadlines? 33 11 0
State officials were asked to indicate how total and general sales tax revenues in FY 2020 compared with FY
2019 and whether it grew or shrank. Even if the impact of the pandemic was not as devastating as initially
feared, officials in 27 states indicated that their tax revenues declined in nominal terms in FY 2020 compared
with FY 2019, while officials in 17 states indicated growth in overall state tax revenues. Further, officials in 14
states indicated that their general or excise sales tax revenues had declined in FY 2020 compared with FY 2019,
while officials in 29 states reported growth (Figure 2).
Note that prior to the pandemic, most states experienced strong year-over-year growth in overall tax
revenues as well as in general and excise sales tax revenues for FY 2019 and were expecting even stronger
growth in FY 2020. The strength in revenues for the first part of the fiscal year helped states, because the
pandemic affected only the last three months of the FY 2020 budgets in the 46 states where fiscal year runs
from July 1 to June 30.
For states with different FY start dates, the pandemic had varying effects on their finances. In New York, the
fiscal year runs from April 1 to March 31, so the pandemic had very little impact on its FY 2020 budget. The
fiscal year runs from October 1 to September 31 in Alabama and Michigan and from September 1 to August 31
in Texas, meaning the pandemic affected them slightly differently. They saw fewer early months of growth, but
FY 2020 revenues included delayed income tax remittances.
T A X P O L I C Y C E NT E R | U RB AN IN ST I T U T E & B RO O K I N G S IN ST I T U TI O N 5FIGURE 2
Growth in Total and General Sales Tax Revenues
in FY 2020 Compared with FY 2019
Number of states
27
Total tax revenues General sales tax Excise tax
24
22
21
18 17
15 14
12
10
9
7
6
4
3 3
3 2
1 1 1 1 1 1
0
> 10% 5-10% 0-5% No change 0-5% increase 5-10% > 10% Don't know
decrease decrease decrease increase increase
Figure 3 shows the percent change in state total tax revenues in FY 2020, and Figure 4 shows the percent
change in state general sales tax revenues in FY 2020, based on data collected by the Urban Institute.3 Our
revenue information largely confirms our survey results. Overall, 29 states reported declines in total state tax
revenues and 13 reported declines in sales tax revenues in FY 2020 compared with FY 2019. States generally
dependent on oil (e.g., Alaska and Wyoming) had the largest declines in overall state tax revenue collections
because of their dependance on severance taxes. Further, states with high dependance on sales taxes (e.g.,
Florida and Texas) and high dependance on tourism, leisure, and hospitality industries (e.g., Hawaii and Nevada)
also saw steep declines in overall and sales tax revenue collections.
T A X P O L I C Y C E NT E R | U RB AN IN ST I T U T E & B RO O K I N G S IN ST I T U TI O N 6FIGURE 3
State Total Tax Revenues in FY 2020
Compared with FY 2019
Year-over-year percent change in total tax revenues
ID
WA
NY
TN
SC
SD
NM
AL
VT
ME
CO
VA
KY
MD
WI
RI
IA
NE
MI
CA
MA
GA
OH
NJ
US -1.0%
DE
MT
CT
AZ
MN
MS
AR
TX
LA
NC
IL
UT
NH
NV
WV
FL
HI
IN
KS
MO
PA
OK
OR
WY
AK
-45% -40% -35% -30% -25% -20% -15% -10% -5% 0% 5% 10%
Source: State and Local Finance Initiative, Urban Institute.
T A X P O L I C Y C E NT E R | U RB AN IN ST I T U T E & B RO O K I N G S IN ST I T U TI O N 7FIGURE 4
State Sales Tax Revenues in FY 2020
Compared with FY 2019
Year-over-year percent change in sales tax revenues
NE
NM
UT
AZ
ID
AL
VT
SD
IA
NY
RI
VA
ME
KY
AR
SC
TN
WI
KS
MO
OH
IN
MI
MS
WA
WV
NC
US 0.4%
TX
CT
CO
MA
MN
GA
NV
NJ
IL
CA
PA
FL
HI
MD
OK
LA
WY
-8% -3% 2% 7% 12%
Source: State and Local Finance Initiative, Urban Institute.
T A X P O L I C Y C E NT E R | U RB AN IN ST I T U T E & B RO O K I N G S IN ST I T U TI O N 8STATE REVENUE FORECASTS
Key takeaway: Most states are optimistic about the current fiscal environment, but some states face difficult
budgetary challenges.
It was extremely hard for states to forecast revenues given the unprecedented nature of the public health crisis,
the widespread stay-at-home mandates, the steep increases in unemployment claims, and the steep declines in
state revenues. Most states immediately revised forecasts downward and thought revenue declines would be
dramatic and relatively long-lasting, a stark difference from the solid revenue growth predicted at the beginning
of the year.
These bleak forecasts were universal: Not only did states overestimate revenue shortfalls, but so did
independent organizations.
In June 2020, the Tax Policy Center extrapolated from revised state revenue forecasts and projected state
government revenue losses reaching $125 billion in FY 2021.4 In July 2020, the Tax Foundation estimated state
government revenue losses would reach $118 billion in FY 2021.5 In September 2020, Moody’s released revised
forecasts and projected that state governments would see revenue shortfalls of almost $100 billion for FY 2021.6
Other organizations, such as the Center for Budget and Policy Priorities and the National Council on State
Legislatures, also projected steep revenue losses for state governments for FY 2021.
The overestimation of revenue losses by state governments as well as by independent organizations
highlights the unusual nature of the COVID-19 recession and the uncertainties the pandemic presented for state
budgets. But state revenue losses would had been far steeper absent federal government policies and stimulus
support. More than a year into the pandemic, we know that its impact on state revenues was not as strong as
initially feared for many states. This turned out to be related to stronger income tax revenues, which were
bolstered in part by the federal assistance under the Coronavirus Aid, Relief, and Economic Security Act (CARES
Act) signed into law in March 2020. That package provided $2 trillion in aid, of which around $200 billion went
to state and local governments.7
We asked state officials how they would describe the current total tax and general or excise sales tax for
their respective states. Officials in 25 states were either optimistic or very optimistic, while officials in 9 states
were neutral. Officials in six states described the overall revenue picture as pessimistic, and officials in four
states indicated pessimism about general sales tax revenues specifically (Figure 5). This a reminder that
although the pandemic did not have a devastating impact on most states, states that rely heavily on the
tourism, leisure and hospitality industries are still in a precarious situation.
Despite widespread optimism about the current revenue picture, some states are anticipating revenue
shortfalls for FY 2021. Among the states with general sales tax revenues, officials in 14 states expect declines in
overall tax revenues for FY 2021, while 27 states expect growth. Further, 11 states are anticipating declines in
T A X P O L I C Y C E NT E R | U RB AN IN ST I T U T E & B RO O K I N G S IN ST I T U TI O N 9general sales tax revenues and 2 states are expecting declines in excise tax revenues for FY 2021 (Figure 6). The
states expecting declines in general sales or excise tax revenues for FY2021 do not necessarily expect declines
in overall tax revenues as well.
FIGURE 5
States’ Current Total and Sales Tax
Revenue Picture
Number of states
27
24 Total tax revenues General sales tax Excise tax
24 22
21
18
15
12
9
9
6 6
6 4 4 4 4
3
3 1 1
0
Very optimistic Optimistic Neutral Pessimistic Very Don't know,
pessimistic hard to say
T A X P O L I C Y C E NT E R | U RB AN IN ST I T U T E & B RO O K I N G S IN ST I T U TI O N 10FIGURE 6
State Revenue Forecasts for FY 2021 Compared
with FY 2020
Number of states
Total tax revenues General sales tax Excise tax
18
15
15
13
12
10
9
9
7 7 7
6
4
3
3 2 2 2 2
1 1 1 1 1
0
> 10% 5-10% 0-5% No change 0-5% increase 5-10% > 10% Don't know
decrease decrease decrease increase increase
Figure 7 shows actual revenue growth for FY 2019 and FY 2020 as well as revenue forecasts for FY 2021 and
FY 2022 for state total revenues and revenues from major sources, based on data collected by the Urban
Institute. States have seen solid growth in all major sources of tax revenues as well as in overall tax revenues in
FY 2019. The complex trajectory of the pandemic and federal and state responses to it had an impact on state
revenue collections in FY 2020. Most states reported declines in personal income and corporate income tax
revenues largely because of the postponed income tax due date, which shifted income tax revenues from one
fiscal year to another. Overall, most states are anticipating growth in overall state tax revenues in both FY 2021
and FY 2022 (Figure 7), though part of the growth in FY 2021 can be attributed to the shifting of 2019 income
tax payments into FY 2021.
T A X P O L I C Y C E NT E R | U RB AN IN ST I T U T E & B RO O K I N G S IN ST I T U TI O N 11FIGURE 7
State Actual Revenue Growth for FYs 2019 and 2020
and Revenue Forecasts for FYs 2021 and 2022
Year-over-year percent change
25% 23%
Personal income tax Corporate income tax
General sales tax Total revenues
20%
15%
15%
10%
10%
6%
5% 5%
5% 4% 4%
3%
1% 2%
0%
0%
0% -1%
-5%
-5% -5%
-10%
FY 2018-19 FY 2019-20 FY 2020-21 FY 2021-22
actual actual forecast forecast
Source: State and Local Finance Initiative, Urban Institute.
State revenue forecasts indicate that 18 states are anticipating declines in FY 2021, while 31 states are
anticipating growth (Figure 8). Alaska is anticipating the largest growth in overall tax revenues, largely because
of extreme declines in revenues in FY 2020. (Alaska’s state tax revenues had declined 42 percent in FY 2020.)
Wyoming and New Mexico are forecasting the steepest revenue declines for FY 2021; like Alaska, they both
have high reliance on severance taxes.
T A X P O L I C Y C E NT E R | U RB AN IN ST I T U T E & B RO O K I N G S IN ST I T U TI O N 12FIGURE 8
State Total Revenue Forecasts for FY 2021
Compared with FY 2020
Year-over-year percent change in total tax revenue forecasts
AK
OR
CA
UT
PA
DE
NC
IN
AZ
MO
KS
CO
SD
FL
IL
NE
NH
US 6%
CT
ID
WA
OK
MN
WI
MD
OH
IA
WV
VA
KY
VT
AL
RI
TN
AR
NY
NV
MS
GA
HI
MT
TX
LA
SC
MI
NJ
MA
ME
NM
WY
-20% -15% -10% -5% 0% 5% 10% 15% 20% 25% 30% 35% 40% 45% 50%
Source: State and Local Finance Initiative, Urban Institute.
Figure 9 shows state sales tax revenue forecasts for FY 2021. Eleven states are anticipating declines in sales
tax revenues in FY 2021, while 33 states are anticipating growth.
We have compared states’ most recent revenue forecasts for FY 2021 with the forecast estimates provided
by survey respondents. There are some noticeable variations, likely caused by the timing of official revenue
forecasts versus the timing of survey responses.
T A X P O L I C Y C E NT E R | U RB AN IN ST I T U T E & B RO O K I N G S IN ST I T U TI O N 13FIGURE 9
State Sales Tax Revenue Forecasts for
FY 2021 Compared with FY 2020
Year-over-year percent change in sales tax revenue forecasts
PA
VT
NC
CA
ID
NJ
SD
CT
AZ
IL
CO
UT
IN
FL
KY
RI
KS
OK
OH
IA
TN
NE
MI
MD
US 3%
SC
WV
MA
AL
WA
MN
WI
AR
GA
MO
TX
LA
NV
VA
ME
WY
MS
NY
HI
NM
-20% -15% -10% -5% 0% 5% 10% 15%
Source: State and Local Finance Initiative, Urban Institute.
T A X P O L I C Y C E NT E R | U RB AN IN ST I T U T E & B RO O K I N G S IN ST I T U TI O N 14STATE SALES TAX REFORM PLANS FOR FY 2022
Key takeaways:
• Most states are not planning to expand general or excise sales tax bases to include more goods or
services, in part because of the current more positive fiscal environment.
• A few states are considering cutting general sales tax rates, but others are interested in expanding
specific excise taxes, most notably legalizing and taxing the recreational use of marijuana.
We asked the respondents to indicate what policy options they were considering for fiscal year 2022. Because
many states were in the middle of their legislative sessions when policymakers responded to our survey, many
were unable to respond with actual fiscal policy changes in their FY 2022 budgets. In fact, officials in 13 states
did not answer this question.
Among the remaining states, officials in 17 states indicated a single policy change, and officials in 14 states
indicated several expected policy measure changes. Results in actual budgets will likely differ given the
subsequent passage of ARPA and increased federal assistance.
Figure 10 summarizes fiscal policy changes that states were considering. Very few states indicated
discussions to increase rates or modify structures for income and sales taxes. We find that in general, the states
that indicated legislative deliberations to change income and sales tax rates and structures were also the states
that had been more severely affected by the pandemic. Further, these states had all responded to the survey
questionnaire before the ARPA was passed. Respondents in 13 states indicated using rainy-day funds, while
respondents in 7 mentioned issuing new debt.
T A X P O L I C Y C E NT E R | U RB AN IN ST I T U T E & B RO O K I N G S IN ST I T U TI O N 15FIGURE 10
Most States Are Reluctant to Raise Tax Rates
States' budget considerations for FY 2022
Increase personal income tax rates 6
Increase corporate income tax rates 6
Increase general sales tax rates 3
Increase excise tax rates 6
Introduce taxes on wealth 3
Use rainy day funds 13
Borrow from other state funds 2
Issue new debt 7
Other 13
No answer 13
0 3 6 9 12 15
Number of states
Respondents in 13 states indicated some other measures as part of budget consideration for fiscal year
2022. Those measures include:
◼ expanding gaming,
◼ taxing e-cigarettes,
◼ increasing the gas tax,
◼ repealing tax expenditures,
◼ passing a one-time tax reduction,
◼ cutting tax rates,
◼ reducing spending,
◼ using federal funds rather than general funds where appropriate,
◼ introducing a tax on capital gains (discussed in a state with no income tax, this would be similar to
the taxes on investment income in New Hampshire and (until recently) in Tennessee, and
◼ modifying personal and corporate income tax structure to limit credits and deductions for higher-
income individuals.
T A X P O L I C Y C E NT E R | U RB AN IN ST I T U T E & B RO O K I N G S IN ST I T U TI O N 16Before the pandemic, one of the challenges for states was the growing share of spending on services and
the decline in the share of spending on goods (Figure 11). Spending on services rather than on goods translates
into less sales tax revenues for states as many services remain untaxed and are hard to tax for political,
administrative, or legal reasons. In 41 of the 45 states with a general sales tax, services are not in the tax base
by default, and each state chooses which services to include. In contrast, Hawaii, South Dakota, New Mexico,
and West Virginia include all services in their base by default but exempt specific services. 8
FIGURE 11
Sales Tax Base: Spending on Services versus Goods
Goods and services as share of personal consumption expenditures
80%
Durable goods Nondurable goods Services Goods
70%
60%
50%
40%
30%
20%
10%
0%
Source: U.S. Bureau of Economic Analysis, NIPA Table 2.3.5.
Further, changing economic activity also led to more goods being bought online from remote sellers or
through electronic means, which further eroded sales tax bases. This has led some states to consider reforms to
include more services in their base9 or to modernize their sales tax in other ways. After the South Dakota v.
Wayfair, Inc. decision,10 which gave states broad authority to require out-of-state sellers to collect sales tax, all
states have passed legislation to regulate online sales taxation, which has increased sales tax revenues
(especially during the pandemic). Florida and Missouri passed legislation only this year, but for the other states
with a general sales tax, the taxation of online purchases helped sustain sales tax revenues as consumers shifted
spending patterns to avoid in-person contact.
Consumption patterns also changed, with individuals this year spending a larger share of their budgets on
goods rather than services than in prior years. This is in part because many services related to entertainment
and travel have been curtailed by government mandates. This is likely a one-time shift rather than a change in
trend, and many states will continue facing the erosion of their sales tax base.
Many states have observed shifts in consumer spending during the pandemic. We asked state officials to
indicate whether they were considering any policy changes related to the taxation of goods versus services
because of changes in consumer behavior. Most states either did not respond or indicated no deliberations
T A X P O L I C Y C E NT E R | U RB AN IN ST I T U T E & B RO O K I N G S IN ST I T U TI O N 17were underway. A few states indicated that some policy discussions were in progress, but changes were not
adopted by the legislature. Officials in four states indicated policy debates on taxing digital goods and digital
subscriptions or streaming services because of how widespread such goods and services have become (Figure
12).
FIGURE 12
Most States Not Planning to Expand Sales Tax Base
to New Goods and Services
Number of states
40
37
35 35 Expanding general sales tax base to additional goods
35 Expanding excise tax base to additional goods
Expanding sales tax base to new services
30
25
20
15
10
6
4 4 4 4
5
1 1 1
0
No Yes N/A No reponse
We asked state officials if they were considering expanding the general or excise sales tax bases to include
additional goods, repealing existing exemptions of sales taxes, taxing new services. Not surprisingly, given
more positive fiscal conditions, most states indicated no plans to expand their sales tax bases to new goods or
services (Figure 12). Only four states indicated plans to expand general sales tax bases, and those states
indicated plans to repeal existing exemptions, including exemptions on clothing and candy. Six states indicated
plans to expand their excise sales tax bases. Those states indicated expansion to items such as wine, electronic
cigarettes, and recreational marijuana. Moreover, four states indicated plans to expand the sales tax base to
new services, mostly sales taxes on digital streaming and subscription services.
Although the COVID-19 pandemic posed a financial threat to all states, those where leisure and hospitality
are critical industries and that rely heavily on sales tax revenues (and less on income taxes), were particularly
vulnerable. For example, sales taxes represent 60 percent or more of revenues in Florida and Texas. The top six
states with the highest reliance on sales tax revenues (Florida, Nevada, South Dakota, Tennessee, Texas, and
Washington) do not have broad-based income taxes.
T A X P O L I C Y C E NT E R | U RB AN IN ST I T U T E & B RO O K I N G S IN ST I T U TI O N 18Further, although the state sales tax base is important, states’ sales tax rates also matter in terms of how
much revenues states collect. Sales tax rates vary by state as well as by locality within a state. Colorado currently
has the lowest state sales tax rate at 2.9 percent (though its’ local rate varies between 0 and 8.3 percent and has
a combined rate that averages 7.65 percent), while California has the highest state sales tax rate of 7.25 percent
(and an average combined rate of 8.66 percent).
We asked respondents if they were planning to enact general sales tax rate changes for FY 2022.
Respondents in 34 of the 40 states that answered our survey and have a general sales tax indicated no plans to
increase or decrease their general sales tax rate; respondents in 4 states indicated they were not sure. Idaho
was the only state to indicate plans to decrease its general sales tax rate for FY 2022 (Figure 13). Notably, Idaho
also saw substantial growth in tax revenues during the pandemic, mostly because of a boom in construction
driven by recent population growth.
We also asked states if they were planning to enact excise tax rate changes for FY 2022. Once again, it
appears states are not planning this: officials in 30 states did not indicate any plans to do so. The one exception
is that legalizing and taxing recreational marijuana is gaining popularity among more states.
State officials in four states, including New York and Wisconsin, indicated plans to implement taxes on
recreational marijuana. Since we conducted the survey, New York has already moved forward and legalized
recreational marijuana. Recreational marijuana is currently legal in 16 states and the District of Columbia, and
more states will likely legalize and tax recreational marijuana in the coming years.
Apart from recreational marijuana, officials in Rhode Island and Washington indicated plans to raise the tax
rate on gasoline, officials in Wisconsin indicated plans to enact tax rate changes for e-cigarettes and cigars, and
officials in Washington indicated plans to enact tax rate changes for sugar-sweetened beverages.
Other excise tax measures mentioned by state officials include decreasing meal and room tax rates and
creating new carbon taxes (Figure 14). In most of these instances, it seems like other nonfiscal considerations
are driving the discussion of new taxes or changing tax rates.
T A X P O L I C Y C E NT E R | U RB AN IN ST I T U T E & B RO O K I N G S IN ST I T U TI O N 19FIGURE 13
Most States Not Planning to Enact General Sales
Tax Rate Changes for FY 2022
Number of states
35 34
30
25
20
15
10
5 4 4
1 1
0
0
Yes, planning to Yes, planning to No plans to Not sure N/A No reponse
increase the rate decrease the rate increase or
decrease the rate
T A X P O L I C Y C E NT E R | U RB AN IN ST I T U T E & B RO O K I N G S IN ST I T U TI O N 20FIGURE 14
Few States Planning to Enact Excise Tax Rate
Changes for FY 2022
Number of states
35
30
30
25
20
15
10
10
5 4
2 2
1 1
0
0
Raise the Raise Raise Introduce Tax Tax sugar- Other None
gas tax cigarette alcohol taxes on vaping sweetened
taxes taxes marijuana beverages
T A X P O L I C Y C E NT E R | U RB AN IN ST I T U T E & B RO O K I N G S IN ST I T U TI O N 21STATES’ CONSUMPTION PATTERNS DURING THE PANDEMIC
Key takeaway: Most states saw growth in consumption of goods and declines in consumption of services .
Early in the pandemic, many states had stay-at-home orders to combat the pandemic. Together with actions
taken by businesses and individuals to minimize their exposure to the virus, these orders had a significant
impact on the decline of sales tax revenues in spring 2020. California Governor Gavin Newsom was the first to
announce a stay-at-home order on March 19th, 2020, and 43 states followed the same policy. But governors in
Arkansas, Iowa, Nebraska, North Dakota, South Dakota, Utah, and Wyoming did not issue such orders.
Georgia’s Governor Brian Kemp was the first to reopen parts of his state’s economy, after 21 days of
lockdowns. By the end of April, 33 states still had stay-at-home orders in place (Figure 15).
FIGURE 15
State Stay-at-Home Order Effective Dates
and Duration during Spring 2020
SC 4/7
MO 4/6
AL 4/4
GA 4/3
MS 4/3
FL 4/3
TN 4/2
TX 4/2
ME 4/2
PA 4/1
NV 4/1
DC 4/1
AZ 3/31
KS 3/30
NC 3/30
VA 3/30
MD 3/30
AK 3/28
MT 3/28
MN 3/28
NH 3/28
RI 3/28
CO 3/26
WA 3/26
KY 3/26
OK 3/26
VT 3/25
WI 3/25
ID 3/25
IN 3/25
HI 3/25
WV 3/24
OH 3/24
MI 3/24
NM 3/24
MA 3/24
DE 3/24
OR 3/23
LA 3/23
CT 3/23
NY 3/22
IL 3/21
NJ 3/21
CA 3/19
4/2
4/7
5/2
5/7
6/1
3/13
3/18
3/23
3/28
4/12
4/17
4/22
4/27
5/12
5/17
5/22
5/27
Statewide stay-at-home mandate effective dates
Note: Labels indicate stay-at-home order effective dates and number of days in effect.
T A X P O L I C Y C E NT E R | U RB AN IN ST I T U T E & B RO O K I N G S IN ST I T U TI O N 22Some states went through subsequent lockdowns, and many consumers voluntarily restricted their regular
activities, such as dining out or shopping at malls, to reduce the risk of contracting or spreading the virus.
The virus-induced recession brought significant changes to consumer spending behavior, including changes
to what is purchased and where and how it is bought. In the beginning of the pandemic, many consumers were
panic-purchasing grocery food and personal care products, and retailers were forced to limit the number of
purchases for high-demand items. However, the panic subsided quickly as consumers realized there would be
no shortage of products. Still, spending for some categories shifted considerably.
We asked states to indicate if they have seen any shifts in consumption of goods and services and,
therefore, in sales tax revenue collections during the pandemic for various spending categories. Some
respondents to our survey questionnaire were not able to answer the questions. Respondents in 31 states
indicated declines in spending on gasoline and other energy goods, which was expected as a large share of the
workforce switched to remote work and spent less on gasoline due to limited travel. (Spending on gasoline and
other energy goods also declined due to steep drops in gas prices). Similarly, many consumers also spent less
on clothing and footwear during the pandemic. On the other hand, survey respondents in 21 states indicated
that spending on furnishings and household equipment increased during the pandemic (Figure 16).
FIGURE 16
Remote Work and State Lockdowns Changed
Consumer Spending Patterns
Number of states
40
Clothing & footwear Gasoline & other energy goods Furnishings & household equipment
35
31
30
25
21
20
17
15 13 13
10 8
5
4 4
5
2
1 1
0
Increased Decreased No notable changes Not sure Fully or partially
exempt
T A X P O L I C Y C E NT E R | U RB AN IN ST I T U T E & B RO O K I N G S IN ST I T U TI O N 23The survey responses are consistent with the actual spending patterns observed for the nation. Analysis of data
from the US Bureau of Economic Analysis indicates spending both on apparel and energy goods declined
steeply during the pandemic, while spending on furnishings increased substantially (Figure 17).
FIGURE 17
Consumption Spending before and during the Pandemic
Year-over-year percent change
40%
Clothing & footwear
30% Gasoline & other energy goods
Furnishings & household equipment
20%
10%
0%
-10%
-20%
-30%
-40%
-50%
Source: US Bureau of Economic Analysis, National Income and Product Accounts Table 2.3.5.
We also asked states to indicate if they saw any shifts in spending on food, accommodation, auto sales, and
building materials. Many states indicated an increase in spending on goods such as auto and building materials
and a decrease in spending on services such as accommodation (Figure 18). Respondents in 35 states indicated
declines in spending on accommodation. Spending on accommodation was hit hard because the pandemic
caused a reduction in travel and general tourist activity, which led to lower sales tax collections from
accommodation (typically hotel rooms).
The pandemic hit the leisure and hospitality industries especially hard because of restrictions on travel,
cancellations of events, and shutdowns of restaurants and bars. Employment in the leisure and hospitality
industries declined nearly 40 percent between April 2020 and June 2020 compared with a year earlier. Even as
vaccinations have become more available, employment in the leisure and hospitality industries remains
depressed across all states, and a full recovery in these sectors will likely take time. This is particularly
troublesome for state’s whose economies rely heavily on leisure and hospitality as well as tourism, such as
Hawaii and Nevada.
Respondents in 29 states indicated growth in spending on building materials and lawn and garden supplies.
Over the past year the US housing market has boomed even as the pandemic-induced recession left millions of
T A X P O L I C Y C E NT E R | U RB AN IN ST I T U T E & B RO O K I N G S IN ST I T U TI O N 24Americans out of work. Record-low mortgage rates and more time spent at home sparked the demand for new
or bigger housing, in part leading to a push for new construction (after initial suspension of work) and to
bidding wars. Home prices have soared, and the strong growth in home sales contributed to growth in
spending on building materials and lawn- and garden-related items.
FIGURE 18
Consumers Spent More on Goods and Less on
Services during the Pandemic
Number of state official responses
45
Food & beverage Accommodation Auto sales & other automotive Building materials, lawn, garden
40
35
35
29
30
25
21
20
15 13
11 10 10
10 8 7
4 5 5
5
1 1
0
Increased Decreased No notable changes Not sure Fully or partially
exempt
Twenty-one of 44 states that responded to our survey indicated that spending on auto sales and other
automotive items has increased. Initially, sales of new vehicles collapsed as auto plants were shuttered during
the first phase of the pandemic, resulting in a shortage of new vehicles. Even though far fewer people were
commuting to work, retail auto sales to consumers rebounded faster than expected. Forecasts for auto sales
were also initially bleak, and the rebound is a clear indication that forecasting consumer behavioral change is
not easy. Demand for automobiles could be related in part to an increased reluctance to use mass transit for
fear of exposure to the virus.
We also asked states to indicate the trends in spending on food and beverages (both grocery stores and
restaurants) during the past year. Even though people stockpiled groceries in the beginning of the pandemic,
that panic shopping subsided very quickly. Respondents in 11 states indicated declines in spending on food and
beverages, while respondents in eight states indicated growth. The divergence in responses is largely because
of different state lockdown policies and regulations related to restaurant and bar operations during the
pandemic.
T A X P O L I C Y C E NT E R | U RB AN IN ST I T U T E & B RO O K I N G S IN ST I T U TI O N 25STATES’ ONLINE SALES TRANSACTIONS AND TAXATION
Key takeaways:
• Most states collect sales tax revenues on interstate online sales transactions but have incomplete details
on online spending patterns.
• About half of respondents reported tracking online sales tax revenue collections separately. However,
although states are able to separately track transactions from out-of-state vendors with no physical in-
state presence, many are unable to separate online sales from in-person sales for businesses with
physical nexus in their state.
• It appears only a few states plan to make revisions related to online sales taxation, such as rules,
regulations, procedures, sales tax collections reporting, or auditing.
• Only a few states indicate having invested in technology solutions to support online sales taxation in the
past three years, and even fewer states plan to invest in the next three years.
The Wayfair ruling and states’ subsequent enactment of laws to tax online sales transactions helped states
considerably during the COVID-19 pandemic and recession.
Before June 21, 2018, states were banned from imposing sales tax on internet sales unless the given retailer
had a physical presence in the taxing state. That all changed when the US Supreme Court overruled the physical
presence rule and paved the way for states to tax remote sales and have sellers collect and remit the revenue.11
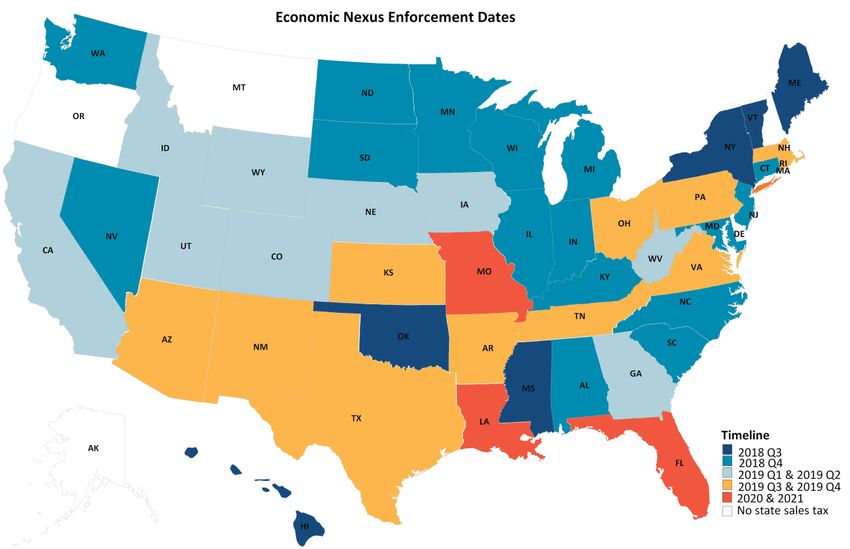
Many states rushed to enact legislation to tax online sales shortly after the Supreme Court’s ruling. Figure
19 shows the timeline of online sales taxation legislations across the states. By the end of 2019, all states with
broad-based sales taxes except Florida, Louisiana, and Missouri had enacted legislation to tax remote sellers.
These laws typically required a minimal level of transactions or sales within a state to establish nexus or make
the retailer liable for the tax.
States implemented two sets of laws over the next few years: remote seller laws, which render retailers
responsible for collecting and remitting sales tax, and marketplace facilitator laws, which deem that all sales in a
marketplace count toward the minimum requirement for payment. Before the pandemic, many critics thought
that states had rushed to enact legislation without careful assessment of enforcement mechanisms, thresholds,
and retroactivity requirements. Indeed, many states faced unintended challenges after introduction of various
dollar-value and transaction-value thresholds, and some states ended up revising their thresholds.
But quick enactment of legislation in most states turned out to be extremely fortuitous because many
consumers accelerated online purchases with the onset of the pandemic. States have been benefiting from even
imperfect laws that require retailers to remit sales taxes on online transactions. Questions remain about how
sales taxes are calculated and if they are based on where the sale originates or where the goods are delivered.
Further, there can be differences in what goods are taxable at the local level.
T A X P O L I C Y C E NT E R | U RB AN IN ST I T U T E & B RO O K I N G S IN ST I T U TI O N 26FIGURE 19
Most States Were Fast to Adopt Online
Sales Taxation Legislation
While state and local governments continue sorting out the rules and regulations for online sales taxation,
the pandemic accelerated online sales purchases. E-commerce accounted for 15.7 percent of total retail sales in
the second quarter of 2020, a 4.2 percentage-point increase compared with the first quarter of 2020. E-
commerce as a share of total retail sales has ticked downward in the second half of 2020 but remained
noticeably higher than its pre-pandemic share (Figure 20). Just a decade ago, e-commerce sales accounted for
only 5 percent of total retail sales. That share has now nearly tripled and is likely to remain high or grow over
time (even if it declines in the near term) as more consumers become accustomed to online shopping.
In the second quarter of 2020, which was the height of the pandemic’s first wave, consumers spent $204
billion online, or 43.8 percent more than during the same quarter in 2019. This contrasts with a 3.6 percent
year-over-year decline in total retail sales in the second quarter of 2020. Year-over-year growth in online
spending was also at or above 32 percent during the second half of 2020 and in the first quarter of 2021. By
comparison, year-over-year growth in total retail sales was 7 percent both in the second and third quarters of
2020 and 16.8 percent in the first quarter of 2021 (Figure 21).
T A X P O L I C Y C E NT E R | U RB AN IN ST I T U T E & B RO O K I N G S IN ST I T U TI O N 27FIGURE 20
The Pandemic Turbocharged e-Commerce Sales
E-commerce sales as share of total retail sales
16%
14%
12%
10%
8%
6%
4%
2%
0%
Source: US Census Bureau, quarterly e-commerce report.
FIGURE 21
Nominal growth in E-Commerce Sales versus
Retail Sales during the Pandemic
Year-over-year percent change
50%
Total retail sales E-commerce sales
40%
30%
20%
10%
0%
-10%
-20%
Source: US Census Bureau, quarterly e-commerce report.
T A X P O L I C Y C E NT E R | U RB AN IN ST I T U T E & B RO O K I N G S IN ST I T U TI O N 28We asked several questions about these trends to evaluate the impact of the pandemic on online sales, the
current state of online sales taxation mechanisms across states, the challenges of online sales taxation, states’
plans related to online sales taxation administration, and states’ past and planned investments in technology
solutions to support online sales taxation. Answering these questions turned out to be more complicated than
originally anticipated. Because some online sales had already been subject to sales tax collection even before
the Wayfair decision (because those retailers had a physical presence in the taxing state), states cannot always
distinguish between online and in-person sales based on tax remittances and information filed by retailers.
Below we summarize our survey findings.
We asked states that have a general sales tax to indicate the challenges for tracking online versus in-person
transactions separately. Officials in 11 states did not provide any response, while officials in 27 states provided
answers that are common in most cases. Among the respondents, only one state indicated no challenges in
collecting information on taxes from online versus in-person transactions separately. Open-ended responses
from the rest of the 26 respondents indicated three common challenges:
1. States are generally able to track sales taxes from remote sales but not necessarily from all online sales.
In other words, online sales from businesses that also include physical nexus in the given state are not
always tracked separately, whereas remote sales from out-of-state vendors without a physical presence
but with economic nexus in the given state are tracked separately.
2. Sales tax forms in some states do not differentiate between in-person versus online businesses, so
businesses with both components are only required to fill out one sales tax return and report the total
aggregate amount of taxable sales.
3. Some states are able to track online sales from newly registered companies following the Wayfair
decision and Marketplace Facilitator collection provisions but cannot track sales from companies that
had been registered before the decision.
For example, officials in Maryland indicated some online sales tax revenue in the state is tracked separately
because it is dedicated to education funding per rules that were part of the legislation expanding online sales
tax collection. But it is not possible to track all online sales tax receipts because companies with brick-and-
mortar stores within the state commingle their in-store and online remittances. Officials in Wisconsin indicated
that the state’s Department of Revenue established a system to estimate sales tax collections resulting from the
Wayfair decision and from online marketplaces. However, these are estimates based on new filers before and
after the passage of the state’s Wayfair-related and marketplace facilitator taxation laws.
We asked states to indicate the share of taxable sales transactions conducted online before and during the
pandemic. A large majority of survey respondents did not answer this question, with many indicating they were
unable to answer because of a lack of information.
T A X P O L I C Y C E NT E R | U RB AN IN ST I T U T E & B RO O K I N G S IN ST I T U TI O N 29Among the states that were able to respond, eight states indicated no change in the share of taxable sales
transactions conducted online before versus during the pandemic; five states indicated an increase. California is
one of the five states that indicated boosts (Figure 22).
FIGURE 22
Share of Taxable Transactions Conducted Online
during the Pandemic
Number of states
30
Prior to the pandemic During the pandemic 27
26
25
20
15
10 8
6 6
5 3 3
1
0
Less than 10% 10%-20% 20%-30% 30%-40% Don't know
We wanted to evaluate whether states are collecting taxes on interstate online purchases, and if they do so,
whether those taxes are from direct sales only or both direct sales and through online marketplaces.
Respondents in 36 states indicated that they collect taxes both for direct sales and through marketplaces, while
respondents in 2 states indicated that they collect taxes from direct sales only. Five states indicated that they do
not collect taxes from interstate online purchases, and a respondent in one state was unsure. These are mostly
the states that have no statewide sales tax (Figure 23).
Before the pandemic, all states with a general sales tax except Florida, Louisiana, and Missouri had
implemented laws and regulations to collect sales tax revenues from online purchases. As noted, states’ ability
to tax online sales transactions helped support state revenues. The pandemic and the renewed importance of e-
commerce led all three states without legislation in place to pass such laws. Louisiana’s law requiring remote
seller and marketplace facilitators to remit sales tax went into effect on July 1, 2020. 12 Florida’s governor signed
an economic nexus and marketplace facilitator bill on April 19, 2021, with an enforcement date of July 1, 2021. 13
After long deliberations, lawmakers in Missouri voted for a “Wayfair tax” bill on May 14, 2021, that requires out-
of-state online vendors to collect sales taxes. The governor of Missouri, who emphasized the importance of the
T A X P O L I C Y C E NT E R | U RB AN IN ST I T U T E & B RO O K I N G S IN ST I T U TI O N 30Wayfair tax in his 2021 State of the State address,14 signed the bill into law on June 30, 2021. Missouri is the
final state among the 45 states with broad-based sales taxes to pass legislation for online sales taxation.
FIGURE 23
Number of States Collecting Taxes on Interstate
Online Purchases
Number of states
40
36
35
30
25
20
15
10
5
5 2 1
0
Yes, on direct sales and Yes, but only on direct sales No Not sure
through online
marketplaces
Since e-commerce is increasingly playing an important role in states’ economies, it could be crucial for
states to monitor and assess sales tax collections from online purchases to ensure that businesses are compliant
with rules and regulations. This might not be necessary if rules and sales subject to tax or exemptions are the
same, but often sale minimums can vary. Respondents in 18 states indicated that they track e-commerce
separately while another 18 states indicated they do not. Respondents in an additional 4 states indicated that
they were unsure (Figure 24). From the open-ended questions in our survey, it appears that even in those states
that indicated tracking sales tax collections from online purchases separately, they are only talking about
remote sales, and are not necessarily able to track within state on-line purchases separately from in-person
sales.
We asked states if it would be useful to collect information on sales taxes separately for online versus in-
person transactions. Officials in 14 states said that they are already tracking taxes by type of sale and find it
useful, officials in 10 believe it would be useful to collect this information, officials in 15 states indicated either
that they were not sure it would be useful or that they thought it was not possible to do so, and one official
indicated it would not be useful to collect this information separately (Figure 25).
T A X P O L I C Y C E NT E R | U RB AN IN ST I T U T E & B RO O K I N G S IN ST I T U TI O N 31FIGURE 24
States’ Ability to Track Sales Tax Collections from
Online Purchases Separately from In-Person Purchases
Number of states
20
18 18
15
10
5 4
0
Yes No Not sure
T A X P O L I C Y C E NT E R | U RB AN IN ST I T U T E & B RO O K I N G S IN ST I T U TI O N 32FIGURE 25
State Support for Having Separate Information for
Online Sales Taxes
Number of states
20
15
15 14
10
10
5
1
0
Yes, we already do this Yes, we would like to do it No Not sure/not doable
in the future
States were asked to indicate whether they were considering any revisions related to online sales taxation,
namely related to rules, regulation, procedures, audits, and reporting. Very few states indicated plans to make
any changes. Respondents in 20 states indicated no such plans, while respondents in another 16 states either
did not respond to the question or explicitly indicated that they were not sure about such plans (Figure 26).
T A X P O L I C Y C E NT E R | U RB AN IN ST I T U T E & B RO O K I N G S IN ST I T U TI O N 33FIGURE 26
State Plans to Revise Online Sales Taxation
Number of states
20
20
16
15
10
5
3 3
2
1
0
0
Revisions in Revisions in Revisions in Revisions in Revisions in No Don't know/not
rules regulations procedures audits online sales tax sure
collections
reporting
The technology needed to collect or monitor online sales could be very different than what is needed for
brick-and-mortar stores. We asked respondents about whether their state had invested in technological
solutions for handling online sales in the past three years or whether they were planning to invest in the next
three years. Only 10 states indicated investing in technology solutions in the past three years. Among these 10
states, respondents in only 2 mentioned plans to invest in more technology solutions in the next three years,
respondents in another 2 mentioned no such plans, and respondents in the remaining 6 were not sure if their
states would make further investments. Respondents in 16 states indicated that they had not made any
investments in technology solutions in the past three years. Respondents in 13 of these 16 states also indicated
no plans to invest in technology solutions in the next three years, while respondents in the other 3 were not sure
of any forthcoming plans to invest in technology solutions (Figure 27).
T A X P O L I C Y C E NT E R | U RB AN IN ST I T U T E & B RO O K I N G S IN ST I T U TI O N 34You can also read