Review of Sustainability Measures for Hoki (HOK 1) for 2021/22
←
→
Page content transcription
If your browser does not render page correctly, please read the page content below
Review of Sustainability Measures
for Hoki (HOK 1) for 2021/22

Fisheries NZ Discussion Paper No: 2021/04

ISBN No: 978-1-99-100393-5 (online)
ISSN No: 2624-0165 (online)

June 2021
Disclaimer
While every effort has been made to ensure the information in this publication is accurate, Fisheries
New Zealand does not accept any responsibility or liability for error of fact, omission, interpretation or
opinion that may be present, nor for the consequences of any decisions based on this information.

© Crown Copyright – Fisheries New Zealand
Contents Page
1 Stock being reviewed 1
2 Summary 1
3 About the stock 2
3.1 Biology 2
3.2 Fishery characteristics 3
4 Quota Management System 5
5 Legal basis for managing fisheries in New Zealand 5
6 Treaty of Waitangi obligations 5
6.1 Input and participation of tangata whenua 5
6.2 Kaitiakitanga 6
7 Relevant plans, strategies, statements and context 6
7.1 National Fisheries Plan for Deepwater and Middle-depths Fisheries 6
7.2 Regional Plans 6
7.3 Te Mana o te Taiao (Aotearoa New Zealand Biodiversity Strategy) 7
8. Catch information and current settings within the TAC 7
8.1 Commercial 7
8.2 Other mortality caused by fishing 8
8.3 Customary Māori 8
8.4 Recreational 8
9 Status of the stock 8
9.1 Western stock 9
9.2 Eastern stock 9
10 Current and proposed TAC, TACC and allowance settings 9
10.1 Option 1 - (Status quo) 10
10.2 Option 2 - (Modified status quo) 10
10.3 Option 3 - (West 5,000) 10
10.4 Option 4 - (West 10,000, East 5,000) 10
10.5 Option 5 - (West 10,000) 11
11 Environmental interactions 11
11.1 Marine mammals 12
11.2 Seabirds 12
11.3 Fish bycatch 12
11.4 Benthic impacts 13
11.5 Habitats of particular significance 13
12 Uncertainties and risks 15
13 Deemed values 15
14 Questions for submitters on options for varying TACs, TACCs and allowances 16
15 How to get more information and have your say 16
16 Referenced reports 16
i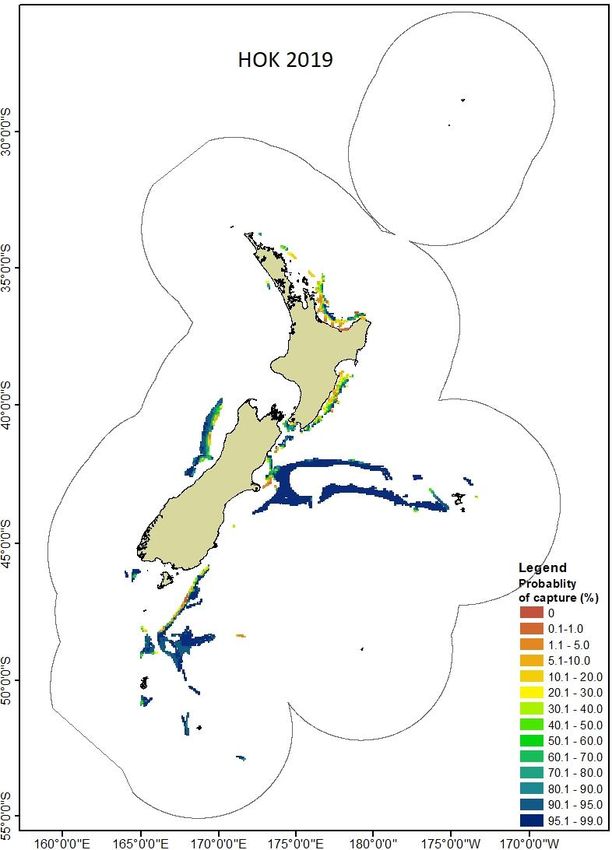
1      Stock being reviewed
Hoki (HOK 1) – all New Zealand (excluding the Kermadec QMA)
Macruronus novaezelandiae, Hoki

                                                                     HOK 10

                                                     HOK 1

Figure 1: Quota Management Areas (QMAs) for hoki, with HOK 1 highlighted and divided into eastern (blue) and
       western (pink) stocks. The black polygons represent the four hoki management areas.

2      Summary
1.     Fisheries New Zealand is reviewing sustainability measures for hoki in Quota Management
       Area HOK 1 for the 1 October 2021 fishing year (Figure 1).

2.     HOK 1 is managed to a target biomass range of 35-50% of the unfished mature biomass (B0).
       Stock status is assessed annually as two separate but interlinked stocks, eastern and western,
       with a separate catch limit set for each stock through a non-regulatory catch split arrangement.

3.     The current HOK 1 Total Allowable Catch (TAC) is 116,190 tonnes, which includes a 115,000
       tonne Total Allowable Commercial Catch (TACC) that is split into 60,000 tonnes for the eastern
       and 55,000 tonnes for the western stock. There are also recreational and customary allowances
       of 20 tonnes each and 1,150 tonnes for all other mortality caused by fishing (equivalent to 10%
       of the TACC).

4.     The 2021 stock assessment assumed two separate stocks (Figure 1) as morphometric and
       ageing studies have found differences between the two main dispersed areas (Chatham Rise
       and the Sub-Antarctic). The biomass of the eastern stock was estimated to be within the
       management target range at 48% B0. The biomass of the western stock was estimated to be at
       the lower threshold of the management target range (35% B0).

5.     Five-year projections assuming catch at the current catch limits estimate that the eastern stock
       biomass will remain within the top third of the management target range. However, the western

Fisheries New Zealand                                          Review of sustainability measures October 2021: HOK 1 • 1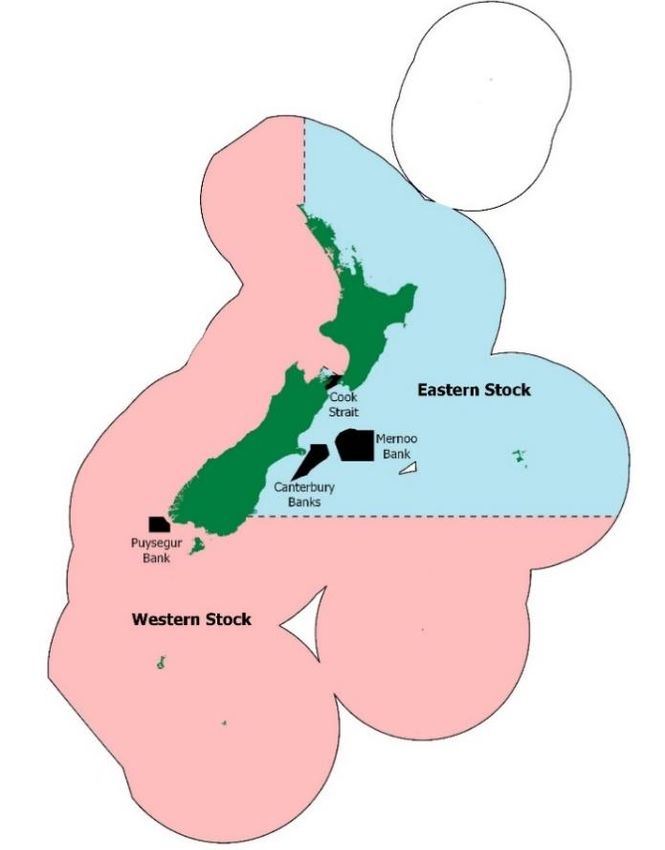
stock biomass is predicted to drop below the management target range next year and remain
below this threshold for the rest of the five-year projection (see Figure 4).
6. Fisheries New Zealand is proposing options to alter the non-regulatory catch split arrangement
for HOK 1, some of these options decrease the HOK 1 TAC and TACC (Table 1).
7. The following options are proposed for HOK 1:
Table 1: Summary of current and proposed catch settings for HOK 1 from 1 October 2021. Figures are all in tonnes
and the numbers within brackets represent the quantum of the change.
Non-regulatory catch
Allowances
split arrangement
Option TAC TACC
Western Eastern Customary All other mortality
Recreational
stock limit stock limit Māori caused by fishing
Option 1
116,190 115,000 55,000 60,000 20 20 1,150
(Status quo)
Option 2
50,000 65,000
(Modified status 116,190 115,000 20 20 1,150
(5,000) (5,000)
quo)
Option 3 111,140 110,000 50,000 1,100
60,000 20 20
(West 5,000) (5,050) (5,000) (5,000) (50)
Option 4
111,140 110,000 45,000 65,000 1,100
(West 10,000, 20 20
(5,050) (5,000) (10,000) (5,000) (50)
East 5,000 )
Option 5 106,090 105,000 45,000 1,050
60,000 20 20
(West 10,000) (10,100) (10,000) (10,000) (100)
8. No changes to the customary or recreational allowances are proposed.
9. Fisheries New Zealand is seeking feedback and submissions on a proposal to alter the non-
regulatory catch split arrangement for HOK 1 with some of the options proposed decreasing the
HOK 1 TAC/TACC.
3 About the stock
3.1 Biology
10. Hoki are widely distributed throughout New Zealand waters from depths of 10 m to over 900 m,
with the greatest abundance between 200-600 m. The largest hoki are generally found deeper
than 400 m whereas juveniles are more abundant in shallower water.
11. Hoki spawn from late June to mid-September, primarily on the west coast of the South Island
(Hokitika Canyon) and in the Cook Strait (Murdoch et al 1990). Spawning has also been found
in the Puysegur area and in Pegasus Canyon. The main grounds for hoki aged 2–4 years are
along the Chatham Rise, in depths of 200 to 600 m. The older fish disperse to deeper water and
are widely distributed in both the Sub-Antarctic and Chatham Rise (Livingston et al 2002).
12. Hoki grow to a maximum size of 130 cm and maximum age of 20-25 years. Hoki are estimated
to reach maturity between 3–5 years of age, however, there is some variation between areas
and sex. The age of the commercial catch also varies among areas, however most fish caught
are estimated to be between 3–12 years old.
13. Morphometric and ageing studies have found consistent differences between adult hoki taken
from the two main dispersed areas (Chatham Rise and the Sub-Antarctic) indicating that there
could be two sub-populations (stocks) of hoki (Livingston and Schofield 1996). No genetic
differences between these stocks have been found to date but work is ongoing to complete
further assessments to confirm whether any genetic differences are present.
2 • Review of sustainability measures October 2021: HOK 1 Fisheries New Zealand14. Hoki primarily predate on lantern fishes, other midwater fishes, squid and decapods (Stevens et
al 2011). Larger hoki (over 80 cm) consume proportionately more fish and squid than smaller
hoki (Connell et al 2010). Hoki are important prey to several species, particularly hake but also
stargazers, smooth skates, several deep-water shark species and ling (Dunn et al 2009).
3.2 Fishery characteristics
Harvest Strategy
15. The hoki stocks are assessed every year (except 2020) and the TAC and TACC for HOK 1 are
set based upon the status of the stock and informed through the use of the hoki harvest
strategy, as set out in the species-specific chapter of the National Deepwater Plan for hoki (Part
1B) and described in Table 2 below.
16. The management target range is based on a Management Strategy Evaluation that aimed to
identify a target range that would ensure managers were able to respond and maintain the stock
above the deterministic estimate of BMSY1 as well as meet objectives for catch rates and fish
size.
Table 2: Hoki reference points and the associated management response.
Harvest strategy components Management response
Management target range of Stock permitted to fluctuate within this management target to an
35 - 50% B0 acceptable level
Soft limit of 20% B0 A formal time constrained rebuilding plan should be implemented if this
limit is reached
Hard limit of 10% B0
The limit below which fisheries should be considered for closure
Rebuild strategy Catch limit set so that fishery will deliver half the rate of rebuild that would
occur in the absence of fishing considered for closure
17. A number of non-regulatory measures are in place for hoki, including an east-west catch split
arrangement and Hoki Operational Procedures.
East West catch split arrangement
18. The HOK 1 TACC is divided between the eastern and western stocks each year via a non-
regulatory catch split arrangement that has been agreed between Fisheries New Zealand and
quota holders. Each catch limit is varied in response to the current estimate of stock status, and
projected impacts of catch levels on each stock. The catch split was first implemented in 2001
and is now formally administered through FishServe and endorsed by the Minister for Oceans
and Fisheries.
19. The ‘western’ stock’ comprises the west coast of the North and South Islands and the area
south of New Zealand including Puysegur, Stewart-Snares shelf and the sub-Antarctic. The
‘eastern’ stock comprises the area of the east coast of the South Island, Mernoo Bank,
Chatham Rise, Cook Strait and the east coast of the North Island up to North Cape (Figure 1).
20. Fishers report east-west catch information directly to FishServe and Fisheries New Zealand has
access to this information. Adherence to the catch split arrangement is also monitored using
electronic reporting and geopositional reporting and is reported on annually by Fisheries New
Zealand.
21. In response to concerns regarding declining catch rates in the west coast hoki fishery, hoki
quota owners shelved 20,000 tonnes (plus any carry forward western stock Annual Catch
Entitlement (ACE)) for the 2018/19 fishing year. This resulted in approximately 30,000 tonnes of
ACE being transferred to a holding account that was not available for balancing against catch in
the 2018/19 fishing year. This created an effective TACC of 130,000 tonnes in 2018/19 fishing
year for HOK 1.
1
Deterministic BMSY for hoki was calculated in 2019 to be 27% B0
Fisheries New Zealand Review of sustainability measures October 2021: HOK 1 • 322. For the current fishing year quota owners have shelved 20,000 tonnes of HOK 1 ACE - 10,000
tonnes from each of the eastern and western stocks creating an effective HOK 1 TACC of
95,000 tonnes for the 2020/21 fishing year.
Hoki Operational Procedures
23. Hoki Operational Procedures are administered by the Deepwater Group Ltd (DWG), which
represents 93% of HOK 1 quota owners. These procedures include Hoki Management Areas
(HMAs) and Hoki Seasonal Spawn Areas (HSSAs).
Hoki Management Areas
24. HMAs are intended to reduce fishing pressure on fish smaller than 55 cm within four areas
where there is relatively high abundance of small hoki. HMAs are in place for the Narrows Basin
in the Cook Strait, Canterbury Banks, Mernoo Bank and Puysegur (Figure 1). Within HMAs,
vessels larger than 28 m have agreed not to target hoki and Fisheries New Zealand monitors
and reports on adherence to this annually.
Hoki Seasonal Spawn Areas
25. HSSAs were added to the Operational Procedures in 2018/19 to reduce fishing pressure on
spawning fish and have applied to the 2019/20 and 2020/21 fishing years (Figure 2). They
consist of short-term (week-long) closures to hoki targeting by all vessels in the main spawning
areas:
• West Coast of the South Island within 25 nautical miles of the coast from 18 to 24 July
(note that vessels larger than 46 metres are already permanently excluded from this
area by regulation)
• West Coast outside of 25 nautical miles from the coast, shallower than 800 metres,
between Kahurangi Point in the north and the boundary between FMAs 5 and 7 in the
south from 25 July to 31 July
• the entire Cook Strait fishery from 1 to 7 August
• designated areas in the Pegasus Canyon from 1 to 7 September.
4 • Review of sustainability measures October 2021: HOK 1 Fisheries New ZealandFigure 2: Hoki Seasonal Spawn Areas for hoki. The West coast inside the line has been shaded to help distinguish it
from West coast outside 25 nm.
4 Quota Management System
26. Hoki was introduced to the Quota Management System (QMS) in 1986. The TAC was last
reviewed for 1 October 2019 when the TAC was reduced from 151,540 tonnes to 116,190
tonnes.
27. For more information about the QMS go to https://www.mpi.govt.nz/law-and-policy/legal-
overviews/fisheries/quota-management-system/.
5 Legal basis for managing fisheries in New Zealand
28. The Fisheries Act 1996 provides the legal basis for managing fisheries in New Zealand,
including the Minister’s responsibilities for setting and varying sustainability measures. See the
separate document Overview of legislative requirements and other considerations at
https://www.mpi.govt.nz/dmsdocument/45235 for more information.
6 Treaty of Waitangi obligations
6.1 Input and participation of tangata whenua
29. Input and participation into the sustainability decision-making process is provided through Iwi
Fisheries Forums, which have been established for that purpose. Each Iwi Fisheries Forum has
developed an Iwi Fisheries Forum Plan that described how the iwi in the Forum exercise
kaitiakitanga over the fisheries of importance to them, and their objectives for the management
of their interest in fisheries. Particular regard will be given to kaitiakitanga when making
sustainability decisions.
30. Iwi Fisheries Forums may also be used as entities to consult iwi with an interest in fisheries.
Fisheries New Zealand Review of sustainability measures October 2021: HOK 1 • 531. The list of species being considered for proposed adjustments to the TAC, which included HOK
1, was provided to the following Iwi Fisheries Forums: Te Hiku o te Ika, Mid North, Nga Hapu o
te Uru, Te Tai Hauauru and Te Waka a Māui me Ōna Toka.
32. In May 2021, a two-page document with the proposal to amend the non-regulatory catch limits
and the TAC/TACC for HOK 1 was provided to Te Hiku o te Ika and Nga Hapu o te Uru and
input sought. The only feedback specific to HOK 1 was from Nga Hapu o te Uru, who supported
a decrease in catch limit and confirmed that hoki are not pursued customarily as they are
located too far offshore and too deep.
6.2 Kaitiakitanga
33. Hoki is identified as a taonga species by the following Iwi fisheries forums: Chatham Islands
Fisheries Forum @ 44°, Mai i Nga Kuri a Wharei ki Tihirau, Te Tai Hauāuru, Te Hiku o Te Ika
and Te Waka a Māui me Ōna Toka.
34. The HOK 1 fish stock (Figure 1) includes the rohe of: Te Hiku o Te Ika (far North), Nga Hapu o
Te Uru o Tainui (Waikato), Mai i Ngā Kuri a Whārei ki Tihirau (Bay of Plenty), Ngāti Porou (East
Cape), Mai Paritu tae atu ki Turakirae (East coast - Paritu to Turakirae), Te Tai Hauāuru
(Taranaki/ Whanganui/ Manawatu/ Horowhenua/ Kapiti), Rangitaane (North Island), Te Tau Ihu
(North of the South Island), Te Waka a Māui me Ōna Toka (South Island and Stewart Island),
Hauraki, Chatham Islands and Mid-North.
35. Fisheries New Zealand considers the proposals for HOK 1 to be generally consistent with the
objectives of these Iwi Fisheries Forum Plans, in particular those to: improve the management
of fisheries resources to ensure sustainability for future generations; to ensure that commercial
and non-commercial customary needs are met; and that fish stocks are healthy and support the
social, cultural and economic prosperity of iwi and hapū .
36. There are no customary fisheries management tools such as mātaitai, taiāpure or section 186A
or 186B temporary closures relevant to the proposals in this document.
7 Relevant plans, strategies, statements and context
7.1 National Fisheries Plan for Deepwater and Middle-depths Fisheries
37. Hoki in HOK 1 is managed as a Tier 1 species within the National Fisheries Plan for Deepwater
and Middle-depths Fisheries. A species-specific chapter of the National Deepwater Plan for hoki
(Part 1B) was completed in 2010.
38. The National Deepwater Plan sets out a series of Management Objectives for deepwater
fisheries, the most relevant to the proposals for HOK 1 being:
Management Objective 1: Ensure the deepwater and middle-depths fisheries resources
are managed so as to provide for the needs of future generations.
Management Objective 4: Ensure deepwater and middle-depth fish stocks and key
bycatch fish stocks are managed to an agreed harvest strategy or reference points.
7.2 Regional Plans
39. All regional councils have a coastline within HOK 1. Coastal plans for these regions aim to
manage the coastal and freshwater environments, including terrestrial and coastal linkages,
ecosystems and habitats.
40. Fisheries New Zealand considers that the proposed management options presented are in
keeping with the objectives of the relevant regional plans, which generally relate to the
maintenance of healthy and sustainable ecosystems to provide for the needs of current and
future generations.
6 • Review of sustainability measures October 2021: HOK 1 Fisheries New Zealand7.3 Te Mana o te Taiao (Aotearoa New Zealand Biodiversity Strategy)
41. Te Mana o te Taiao – the Aotearoa New Zealand Biodiversity Strategy sets a strategic direction
for the protection, restoration and sustainable use of biodiversity, particularly indigenous
biodiversity, in Aotearoa New Zealand. The Strategy sets a number of objectives across three
timeframes. The most relevant to setting sustainability measures for HOK 1 are objectives 10
and 12:
Objective 10: Ecosystems and species are protected, restored, resilient and connected from
mountain tops to ocean depths.
Objective 12: Natural resources are managed sustainably
42. The Ministry for Primary Industries (MPI) is undertaking work to define specific terms used in
the Strategy (e.g. ‘environmental limits’), but is required by the Fisheries Act to manage
fisheries to balance use and sustainability, including the requirement to avoid, remedy or
mitigate adverse effects on the aquatic environment. The Ecosystem Interactions section in this
paper provides information on relevant interactions with the wider aquatic environment for this
stock.
8 Catch information and current settings within the TAC
8.1 Commercial
43. The largest fishery for HOK 1 is the west coast South Island spawning fishery, which operates
seasonally from May-September. In 2019/20 43,900 tonnes of hoki was caught in the West
Coast South Island fishery, which represents 41% of overall HOK 1 catch and 84% of the total
western stock catch. The Sub-Antarctic is the second most important western stock fishery
(8,037 tonnes in 2019/20).
44. Catch from the eastern stock is primarily taken on the Chatham Rise and on the east coast of
the South Island with 32,900 tonnes taken in 2019/20. This represents 31% of HOK 1 catch and
59% of the total eastern stock catch. A smaller amount of hoki is taken in spawning fisheries in
the Cook Strait and off the east coast of the South Island.
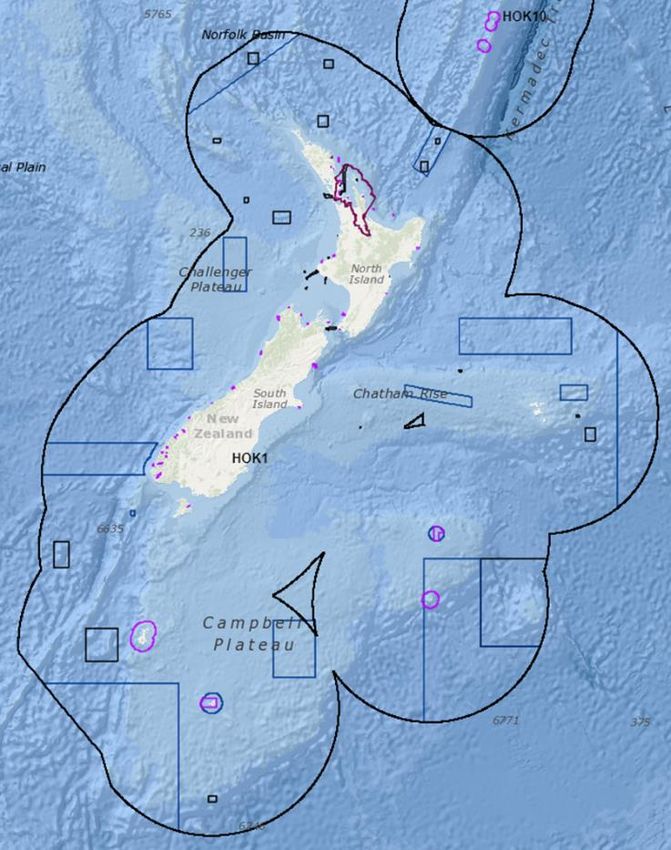
45. The TACC has been under-caught by more than 10,000 tonnes in HOK 1 from 2015/16-2018/19
(Figure 3). This is the result of non-regulated ‘shelving’ arrangements implemented by the
fishing industry (refer to Section 3.2) and in part reflects operational decisions to not take the full
catch limit and divert effort to other fisheries in the west coast South Island spawning fishery
(e.g. squid) when hoki catch rates are low.
Fisheries New Zealand Review of sustainability measures October 2021: HOK 1 • 7250000
200000
Tonnes
150000
100000
50000
0
2004/05
2012/13
2001/02
2002/03
2003/04
2005/06
2006/07
2007/08
2008/09
2009/10
2010/11
2011/12
2013/14
2014/15
2015/16
2016/17
2017/18
2018/19
2019/20
Fishing year
Catch Available ACE TACC
Figure 3: The HOK 1 catch, TACC and available ACE 2001/02 – 2019/20.
8.2 Other mortality caused by fishing
46. There is an allocation of 1,150 tonnes for all other mortality caused by fishing, equivalent to
10% of the TACC. It is likely that large catches within this fishery have resulted in burst bags,
loss of catch, and some mortality.
8.3 Customary Māori
47. The current annual customary allowance for HOK 1 is set at 20 tonnes. Over the past 15 fishing
years the total reported customary catch of hoki in HOK 1 has been 20 kg, which was caught
between January and March 2008.
8.4 Recreational
48. The current annual recreational allowance for HOK 1 is set at 20 tonnes. There is no
information to suggest there is anything more than a nominal recreational catch of hoki in HOK
1. The National Panel Survey of Marine Recreational Fishers (NPS) in 2017/18 did not list hoki
as a separate species for reporting catch data, most likely due to the low level of recreational
catch.
9 Status of the stock
49. Hoki in HOK 1 are managed to a target range of 35-50% of mature unfished biomass. The stock
assessment for hoki was subject to extensive revision between 2019 and 2021. This followed a
review of input data and model assumptions completed between 2018 and 2020 (Dunn &
Langley 2018; Langley 2020). The 2021 assessment model differs from the previous
assessment substantially, in having different assumptions for natural mortality, maturation, and
migration, and spatially restructured fisheries-dependent data with revised selectivity
assumptions.
8 • Review of sustainability measures October 2021: HOK 1 Fisheries New Zealand9.1 Western stock
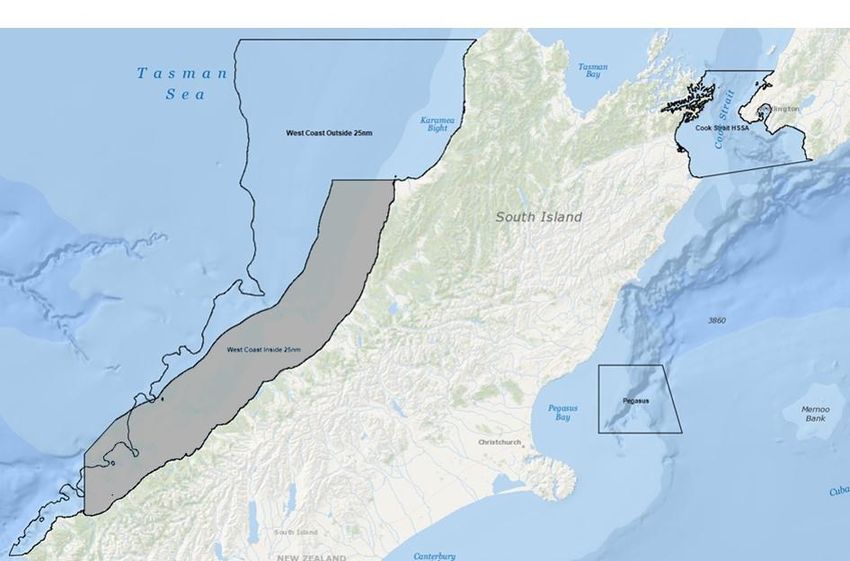
50. For the western stock, the 2021 stock assessment estimated stock status to be at 35% B 0
(Figure 4). The 2021 Fisheries Assessment Plenary (The Plenary) agreed the stock is ‘About As
Likely As Not’ (40–60% probability) to be at or above the lower end of the target range.
51. Five-year projections at the current catch limit predict this stock will fall below the management
target range in the next fishing year. With a reduction of 5,000 tonnes for the western stock
catch limit the stock is predicted to remain below the target range for two years and then return
to the lower bound of this range (35% B0) in three years. With a reduction of 10,000 tonnes the
stock is predicted to dip below the lower bound for a single year, be at the lower bound for a
year and then be within the target range in three years (Figure 4).
9.2 Eastern stock
52. For the eastern stock, the 2021 stock assessment estimated stock status to be at 48% B0
(Figure 4). The Plenary agreed the stock is ‘Very Likely’ (> 90% probability) to be at or above
the lower end of the management target range (35% B0) and that it is ‘About As Likely As Not’
(40–60% probability) to be above the upper end of the management target range (50% B0).
53. Five-year projections at the current catch limit predict that the biomass will be 46% B0 (median
value) in 2026. With a 5,000 tonne increase to the eastern stock catch limit the biomass is
predicted to be 44% B0 in 2026, which is still within the upper half of the management target
range.
50
% of virgin mature biomass
45
Management target range
East 50,000t
40 East catch limit (60,000t)
East 65,000t
West 45,000t
West 50,000t
35
West catch limit (55,000t)
30
2021-22 2022-23 2023-24 2024-25 2025-26 2026-27
Fishing year
Figure 4: The Eastern and Western stock five-year biomass projections under different catch limit scenarios in
relation to the management target range with recruitment modelled using recent (2008-17) year class
strength.
10 Current and proposed TAC, TACC and allowance settings
54. For all options proposed the allowance for all other mortality caused by fishing is being
maintained at a level that is equivalent to 10% of the TACC as there is no new evidence to
suggest this needs to be reviewed.
55. There are also no proposed changes to either the customary or recreational allowances under
any option.
Fisheries New Zealand Review of sustainability measures October 2021: HOK 1 • 956. Fisheries New Zealand invites views on these proposed options.
10.1 Option 1 - (Status quo)
57. Option 1 maintains the current settings (status quo).
58. For five-year projections under this option, the western stock is projected to be at 34% B 0, with a
45% probability of being within or above the management target range and the eastern stock is
projected to be at 46% B0, with a 78% probability of being within or above the management
target range.
Western stock Eastern stock
TAC TACC Customary Recreational Other mortality
limit limit
116,190 115,000 55,000 60,000 20 20 1,150
10.2 Option 2 - (Modified status quo)
Western stock Eastern stock
TAC TACC Customary Recreational Other mortality
limit limit
116,190 115,000 50,000 65,000 20 20 1,150
59. Option 2 results in no overall change to the HOK 1 TAC or TACC. The western stock catch limit
will be reduced by 5,000 tonnes and the eastern stock catch limit will be increased by 5,000
tonnes.
60. For five-year projections under this option, the western stock is projected to be at 35% B0, with a
50% probability of being within or above the management target range and the eastern stock is
projected to be at 44% B0, with a 74% probability of being within or above the management
target range.
10.3 Option 3 - (West 5,000)
Western stock Eastern stock
TAC TACC Customary Recreational Other mortality
limit limit
111,140 110,000 50,000 60,000 20 20 1,100
61. Option 3 reduces the HOK 1 TAC by 5,050 tonnes and the TACC by 5,000 tonnes. The western
stock catch limit will be reduced by 5,000 tonnes with no change to the eastern stock.
62. For five-year projections under this option, the western stock is projected to be at 35% B0, with a
52% probability of being within or above the management target range and the eastern stock is
projected to be at 46% B0, with a 78% probability of being within or above the management
target range.
63. This option would result in a potential reduction of $11.8 million in export revenue from the
5,000 tonne reduction in the HOK 1 TACC.2 However, the catch in the 2019/20 fishing year was
below the TACC proposed under this option and the 2020/21 catch is also expected be below
this proposed TACC due to shelving, so this option should not result in any negative economic
impact compared to the previous fishing year.
10.4 Option 4 - (West 10,000, East 5,000)
2
The export value is estimated by dividing the weight of the TACC change by a conversion factor for the most commonly landed
processed state (Fillets:Skin-off trimmed) and the multiplying by the average export value for this product state (Frozen fillets) in
2020.
10 • Review of sustainability measures October 2021: HOK 1 Fisheries New ZealandWestern stock Eastern stock
TAC TACC Customary Recreational Other mortality
limit limit
111,140 110,000 45,000 65,000 20 20 1,100
64. Option 4 reduces the HOK 1 TAC by 5,050 tonnes and reduces the TACC by 5,000 tonnes. The
western stock catch limit decreases by 10,000 tonnes and the eastern stock catch limit
increases by 5,000 tonnes.
65. For five-year projections under this option, the western stock is projected to be at 37% B0, with a
56% probability of being within or above the management target range and the eastern stock is
projected to be at 43% B0, with a 73% probability of being within or above the management
target range.
66. This option would result in a potential reduction of $11.8 million in export revenue from the
5,000 tonne reduction in the HOK 1 TACC. However, the catch in the 2019/20 fishing year was
below the TACC proposed under this option and the 2020/21 catch is also expected be below
this proposed TACC due to shelving, so this option should not result in any negative economic
impact compared to the previous fishing year.
10.5 Option 5 - (West 10,000)
Western stock Eastern stock
TAC TACC Customary Recreational Other mortality
limit limit
106,090 105,000 45,000 60,000 20 20 1,050
67. Option 5 reduces the HOK 1 TAC by 10,100 tonnes and reduces the TACC by 10,000 tonnes.
The western stock catch limit decreases by 10,000 tonnes with no change to the eastern stock.
68. For five-year projections under this option, the western stock is projected to be at 37% B0, with a
57% probability of being within or above the management target range and the eastern stock is
projected to be at 46% B0, with a 77% probability of being within or above the management
target range.
69. This option would result in a potential reduction of $23.5 million in export revenue from the
10,000 tonne reduction in the HOK 1 TACC. The catch in the 2019/20 fishing year was
approximately 3,000 tonnes more than the TACC proposed under this option, so the potential
reduction in export value compared to the 2019/20 fishing year is estimated to be $7.1 million.
However, the 2020/21 catch is expected be below this proposed TACC due to shelving, so this
option should not result in an economic impact compared to the previous fishing year.
11 Environmental interactions
70. The key environmental interactions within this fishery, which must be taken into account when
considering sustainability measures, concern marine mammals, seabirds, fish and invertebrate
bycatch, trophic interactions, benthic impacts and habitats of particular significance.
71. None of the options proposed contain increases to the HOK 1 TAC or TACC and some include
decreases. Therefore, the frequency or scale of environmental interactions is predicted to either
decrease or remain the same in line with fishing effort in HOK 1. However, two of the options do
include an increase to the eastern stock catch limit, so there may be an increase in fishing effort
in this area.
72. Observers are only present on some fishing vessels. To estimate total captures in a fishery,
statistical methods are used to extrapolate from observed fishing to unobserved fishing. The
values presented in the Seabirds section estimate the captures that occurred on all fishing effort
Fisheries New Zealand Review of sustainability measures October 2021: HOK 1 • 11(both observed and unobserved). These models have been completed using data up to the
2017/18 fishing year.3
11.1 Marine mammals
73. Fur seals are sometimes caught in hoki target tows, with the majority of captures occurring in
the West Coast South Island and Cook Strait fisheries. During the 2013/14 - 2017/18 fishing
years an annual average of 39 fur seals were reported by observers as caught by hoki targeted
tows. The average observer coverage for hoki targeted tows over the 2013/14 - 2017/18 fishing
years was 28.4%.
74. To minimise the risk of marine mammal captures, industry has developed Marine Mammal
Operational Procedures (MMOP) for all trawlers greater than 28 m in length. The MMOP
describes a range of procedures that a vessel and crew should follow to reduce the risk of
marine mammal captures. Fisheries New Zealand monitors and audits vessel performance
against the MMOP via the Observer Programme.
11.2 Seabirds
75. Seabirds are caught during hoki targeted trawling and during the 2013/14 - 2017/18 fishing
years an estimated average of 98 birds were caught by hoki targeted tows annually.
76. The 2019 seabird risk assessment (Richard et al 2019) estimates that hoki fishing poses more
than 10% of risk from commercial fisheries for three species identified as being in a high or
very high risk category; Salvin’s albatross (hoki fishing contributes 16% of risk), Southern
Buller’s albatross (hoki fishing contributes 31% of risk), and Westland petrel (hoki fishing
contributes 11% of risk).
77. From the statistically modelled seabird capture data from 2013/14 - 2017/18 fishing years 60%
of estimated Salvin’s albatross captures from hoki targeted tows occurred in the eastern stock
area (where an increase in the catch limit is being considered). However, observed captures of
Westland petrel and Southern Buller’s albatross in the eastern stock area during this five-year
time period were rare (one for each species).
78. In 2020 the National Plan of Action (NPOA) for Seabirds, which sets out the New Zealand
government’s commitment to reducing fishing-related captures and associated mortality of
seabirds was approved. The NPOA Seabirds’ (2020) vision is that New Zealanders work
towards zero fishing-related seabird mortalities.
79. There are regulations in place that require seabird mitigation to be used on trawl vessels. In
addition, industry have developed non-regulatory vessel-specific plans that set out practices
that vessels should implement to reduce the risk of seabird interactions. Examples of these
mitigation measures include bird bafflers, tori lines, managing fish waste discharge and effective
clearing of nets between tows. Fisheries New Zealand has processes in place to audit
performance against these seabird mitigation measures.
11.3 Fish bycatch
80. For the statistically modelled bycatch of the combined trawl effort for hoki, hake and ling based
on observer reported data from 2002/03-2016/17, these three target species accounted for 91%
of catch (Anderson et al 2019). The remaining catch was primarily silver warehou (3.9%),
javelinfish (1.9%), rattails (1.6%) and spiny dogfish (1.4%).
81. The majority of the species most commonly caught as bycatch during hoki targeted tows, as
outlined above, are in the QMS. There is limited data for some of these species in the hoki
eastern stock area where an increase in the catch limit is being considered, however there are
currently no known sustainability concerns for these species.
3
More information on the statistical models and data set used to model total Seabird interactions can be found here
https://psc.dragonfly.co.nz/2019v1/
12 • Review of sustainability measures October 2021: HOK 1 Fisheries New Zealand11.4 Benthic impacts
82. Trawling for hoki can interact with the seabed and the associated benthic environment. The
nature and extent of those impacts depends on a range of factors such as seafloor type (e.g.,
mud/sand/rock), gear type, types of organisms encountered and oceanographic characteristics.
Contact of the trawl gear with the seabed can lead to bycatch of benthic organisms including
corals, sponges and sea anemones.
83. The impact of hoki target tows on the benthic environment (the trawl footprint) is mitigated by
the spatial concentration of the fishery where vessels typically trawl along previously trawled
tow lines. The trawl footprint for all hoki target effort is mapped and monitored annually. In
2018/19, 0.6% of the New Zealand Exclusive Economic Zone (EEZ) and 1.8% of the fishable
area (shallower than 1,600 metres and open to bottom trawling) of the EEZ was contacted by
trawl fishing for hoki (Baird and Mules 2021). This annual footprint for hoki is lower than the
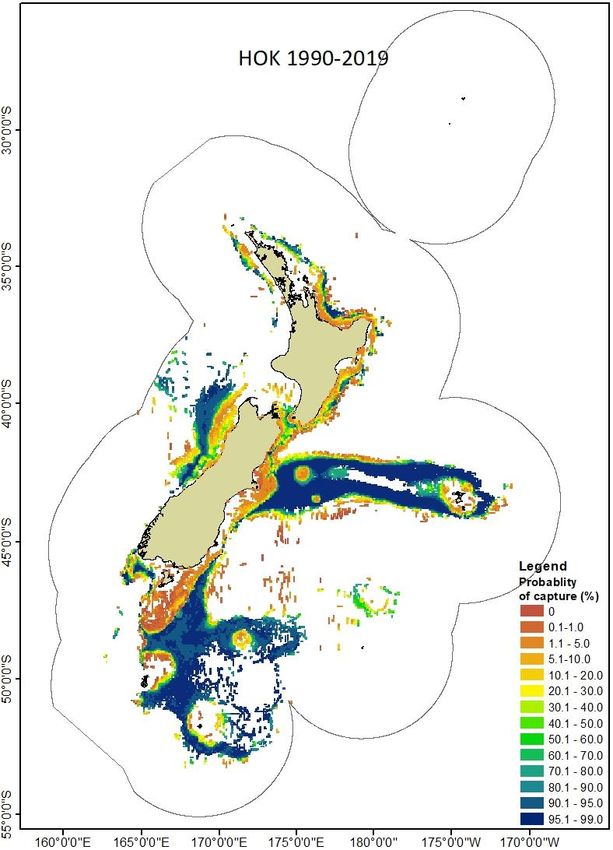
previous five fishing years (Figure 5).
84. Fisheries New Zealand monitors the trawl footprint of this fishery annually and the cumulative
fishable area contacted by trawl fishing for hoki between 1989/90-2018/19 was 4.1% of the NZ
EEZ.
Figure 5: Distribution of the 1990–2019 (left) and the 2019 trawl footprints (right) for hoki, displayed by 25-km2
contacted cell, relative to the probablity of capture for that species.
85. Management measures to address the effects of trawl activity have focused on avoiding benthic
impacts. 30% of New Zealand’s fisheries waters are closed to trawling. These closures are
primarily Seamount Closures and Benthic Protection Areas (BPAs) which were implemented to
avoid adverse effects of fishing on the benthic environment (Figure 6). HOK 1 contains all of the
seamount closures and BPAs excluding the BPA surrounding the Kermadec region.
11.5 Habitats of particular significance
86. There are two potential types of habitats of particular significance in HOK 1, these are spawning
grounds and areas with high densities of small hoki. Spawning grounds include the west coast
of the South Island (Hokitika Canyon), the Cook Strait, the Puysegur area and in Pegasus
Canyon. Areas with high densities of small hoki include the Cook Strait (narrows basin),
Fisheries New Zealand Review of sustainability measures October 2021: HOK 1 • 13Canterbury Banks, Mernoo Bank and Puysegur.
Table 3: Summary of information on habitats of particular significance for HOK 1.
Fish Stock HOK 1
Habitat Hokitika Canyon, the Cook Strait, the Puysegur area and Pegasus
Canyon
Attributes of habitat • Key spawning areas (winter months: June-September).
• Potentially due to the presence of canyons and trenches
within these areas, however this is speculative at present.
Reasons for particular • Spawning is of critical importance in supporting the
significance productivity of a fish species.
• These are the main spawning locations identified in NZ
waters to date.
Habitat Cook Strait (Narrows basin), Canterbury banks, Mernoo bank and
Puysegur bank
Attributes of habitat • There are thought to be higher densities of small hoki in
these areas.
Reasons for particular • Survival of juveniles to an age where they can reproduce
significance is essential for the productivity of a fish species.
• These are the main areas identified with high densities of
small hoki in NZ EEZ to date.
Risks/Threats • Trawl fishing can contact the seafloor impacting benthic
habitats. It is currently unknown what conditions make
these habitats favourable for spawning or for small hoki,
so it is also unknown to what extent this fishing activity
impacts these habitats.
• Oceanographic features could be impacted by cable
laying but there is an existing cable protection zone and
laying of new cables is unlikely.
• Oceanographic features and current/circulation patterns
could be impacted by future development of tidal power
(e.g. Sustainable Seas project - tidal farm potential in the
Cook Strait).
• Long term - current/ circulation patterns could be impacted
by climate change (ocean warming, changes to wind
patterns).
• Research trawl data indicate small hoki (Figure 6: Non hoki-specific marine environmental protection in place within HOK 1: the left panel shows benthic
protection areas (blue), marine reserves (pink), marine parks (purple) and cable protection zones and
seamount closures (black), the right panel shows areas closed to trawling (orange) within the territorial sea.
12 Uncertainties and risks
87. The primary sources of uncertainty in the HOK 1 stock assessment are the stock structure and
migration patterns (particularly from the Chatham Rise to the sub-Antarctic), the age of maturity
for males and females and the length to weight conversion for spawning fish.
88. In recent years, there have been warming events in the Tasman Sea, and potentially other
environmental changes, that may be impacting the distribution of hoki or other biological
parameters that affect the interpretation of available data on hoki. At present, the effect of these
environmental impacts on the future abundance and distribution of hoki is unknown.
13 Deemed values
89. Deemed values are the price paid by fishers for each kilogram of unprocessed fish landed in
excess of a fisher’s ACE holdings. The purpose of the deemed values regime is to provide
incentives for individual fishers to acquire or maintain sufficient ACE to cover catch taken over
the course of the year, while allowing flexibility in the timing of balancing, promoting efficiency,
and encouraging accurate catch reporting.
90. The Deemed Value Guidelines set out the operational policy Fisheries New Zealand uses to
inform the development of advice to the Minister on the setting of deemed values.
91. The current basic annual deemed value rate for HOK 1 ($0.90 per kg) is set slightly above the
average price paid by fishers during the 2019/20 fishing year for one kilogram of HOK 1 ACE
($0.38 per kg).
92. Fisheries New Zealand believes that if the TACC is reduced under some of the options outlined
above, the changes in fishing behaviour will be small and unlikely to greatly impact the ACE
Fisheries New Zealand Review of sustainability measures October 2021: HOK 1 • 15market, therefore no changes are proposed to the deemed value rates at this time (Table 4).
The 2019/20 port price index of HOK 1 was $0.63 per kg.
Table 4: Deemed value rates for HOK 1.
Annual Differential Rates ($/kg) for excess catch (% of ACE)
Fish stock Interim Rate ($/kg)
100-102% 102%+
HOK 1 0.81 0.90 1.30
93. Fisheries New Zealand welcomes feedback on these deemed value settings.
14 Questions for submitters on options for varying TACs,
TACCs and allowances
• Which option do you support for revising the TAC, catch split arrangement and allowances?
Why?
• If you do not support any of the options listed, what alternative(s) should be considered?
Why?
• Are the allowances for customary Māori, recreational and other sources of mortality
appropriate? Why?
• Do you think these options adequately provide for social, economic, and cultural wellbeing?
• Do you have any concerns about potential impacts of the proposed options on the aquatic
environment?
94. We welcome your views on these proposals. Please provide detailed information and sources to
support your views where possible.
15 How to get more information and have your say
95. Fisheries New Zealand invites you to make a submission on the proposals set out in this
discussion document. Consultation closes at 5pm on 27 July 2021.
96. Please see the Fisheries New Zealand sustainability consultation webpage
(https://www.mpi.govt.nz/consultations/review-of-sustainability-measures-2021-october-round)
for related information, a helpful submissions template, and information on how to submit your
feedback. If you cannot access to the webpage or require hard copies of documents or any
other information, please email FMSubmissions@mpi.govt.nz.
16 Referenced reports
Anderson, O F; Edwards, C T T; Ballara, S (2019). Non-target fish and invertebrate catch and discards
in New Zealand hoki, hake, ling, silver warehou, and white warehou trawl fisheries from 1990–
91 to 2016–17. New Zealand Aquatic Environment and Biodiversity Report, No. 220. 117 p.
Baird, S.J.; Mules, R. (2021). Extent of bottom contact by commercial trawling and dredging in New
Zealand waters, 1989–90 to 2018–19. New Zealand Aquatic Environment and Biodiversity
Report, No. 260. 157 p.
Connell, A M; Dunn, M R; Forman, J (2010). Diet and dietary variation of New Zealand hoki
Macruronus novaezelandiae. New Zealand Journal of Marine and Freshwater Research, 44:
289–308.
Department of Conservation and Fisheries New Zealand (2020). National Plan of Action — Seabirds
2020. Accessible at: https://www.mpi.govt.nz/dmsdocument/40652-National-Plan-Of-Action-
16 • Review of sustainability measures October 2021: HOK 1 Fisheries New ZealandSeabirds-2020-Report
Dunn, M; Horn, P; Connell, A; Stevens, D; Forman, J; Pinkerton, M; Griggs, L; Notman, P; Wood, B
(2009). Ecosystem-scale trophic relationships: diet composition and guild structure of middle-
depth fish on the Chatham Rise. Final Research Report for Ministry of Fisheries Research
Project ZBD2004-02, Objectives 1–5. 351 p.
Dunn, M R; Langley, A (2018). A review of the hoki stock assessment in 2018. New Zealand Fisheries
Assessment Report 2018/42. 55 p.
Fisheries New Zealand (2019). National Fisheries Plan for Deepwater and Middle-depth Fisheries.
Accessible at: https://www.mpi.govt.nz/dmsdocument/3967-National-Fisheries-Plan-for-
Deepwater-and-Middle-depth-Fisheries-2019.
Hoki specific chapter available at:
https://www.mpi.govt.nz/dmsdocument/3974-National-Fisheries-Plan-for-Deepwater-and-
Middle-depth-Fisheries-Part-1B-Hoki-fishery-chapter.
Fisheries New Zealand (2020). Guidelines for the review of deemed value rates for stocks managed
under the Quota Management System. Accessible at:
https://www.mpi.govt.nz/dmsdocument/40250/direct
Fisheries New Zealand (2021). Fisheries Assessment Plenary, May 2021: stock assessments and
stock status. Compiled by the Fisheries Science and Information Group, Fisheries New
Zealand, Wellington, New Zealand. Accessible at: https://www.mpi.govt.nz/science/fisheries-
science-research/about-our-fisheries-research
Langley, A D (2020). Review of the 2019 hoki stock assessment. New Zealand Fisheries Assessment
Report 2020/28. 56 p.
Livingston, M E; Schofield, K A (1996). Annual changes in the abundance of hoki and other species on
the Chatham Rise, Jan 1992–Jan 1995 and the Southern Plateau, Dec 1991–Dec 1993. New
Zealand Fisheries Assessment Research Document 1996/14. 35 p. (Unpublished report held by
NIWA library, Wellington.)
Livingston, M E; Bull, B; Stevens, D W (2002). Migration patterns during the life-cycle of hoki
(Macruronus novaezelandiae): an analysis of trawl survey data in New Zealand waters 1991–
2002. Final Research Report for Ministry of Fisheries Research Project HOK2000/01 Objective
6. (Unpublished report held by Fisheries New Zealand, Wellington).
Murdoch, R C; Guo, R; McCrone, A (1990). Distribution of hoki (Macruronus novaezelandiae) eggs
and larvae in relation to hydrography in eastern Cook Strait, September 1987. New Zealand
Journal of Marine and Freshwater Research, 24: 533–543.
New Zealand Government (2020). Te Mana o te Taiao - Aotearoa New Zealand Biodiversity Strategy 2020.
Accessible at: https://www.doc.govt.nz/nature/biodiversity/aotearoa-new-zealand-biodiversity-
strategy/
Richard, Y.; Abraham, E.R.; Berkenbusch, K. (2019). Assessment of the risk of commercial fisheries
to New Zealand seabirds, 2006–07 to 2016–17. New Zealand Aquatic Environment and
Biodiversity Report, 237.
Stevens, D W; Hurst, R J; Bagley, N W (2011). Feeding habits of New Zealand fishes: a literature
review and summary of research trawl database records 1960 to 2000. New Zealand Aquatic
Environment and Biodiversity Report, No. 85. 218 p.
Wynne-Jones, J.; Gray, A.; Heinemann, A.; Hill, L.; Walton, L. (2019). National Panel Survey of Marine
Recreational Fishers 2017-2018. New Zealand Fisheries Assessment Report 2019/24. 104p.
Accessible at: https://www.mpi.govt.nz/dmsdocument/36792-far-201924-national-panel-survey-
of-marine-recreational-fishers-201718
Fisheries New Zealand Review of sustainability measures October 2021: HOK 1 • 17You can also read