Review of pricing and load control by The Lines Company - Market performance review
←
→
Page content transcription
If your browser does not render page correctly, please read the page content below
Review of pricing and load control
          by The Lines Company
            Market performance review

                                 8 May 2017

                            Market Performance
The Lines Company Pricing and Load Control

Investigation stages
One of the Authority’s statutory functions is to undertake industry and market monitoring, and
carry out and make publicly available reviews, studies, and inquiries into any matter relating to
the electricity industry. 1
An in-depth investigation will typically be the final step of a sequence of escalating investigation
stages. The investigations are targeted at gathering sufficient information to decide whether a
Code amendment or market facilitation measure should be considered.
Market Performance Enquiry (Stage I): At the first stage, routine monitoring results in the
identification of circumstances that require follow-up. This stage may entail the design of low-
cost ad hoc analysis, using existing data and resources, to better characterise and understand
what has been observed. The Authority would not usually announce it is carrying out this work.
This stage may result in no further action being taken if the enquiry is unlikely to have any
implications for the competitive, reliable and efficient operation of the electricity industry. In this
case, the Authority publishes its enquiry only if the matter is likely to be of interest to industry
participants.
Market Performance Review (Stage II): A second stage of investigation occurs if there is
insufficient information available to understand the issue and it could be significant for the
competitive, reliable or efficient operation of the electricity industry. Relatively informal requests
for information are made to relevant service providers and industry participants. There is
typically a period of iterative information-gathering and analysis. The Authority would usually
publish the results of these reviews but would not announce it is undertaking this work unless a
high level of stakeholder or media interest was evident.
Market Performance Formal Investigation (Stage III): The Authority may exercise statutory
information-gathering powers under section 46 of the Act to acquire the information it needs to
fully investigate an issue. The Authority would generally announce early in the process that it is
undertaking the investigation and indicate when it expects to complete the work. Draft reports
will go to the Board of the Authority for publication approval.
The outcome of any of the three stages of investigation can be either a recommendation for a
Code amendment, provision of information to a Code amendment process already underway, a
brief report provided to industry as a market facilitation measure, or no further action.
From the point of view of participants, repeated information requests are generally concerned
with Stage II; trying to understand the issue to such an extent that a decision can be made
about materiality.

1
       Section 16(1)(f) of the Electricity Industry Act 2010

                                                          ii                       29 May 2017 11.13 a.m.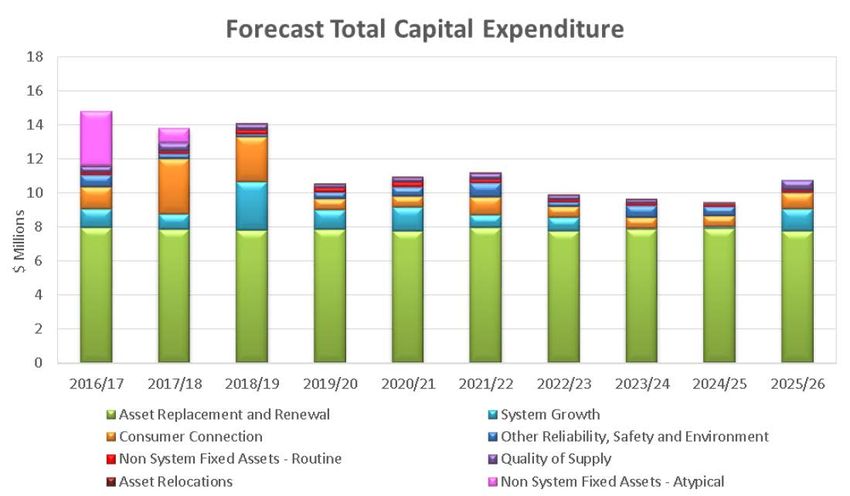
The Lines Company Pricing and Load Control

Executive summary
The Electricity Authority (Authority) announced in August 2016 that it would review the load
control and pricing practices of The Lines Company (TLC), focusing on the interaction between
those practices, the incentives they place on consumers and the outcomes they influence. This
report presents the results of that review.

                 Key lessons from the TLC pricing and load control review

 Linking distribution pricing with load controlling activity can cause unnecessary confusion
 and stress for consumers. These effects are exacerbated by the current transmission pricing
 methodology and TLC’s processes for determining when load controlling would reduce its
 transmission charges.

 Distributors need to carefully consider the range of systems needed to successfully
 implement any proposed pricing approach, from metering through to customer information
 technologies.

 Distribution pricing approaches that involve long delays between consumers’ actions and the
 pricing impacts on them, or involve uncertainty for consumers about the timing of pricing rate
 changes, are likely to result in significant consumer stress.

 Implementing a new distribution pricing approach is a complex process and should be given
 an appropriate level of resource by distributors.

 Distributors and retailers need to ensure that pricing for consumers is understandable.
 Consumers must be able to evaluate the impact that investments or behaviour changes will
 have on their charges.

 Distributors should recognise that consumers are used to having choices. Pricing regimes
 that don’t allow consumers to ‘opt-in’ or ‘opt-out’ need to be carefully introduced, preferably
 in a phased manner.

 Distributors should have monitoring systems in place to ensure that distribution pricing
 signals are working as intended and allow early intervention if changes are required.

 Distributors should remain responsive to feedback from consumers and retailers with regard
 to the implementation of a revised pricing methodology, and should communicate their
 experiences to other distributors

TLC initially implemented peak pricing for its commercial and residential connection customers
in 2007. Various parties have reviewed TLC’s pricing approach, in response to complaints from
consumers. These reviews have generally focused on the legality of TLC’s pricing and
communications. The primary purpose of this review is to explore TLC’s experiences with the
interaction of its load controlling practices and distribution pricing methodology and to draw out
lessons for other distributors considering their own distribution pricing approaches.

                                                 iii                           29 May 2017 11.13 a.m.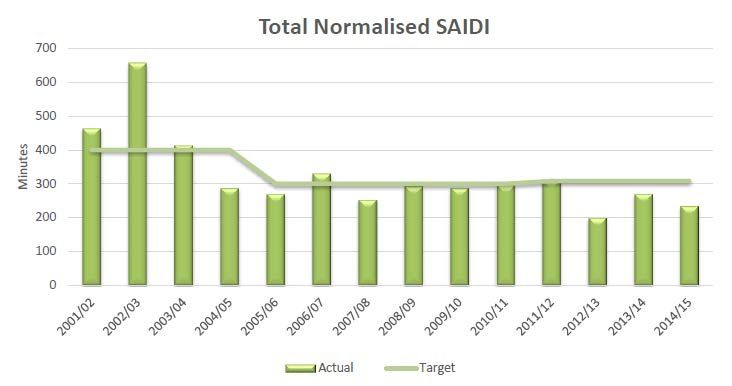
The Lines Company Pricing and Load Control

TLC currently integrates its use of load control into its distribution pricing for commercial and
residential consumers. The measurement of individual consumer’s peak consumption is limited
to the times that load control is operating. Several parties have expressed concern that TLC is
‘overusing’ load control.
TLC’s use of load control is influenced by a number of factors including the current transmission
pricing regime, the nature of their network, the capability of their load control equipment, and
their distribution pricing methodology. TLC uses load control more than the other distributors
considered in this review. However, TLC’s use of load control is consistent with the incentives
arising from the current transmission pricing regime. The Authority’s view is that the majority of
any harm associated with TLC’s use of load control arises from TLC’s pricing methodology,
rather than the actual amount of load controlling.
A significant proportion of TLC’s consumers say they find TLC’s methodology difficult to
understand, despite the general peak-pricing approach having been in place since 2007. This
was reflected in some of the investment decisions that consumers reported. In some cases,
consumers made large investments to reduce lines charges that were, in practice, unlikely to
have any effect on their charges.
The Authority believes there are four key features of TLC’s pricing approach that cause
consumer stress and uncertainty, which consumers are unable to avoid because they are not
allowed to choose other charging methods.
   •   The complexity of the pricing methodology creates uncertainty for consumers about the
       effect of their investments and behaviour on TLC charges.
   •   The variable nature of the timing of TLC’s dispatch of load control places additional costs
       on consumers associated with information-gathering, and creates uncertainty for
       consumers planning their everyday activities.
   •   The delay, and extended duration, of the effect of actions taken by individual consumers
       on TLC’s charges appears to be a significant source of stress for many consumers.
   •   A small number of actions (or lack of actions) on the part of consumers can have large
       financial effects on them.
The resulting consumer stress, and lack of understanding of TLC’s pricing methodology, is
driving inefficient consumer behaviour and investments.
This review did not find any evidence that TLC’s current pricing approach is having any direct
negative effects on competition and system reliability.
   •   The number of electricity retailers operating in the region is comparable to other similar
       areas, and the level of retail-market concentration in the region has been reducing over
       time.
   •   While TLC has a high interruption-rate relative to the size of their network, system
       reliability in the region has generally improved since peak pricing was first introduced.
Without suggesting whether a particular approach may be better in TLC’s circumstances, the
Authority notes the importance—and difficulty—of balancing:
   •   the efficient signalling of the impact of network costs to consumers
   •   whether consumers can understand the charging methodology and have certainty and
       predictability in pricing.

                                                iv                             29 May 2017 11.13 a.m.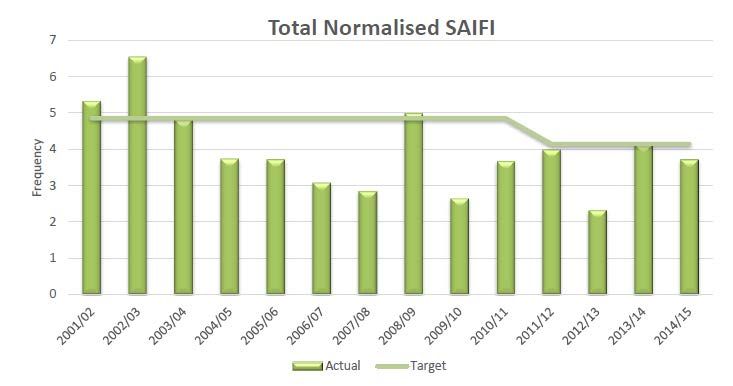
The Lines Company Pricing and Load Control

The Authority acknowledges that TLC’s approach of direct-billing consumers, rather than
passing costs through to consumers through electricity retailers, will have had an influence on
the amount of criticism levelled at TLC’s pricing.
Implementing a new distribution pricing approach in a region is a complex process and should
be given an appropriate level of resource by distributors. Distributors should test the effects of
their intended methodology by trialling it, if possible, before rolling out a new charging
methodology and should remain responsive to feedback from consumers and electricity retailers
during the process. Communication between distributors should help to improve the design of,
and transition to, new pricing approaches in each area.
Ongoing monitoring by distributors of how consumers respond and use the network should help
to ensure that pricing signals continue to drive efficient outcomes for consumers.

                                                v                             29 May 2017 11.13 a.m.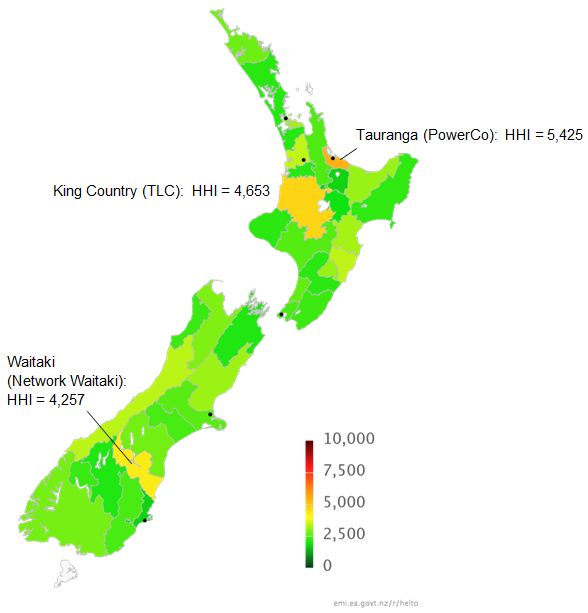
The Lines Company Pricing and Load Control

Contents
Executive summary                                                                                  iii
1   Background                                                                                     3
2   TLC’s network                                                                                  3
    Network characteristics                                                                        3
    Network performance and reliability                                                            6
3   Pricing                                                                                        8
    Distribution pricing principles                                                                8
    Transmission pricing                                                                           9
    Prices for distributed generation                                                             10
    Current TLC pricing methodology                                                               11
4   Load control                                                                                  13
    TLC load control                                                                              13
    Load control in other distribution areas                                                      15
    Communication of TLC load control to consumers                                                17
    Impact of TLC load control on service                                                         17
5   Consumer perceptions of TLC pricing                                                           20
6   Economic implications of TLC pricing                                                          22
    Retail competition in the TLC region                                                          22
    Supply reliability                                                                            26
    Efficiency                                                                                    27
    Peak pricing for distribution services                                                        28
    Implications of transmission charges for distribution pricing                                 29
    Trade-offs between distribution investments and consumer responses                            30
    TLC’s implementation of peak pricing                                                          32
7   Conclusions and recommendations                                                               34
Appendix A       TLC 2016 Asset Management Plan load characteristics                              38
Appendix B       TLC consumer survey responses                                                    40
Glossary of abbreviations and terms                                                               41

Tables
Table 1: Consumer response to peak-pricing concern survey question                                20
Table 2: Consumer response to level-of-understanding survey question                              21

Figures
Figure 1: TLC network regions                                                                      4
Figure 2: TLC forecast capital expenditure by type                                                 6
Figure 3: System Average Interruption Duration Index (SAIDI)                                       7
Figure 4: System Average Interruption Frequency Index (SAIFI)                                      7
Figure 5: Distribution supply interruptions per 100km of line 2015/16                              8
Figure 6: Load control for a sample TLC region (one channel)                                      15
Figure 7: Load control for sample regions across selected distribution companies                  16
Figure 8: Length of TLC load control events (year ended 31 August 2016)                           19

                                               1                              29 May 2017 11.13 a.m.
The Lines Company Pricing and Load Control
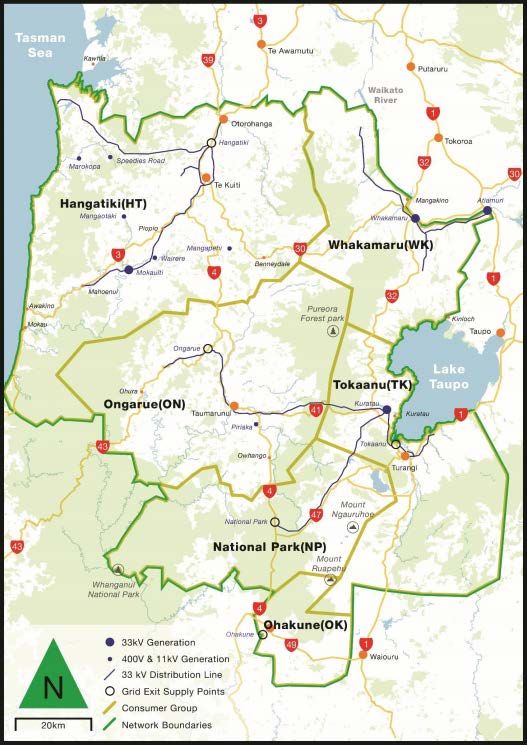
Figure 9: Retail brands serving each distribution company region 23
Figure 10:Distribution area retail HHI map 24
Figure 11: Retailer share in TLC region – number of connections 25
Figure 12: Energy component of domestic electricity prices for selected locations 26
2 29 May 2017 11.13 a.m.The Lines Company Pricing and Load Control
1 Background
1.1 The Electricity Authority (Authority) announced in August 2016 that it would review TLC’s
pricing with a focus on the relationship between pricing and TLC’s load control practices.
This report discusses the findings of that review. Key topics include the interactions
between TLC’s pricing and transmission pricing, the economic implications of the
incentives that TLC’s methodology places on participants, and the general lessons for
distributors that can be drawn from TLC’s implementation of peak pricing.
1.2 TLC is an electricity distribution lines business that owns and operates assets in the King
Country, Waitomo, and Central Plateau regions of New Zealand.
1.3 TLC was established in 1999 when electricity industry reforms required the separation of
retailing and distribution lines businesses. Before then, TLC’s lines business assets were
vested in King Country Energy Ltd and the Waitomo Energy Company, both of which
had themselves been created out of the old Power Boards as part of reforms earlier that
decade.
1.4 TLC is now fully owned by the Waitomo Energy Services Customer Trust (WESCT). 2
WESCT beneficiaries are consumers connected to the TLC network in the Waitomo
area. Before 2014, the King Country Electric Power Trust also held a partial interest in
TLC.
1.5 TLC’s network is mainly rural, with a few small towns and a number of industrial loads.
There is a strong seasonal aspect to the load in some areas of the network due to the
increased activity associated with winter sports and tourism.
1.6 TLC initially implemented peak pricing for its commercial and residential connection
customers in 2007.
2 TLC’s network
Network characteristics
2.1 TLC’s 2016 Asset Management Plant (AMP) contains a comprehensive description of
the characteristics and condition of the TLC network.
2.2 The TLC distribution network is served by six Transpower points of connection with the
national grid. TLC partitions its network into six regions as shown in Figure 1 below.
2
Although TLC is consumer-owned, the Commerce Commission do not treat TLC as meeting the ‘consumer-
owned’ criteria for being exempt from price-quality regulation because the trustees only represent part of the
full TLC network area.
3 29 May 2017 11.13 a.m.The Lines Company Pricing and Load Control
Figure 1: TLC network regions
Source: The Lines Company
2.3 Load characteristics vary between the regions.
(a) Hangatiki in the northwest is primarily rural, but also includes the townships of Te
Kuiti and Otorohanga, the Taharoa iron-sand operation, and a mix of other
industrial loads including sawmilling, limestone and meat processing. The Wairere
(4.2MW), Mokauiti (1.6MW), Mangapehi (1.6MW) and Speedys Road (2.2MW)
hydro-generation plants are embedded within the region. 3
(b) Whakamaru to the northeast is primarily dairy farming but includes the Tuaropaki
Trust Mokai Energy Park. The 113 MW Mokai geothermal plant is located at the
3
Embedded generation plant is plant that is connected to the local distribution network, as opposed to being
directly-connected to the national transmission grid
4 29 May 2017 11.13 a.m.The Lines Company Pricing and Load Control
Energy Park. The geothermal plant supplies electricity and direct heat to milk
processing facilities and glasshouses in the park, with excess power being
exported at times into the local network.
(c) Ongarue is primarily rural and includes the Taumaranui township. The Kuratau
(6.0MW) and Piriaka (1.5MW) hydro-generation plants are embedded within the
region.
(d) Tokaanu in the south-east of TLC network includes the Turangi township and the
Tongariro/Rangipo prison. There are a number of holiday homes in the region in
addition to farming.
(e) National Park in the south west includes the Whakapapa ski field and associated
accommodation and holiday homes, along with farming.
(f) Ohakune in the very south of the TLC network includes the Ohakune township, the
Turoa ski field, and holiday homes, as well as farming.
2.4 In addition to the generators noted above, a number of other small generating plants are
embedded within the TLC distribution area.
2.5 To illustrate the rural nature of the TLC network, TLC has an average of five Installation
Control Points (ICPs) per kilometre of distribution line, 4 which makes it the fourth-least
dense of all the distribution companies in New Zealand. By comparison, the densest
distribution company is Wellington Electricity which has 35 ICPs per kilometre of line.
2.6 Total consumption on the TLC network peaked at just over 71 MW for the year ended 31
August 2016. 5
2.7 TLC’s 2016 AMP provides information on current and forecast asset utilisation and
constraints, together with planned investments over the document’s ten-year planning
horizon.
2.8 The AMP includes detailed information about constraints on the TLC network. 6 At a
regional level, most of TLC’s transmission supply points are not likely to become
constrained over the next ten years, based on current demand growth forecasts.
However, the Hangatiki supply point often operates at a level where the failure of one
unit would result in a partial loss of supply, and TLC expects its backup supply point at
Atiamuri to reach its capacity within the next decade. Two transformers at zone sub-
stations within the TLC network are also expected to reach capacity. The AMP lists
constraint levels for individual distribution feeders, including current constraints,
inspection-access constraints, condition-related reliability constraints, and wind-speed
exposure constraints.
2.9 The main drivers for TLC capital expenditure are a mix of expected increase in demand
associated with dairy farming growth and industrial load, and replacing aging assets.
2.10 The following chart shows TLC’s forecast capital expenditure out to 2026 by category of
expenditure.
4
An installation control point (ICP) is the point of connection on a network where a retailer is deemed to
supply electricity to a consumer. Some individual consumers may have more than one ICP.
5
Gross demand (including demand supplied by embedded generation) reconciled at the TLC network points-
of-connection with the transmission grid.
6
See section 5.3.5 of the TLC 2016 Asset Management Plan.
5 29 May 2017 11.13 a.m.The Lines Company Pricing and Load Control
Figure 2: TLC forecast capital expenditure by type
Source: The Lines Company
2.11 Appendix A contains an extract from TLC’s 2016 AMP outlining consumer activities in
each region and their implications for peak load.
Network performance and reliability
2.12 TLC is one of the 17 distribution companies that are subject to Commerce Commission
price-quality path regulation. The Commerce Commission sets minimum reliability
targets for each distributor. The distributors are required to submit an annual compliance
statement to the Commerce Commission. 7
2.13 Distributors report on a number of service-quality statistics. Overall reliability is
measured using two key metrics, System Average Interruption Duration Index (SAIDI)
and System Average Interruption Frequency Index (SAIFI), shown in Figure 3 and Figure
4 below. The Commerce Commission sets targets for each metric for each distributor.
7
See www.comcom.govt.nz/regulated-industries/electricity/electricity-default-price-quality-path/ for more
information about Commerce Commission regulation of electricity distribution businesses.
6 29 May 2017 11.13 a.m.The Lines Company Pricing and Load Control
Figure 3: System Average Interruption Duration Index (SAIDI)
Peak pricing introduced
Source: The Lines Company 2016 AMP
2.14 SAIDI is a measure of the average length of customer outages on the distributor’s
network over the course of a year.
Figure 4: System Average Interruption Frequency Index (SAIFI)
Peak pricing introduced
Source: The Lines Company 2016 AMP
2.15 SAIFI is a measure of the average number of outages that customers on the distributor’s
network experience each year.
7 29 May 2017 11.13 a.m.The Lines Company Pricing and Load Control
2.16 Figure 5 below shows supply interruptions in the TLC region for the year ended 31
March 2016 compared to other distribution areas. The number of interruptions has been
divided by the length of each network to better compare the different-sized distributors.
Figure 5: Distribution supply interruptions per 100km of line 2015/16
Source: Commerce Commission disclosure data
Notes: 1. Data for the year ended 31 March 2016
3 Pricing
Distribution pricing principles
3.1 There are no mandated rules specifying how distribution companies should implement
distribution pricing, provided that they comply with information disclosure and revenue
requirements regulated by the Commerce Commission. 8
3.2 The Authority publishes voluntary principles and information disclosure guidelines. 9
Briefly, the pricing principles are that:
(a) prices should signal the economic costs of service provision by being subsidy free,
having regard to available service capacity, and signalling the impact of additional
usage
(b) residual pricing used to recoup any under-recovery from efficient marginal-cost
based pricing should consider demand responsiveness
8
Along with normal business conduct rules such as those stipulated under the Fair Trading Act.
9
See www.ea.govt.nz/operations/distribution/pricing/
8 29 May 2017 11.13 a.m.The Lines Company Pricing and Load Control
(c) provided that prices reflect costs, prices should discourage uneconomic bypass,
allow for trade-offs and non-standard arrangements, and encourage investment in
transmission/distribution alternatives and technology innovation where economic
(d) development of prices should be transparent, promote price stability and certainty,
and changes in prices should consider stakeholder impacts
(e) the development of prices should consider the impact of transaction costs on
stakeholders and should be economically equivalent across retailers.
3.3 The Authority originally published the guidelines in 2010. The Authority is currently
undertaking a distribution pricing review focused on the implications of evolving
technologies, such as solar photovoltaics and network connected batteries, for
distribution pricing arrangements. 10 The current guidelines and regulatory framework for
distribution pricing are being considered as part of that review.
Transmission pricing
3.4 Transpower, as grid owner, recovers the costs of building, operating and maintaining the
high voltage transmission system (grid) supplying electricity to each local distribution
region through a number of charges to electricity industry participants. As with the
regulation of distribution lines companies, the Commerce Commission is responsible for
the rules governing the total amount of revenue that Transpower can recover each year.
The Authority is responsible for the Electricity Industry Participation Code (Code) which
sets guidelines for the methodology that Transpower must develop and use to determine
how costs are shared between the various participants.
3.5 Unlike the regulation of the distribution companies where the Authority publishes
voluntary principles, the Authority specifies guidelines in the Code that Transpower must
use when it develops the transmission pricing methodology (TPM). The Authority is
currently reviewing the guidelines and is scheduled to complete the review in the first
half of 2018.
3.6 Under the current TPM, Transpower recovers grid-related costs through three primary
charges.
(a) ‘Connection’ charges recover the costs associated with transmission assets that
can be directly associated with an individual participant’s connection with the grid.
Generally these take the form of a fixed monthly charge that is reviewed each
year. It applies to local distribution companies, and generators and large industrial
customers that are directly-connected to the grid.
(b) Costs associated with the High Voltage Direct Current (HVDC) system connecting
the North and South Island (commonly referred to as the Cook Strait cable) are
charged to South Island generators. Each generator’s share is based on their
maximum output at each grid-connected generating plant. 11 Before 2016,
maximum output was assessed based on the top-12 peaks for each plant. In 2016
Transpower started to transition to an approach where plant output is calculated by
averaging all 17,520 half-hourly trading periods in each year, essentially turning
the charge into an energy-based charge rather than a peak-based charge.
10
See www.ea.govt.nz/development/work-programme/evolving-tech-business/distribution-pricing-review/
11
Referred to as a Historical Anytime Maximum Injection (HAMI) charge
9 29 May 2017 11.13 a.m.The Lines Company Pricing and Load Control
(c) ‘Interconnection’ charges recover all other grid-related costs not recovered through
the HVDC or connection charges. Interconnection charges are recovered from
distribution companies and grid-connected industrial loads using a demand-based
charge determined by the total load at each Grid Exit Point (GXP) at the time of the
peak load in the region the GXP is located. 12 The TLC area is located in the Lower
North Island region for TPM pricing purposes. TLC loads are calculated by taking
the average load at each GXP serving the TLC area at the time of the 100 highest
peaks in the Lower North Island region. 13
3.7 Transpower invoices distributors and generators each pricing year (1 April – 31 March)
based on consumption or output that occurred during the previous measurement year (1
September – 31 August).
3.8 The Authority consulted on proposed revisions to the current TPM in 2016 as part of its
TPM review process. A key element of the proposed revisions is the replacement of the
existing interconnection and HVDC charges with two new charges:
(a) An ‘area-of-benefit’ charge to generators, distributors and grid-connected industrial
loads. This charge would be based on the estimated benefit to each participant
from each of the investments in the transmission grid that are subject to the
charge. The details of how that benefit would be calculated are yet to be
determined.
(b) A capacity-based charge to distributors and grid-connected industrial loads that
recovers those costs not otherwise recovered by the area-of-benefit charge. This
type of charge is referred to as a ‘residual’ charge. The proposal is that the charge
could be based on historical maximum demand for each distributor or industrial
load.
3.9 The proposed revisions to the TPM also allow Transpower to propose an alternative
charge based on the long run marginal cost (LRMC) of building and maintaining
transmission assets, provided that Transpower can demonstrate that such a charge
would efficiently defer transmission investments.
3.10 Depending on the TPM approach finally implemented by Transpower, the impact of
distribution company peak loads on the distributor’s transmission charges may be
significantly reduced.
3.11 The Authority is currently targeting 1 April 2020 for the proposed changes to the
transmission pricing methodology to take effect.
Prices for distributed generation
3.12 Distribution companies currently make payments to the owners of generators connected
to their networks. The payments, known as Avoided Cost of Transmission (ACOT)
payments, were intended to encourage network-connected generators to operate at
peak-load times to reduce transmission costs by deferring the need for future investment
in the transmission grid.
12
Referred to as a Regional Coincident Peak Demand (RCPD) charge
13
A 2015 change to the TPM limited the assessment period for the Lower North Island region to between May
and October in each measurement year.
10 29 May 2017 11.13 a.m.The Lines Company Pricing and Load Control
3.13 The current ACOT regime sets the ACOT payments equal to the reduction in
transmission charges that the distributor would otherwise have had to pay if the network-
connected generator was not running. As the current TPM imposes peak demand
charges on distributors that are unrelated to savings in transmission costs, the current
ACOT regime encourages distributed generation when no actual cost savings occur. If
ACOT payments encourage enough distributed generation to be built in some areas of
the country, transmission costs could actually increase as new transmission capacity is
required to export electricity from those regions.
3.14 The Authority has decided to amend the Code so that distributed generation that does
not efficiently defer or reduce grid costs will no longer receive ACOT payments from
distributors under the regulated terms. The Authority published a decisions and reasons
paper in December 2016 outlining the reasons for this decision. 14
3.15 The ACOT Code amendment will be phased in between April 2018 and October 2019.
Current TLC pricing methodology
3.16 The focus of this review is on pricing for domestic and commercial customers. The
following analysis does not explore TLC’s pricing for customers like industrial or
commercial customers on non-standard pricing plans.
3.17 TLC directly invoices consumers in the TLC region for the provision of network services.
This is different to the approach used by most distribution companies, who charge
retailers. Retailers then seek to pass those costs onto consumers in a form consistent
with the retailer’s marketing and tariff strategies.
3.18 TLC provides information on its pricing methodology through a range of channels,
including documents published on its website. Two key documents are the Pricing
Methodology 1 April 2016 and the 2016 Pricing Policy. The Pricing Methodology outlines
the allocation methodology used to determine total revenue and pricing across all
customers. The Pricing Policy document describes pricing for individual domestic and
commercial customers on standard contracts.
3.19 TLC offers two standard pricing plans. The Standard User Pricing Plan is available to all
domestic and commercial customers. TLC also offers a Low Fixed Pricing Plan option for
eligible domestic customers, as required by The Electricity (Low fixed Charge Tariff
Option for Domestic Consumers) Regulations 2004. This is currently available to those
TLC consumers who have a maximum kW load of less than 2.65kW.
3.20 Pricing under the standard plans is made up of three primary types of charges:
• a maximum capacity charge
• dedicated asset charges
• a peak consumption charge.
3.21 The maximum capacity charge (which TLC calls its Network charge) is a charge based
on the maximum capacity of the connection the customer has with the distribution
network, measured in kVA. TLC recovers around 25 per cent of its revenue from
standard plans through this charge. Capacity is generally determined by the physical
capacity at the ICP when it was originally connected. A minimum capacity for residential
14
See http://www.ea.govt.nz/development/work-programme/pricing-cost-allocation/review-part-6-dg-pricing-
principles/development/authority-decision-on-the-review-of-dgpps-and-acot/
11 29 May 2017 11.13 a.m.The Lines Company Pricing and Load Control
connections of 5 kVA is used for charging purposes. TLC has a process in place that
allows a review of the installed capacity size.
3.22 Consumers who are eligible to be on the Low Fixed Pricing Plan option pay a fixed rate
of 15 cents a day (excluding GST) for the capacity component, instead of the kVA based
charge. To offset the reduction in capacity charge, they pay a higher rate per unit for the
peak consumption charge.
3.23 Dedicated asset charges recover costs associated with equipment that can be directly
linked to individual consumers. Around 10 per cent of TLC’s revenue from standard
plans is recovered through these charges. They include charges for relays (used to
switch loads on and off in response to load control signals), meters, and in some cases
supply-transformers. TLC charges for transformers separately when they supply fewer
than four ICPs. In those cases, capacity charges are reduced to offset the higher asset
charges.
3.24 Peak consumption charges are used to recover the bulk of the costs associated with
providing network services not otherwise recovered through the capacity or dedicated-
asset charges. Transmission-related costs are also recovered through these charges.
Peak charges recover around 65 per cent of TLC’s revenue from standard plans. The
peak consumption charges are based on an average of the customer’s top six peaks,
where the peaks are measured by taking average consumption over any two-hour period
at the times that load control is being used by TLC. A fixed dollars-per-KW rate is applied
to the average of the peaks.
3.25 The peak consumption charge is the main point of difference between TLC’s pricing
approach and the approach used by most other distribution companies. Generally,
distribution companies base the variable component of their charges on total
consumption rather than peak consumption.
3.26 A key feature of the peak consumption charges is the forward-looking nature of the
charges. Consumers’ peaks affect their pricing for the next pricing year, not the current
year. The six highest peaks for an individual consumer are used to determine the fixed
annual fee for that customer that will apply for the following year (broken into twelve
equal monthly invoices).
3.27 To avoid multiple peaks being linked to a single period of high consumption, TLC applies
a minimum of a five-hour gap between the end of any two-hour period designated as
one of the six highest peaks, and the start of the next eligible two-hour period.
3.28 Load control does not need to operate for the entire two-hour period for that period to be
eligible. Two-hour periods are measured forwards from any time that load control is
applied. The exact algorithm used to record consumption depends on the consumer’s
meter type.
3.29 Over the past few years, TLC has been rolling out AMI meters capable of recording
consumption at a 10 minute resolution. 15 As at 30 September 2016, 69% of meters in the
TLC area were AMI meters. 16 Over 99% of these have been installed by TLC’s fully
15
Advanced Metering Infrastructure (AMI) meters are also known as ’smart’ meters. Standard functionality for
AMI meters includes the ability to record and communicate half hourly or higher resolution demand data to a
central processing centre.
16
Source: Electricity Authority registry data. For additional metering statistics see the Metering Snapshot report
on the Authority’s data publication website at www.emi.ea.govt.nz .
12 29 May 2017 11.13 a.m.The Lines Company Pricing and Load Control
owned Metering Equipment Provider (MEP) subsidiary. TLC expects to replace most of
the remaining non-AMI meters over the next three years.
3.30 The majority of the AMI meters currently installed measure consumption over 10-minute
intervals. Those AMI meters that are not capable of recording over 10-minute intervals
are being replaced as part of TLC’s general AMI meter roll out.
3.31 Where the installed meter allows the recording of 10-minute data, the pricing algorithm
TLC uses to calculate peak demand includes only the electricity consumed within the 10-
minute interval when load control was operating.
3.32 Where the installed meter is an older AMI type that allows only half-hourly data
recording, peak measurement is based on consumption over the full half-hour where
load control was applied. TLC applies a 10% adjustment to peaks measured at half-hour
intervals to produce a result that is more equivalent to the measurements made by the
other meter types.
3.33 TLC estimates peak consumption for consumers who still have an old analogue (non-
AMI) meter by applying a profile to their total energy consumption. 17 TLC uses one of
three profiles (Standard, Dairy, or Temporary Accommodation), depending on the nature
of the individual consumer’s usage.
3.34 At present, consumers with AMI meters can opt out of pricing based on AMI meter
reading and use profile-based pricing, regardless of the type of meter that is installed. By
default, the consumer is automatically put on the pricing option that results in the lowest
charge for them. The Authority understands that TLC intends to discontinue the option to
opt out of AMI-based pricing within the next two years.
3.35 Another feature of TLC’s pricing that distinguishes it from other approaches is that TLC
invoices the property owner. At times this means the party paying the lines charges is
different to the party paying the energy bill. Responsibility for payment can be passed to
other parties on agreement with TLC. For example, landlords can arrange to have TLC
send invoices to tenants. An outcome of this approach is that TLC charges the owners of
vacant properties for capacity provided to that property, even though it is not necessarily
being used to deliver electricity.
4 Load control
TLC load control
4.1 Load control is widely used by distribution companies in New Zealand to manage
network congestion at times of high consumption, and during planned and unplanned
distribution and transmission outages. Distribution companies also use load control to
reduce their share of the interconnection transmission charges levied by Transpower.
4.2 Most controllable load is still managed through ‘ripple control’ systems. Ripple control
was first employed in New Zealand in the Waitemata region in 1949. Before this, pilot-
wire based systems were installed in some areas, and remain in use in some parts of
Auckland.
17
The profile estimates an average relationship between total consumption and consumption at peak times for
an individual consumer, based on detailed time-related energy consumption data from a representative
sample of similar consumers in the region.
13 29 May 2017 11.13 a.m.The Lines Company Pricing and Load Control
4.3 Ripple control systems send signals across power lines to remotely switch hot water
cylinders off and on, along with any other load that may be linked to the ripple control
system. 18 The systems use equipment installed at substations in the network to overlay
a high-frequency signal over the standard 50-hertz power frequency. The higher-
frequency signals are picked up by relays that are installed at each point of
consumption. When the relay recognises a certain combination of signals (referred to as
a channel) it will take the associated action (eg, turn off the circuit to the water heater).
Depending on the type of load control signalling system installed, signals can take up to
one minute from the start of the signal being sent until the relay recognises and takes
the instructed action.
4.4 TLC is part way through a project to replace the older ripple system equipment installed
in its network, much of which is between 45-50 years old. The older equipment uses a
higher 725 Hz frequency signal that does not propagate through the TLC network as well
as the lower 317 Hz system replacing it. The Authority notes that a number of other
distribution companies are undertaking similar replacement programs.
4.5 Load control is managed at the network region level shown in Figure 1. Most TLC
regions have around 10 channels dedicated to domestic water heating load control. 19
Each individual relay used for load control is programed to respond to a single randomly-
selected channel in order to distribute the effect of signalling a given channel
geographically across the region. When TLC applies load control it normally switches off
all controlled load in a given region at the same time (ie, signalling all 10 channels to turn
‘off’). Signalling controlled load to turn back ‘on’ is staggered to minimise the surge in
load across the network as each group of hot water cylinders is turned back on.
4.6 TLC’s load control management system is configured to apply load control whenever the
total load in the Lower North Island (LNI) exceeds a pre-specified value. That value is set
with the objective of ensuring that load control is operating at the times of the LNI peaks
that Transpower will use to determine transmission charges (see paragraphs 3.4 - 3.11
above). The actual peaks used for pricing by Transpower are not determined until the full
year used for peak calculations has passed. TLC sets the load control trigger value at a
level to cover a wide enough range of periods to minimise the chance of missing a peak
that ultimately contributes to calculation of transmission charges. The trigger value also
allows for load continuing to ramp up over the time it takes to complete the load control
process.
4.7 TLC may also load control at other times, such as managing supply during localised
system outages and during grid emergencies.
18
Ripple control systems are also used to manage activities such as turning street lighting on and off, and
signalling meters when to record consumption for applying night and day rates.
19
The number of active channels is currently higher than 10 in some areas because the transition between the
old and new load control equipment means that both systems are running in parallel until the older receiving
relays are replaced.
14 29 May 2017 11.13 a.m.The Lines Company Pricing and Load Control
Figure 6: Load control for a sample TLC region (one channel)
Source: Electricity Authority (underlying data supplied by The Lines Company)
Notes: 1. Sample data period 1 September 2015 – 31 August 2016
4.8 The above chart shows load control for a single channel for a single TLC region across a
full year ie, the load control that a single household in the sample region would
experience over the year. The chart clearly shows how load control is applied over the
morning and evening peak periods during winter.
Load control in other distribution areas
4.9 The Authority obtained sample load control data from a number of other distribution lines
companies to provide a comparison with TLC’s load control practices. Because the
characteristics of the various distribution networks vary widely, individual distributors
may use load control in very different ways.
15 29 May 2017 11.13 a.m.The Lines Company Pricing and Load Control
4.10 Figure 7 below contrasts the impact on a sample of different individual consumers in the
different distribution areas. Each chart shows the impact of load control on a single
consumer in that region over the course of a year. 20
Figure 7: Load control for sample regions across selected distribution companies
Source: Electricity Authority (based on distribution company data)
4.11 Orion and Counties apply more intermittent load control to individual consumers than
TLC and Horizon. This appears to be largely a reflection of the load control management
approach used by the individual companies, where Orion and Counties switch between
channels regularly during each load control period.
4.12 In total, TLC applied load control to the individual channel shown above for 264 hours
during 2015/16. Orion applied load control for 139 hours, Counties Power for 103 hours,
and Horizon Energy for 46 hours, to their respective channels shown above.
4.13 For those same channels, TLC applied load control on 82 of the 366 days in 2015/16,
Orion on 85 days, Counties Power on 61 days, and Horizon Energy on 28 days.
20
Data covers the period from 1 September 2015 to 31 August 2016 for all four distributors.
16 29 May 2017 11.13 a.m.The Lines Company Pricing and Load Control
Communication of TLC load control to consumers
4.14 TLC says on its website that “The need for load control is driven by a combination of
voltage and capacity requirements, cost avoidance for the use of Transpower assets and
emergency events.”
4.15 TLC’s website says further that “load control can happen at any time and for up to 12
hours a day”.
4.16 In most distribution areas, domestic consumers are largely unaware of when load control
is operating. Generally, load control will have only a marginal impact on hot water
temperatures, although consumers with under-insulated or under-sized hot-water
systems may be more likely to notice changes in water temperature.
4.17 TLC uses a number of tools to notify consumers of the current status of load control in
each of TLC’s network regions. Each tool requires some level of active monitoring on
the part of the consumer. The tools include:
(a) an interactive map on the main page of TLC’s web site. Each region is flagged as
either ‘Not Load Controlling’, ‘Currently Load Controlling’ or ‘Load Control
Pending’. The map also shows network asset outage information.
(b) a ‘Mobile App’ available for Android and Apple smartphones and tablets. The
application shows the same information as the website map and allows for
customers to be notified of pending load control.
(c) ‘SWITCHit’ devices available for hire from TLC. The devices are essentially a relay
that plugs into a standard 230-volt wall socket and which lights up when load
control is operating. The device includes a front socket where the consumer can
plug in equipment they want to switch off automatically when load control is
applied. TLC acknowledges that the SWITCHit devices are not 100% reliable at
picking up load control signals.
(d) where installed, the AMI meters at each ICP show information about the status of
load control on their in-built display.
Impact of TLC load control on service
4.18 Load control is generally recognised as providing significant benefits for consumers
when it efficiently defers the need for distribution and transmission investments. 21 The
benefits can vary significantly between areas, depending on how close to maximum
capacity network assets are operating at. A number of distributors, including TLC, are
replacing aging load control equipment.
4.19 Load control equipment is generally treated as part of the wider network asset-base for
the purposes of determining consumer network charges. In TLC’s case, charges for
receiving-relays appear separately on consumer invoices.
4.20 Depending on the nature of the individual network and its constraints, distributors make
trade-offs between the impact on consumers of using load control, and its usefulness in
21
Further material outlining work carried out by the Electricity Commission on load management in New
Zealand can be found at www.ea.govt.nz/about-us/what-we-do/our-history/archive/dev-
archive/consultations/retail-consultations/2007/load-management-value-and-pricing/ and
http://www.ea.govt.nz/about-us/what-we-do/our-history/archive/dev-archive/consultations/retail-
consultations/2009/property-rights-for-load-management-/
17 29 May 2017 11.13 a.m.The Lines Company Pricing and Load Control
managing peaks to reduce long-term network costs and transmission charges.
Occasionally some individual consumers may notice temperature effects on their hot
water supply as a result. This largely depends on when load control is dispatched, how
and when the consumer uses hot water, and the quality and size of the hot water
cylinder.
4.21 The way TLC incorporates load control into its pricing structure is unique. It potentially
places incentives on TLC’s use of load control that would not otherwise exist. It also
causes consumers to focus on the use of load control because of its implications for their
distribution charges. In contrast, consumers on other networks are typically unaware of
when load control is occurring.
4.22 In response to an online questionnaire published by the Authority, consumers made a
number of the comments about TLC’s use of load control (see Section 5 below). While
many of the comments related to the uncertainty around the operation of load control
and communication concerns, some consumers said they thought TLC was using load
control in an unreasonable way. Of the surveyed TLC consumers, 21% stated they had
experienced some effect on their hot water service.
4.23 TLC’s use of load control is influenced by a number of factors including the current
transmission pricing framework, the nature of their network, and their distribution pricing
methodology.
4.24 Figure 7 above illustrates differences in the use of load control across a number of
distributors. How often load control is used is driven mainly by a mix of requirements
arising from the characteristics of each network (whether associated with maintenance,
emergencies, or peak shaving to defer investment), the operational capability of the load
controlling equipment available to the distributor, and the incentives arising from the
current transmission pricing methodology. In TLC’s case though, there may also be
some incentives created by its linking with distribution pricing.
4.25 There do not appear to be any direct incentives on TLC to load control often, or over
extended periods of time, in order to meet their revenue targets. TLC’s pricing
methodology only requires TLC to load control for six periods during the year in order to
capture sufficient peaks to charge consumers. However, pricing from such a small set of
load measurements would create a much higher risk of ’surprise’ charging results for
individual consumers (both positive and negative).
4.26 TLC uses load control more constantly over peak periods than the other three
distribution companies discussed above. In TLC’s case, because of its link to pricing,
switching load control channels off-and-on regularly over a peak period could be
confusing and disruptive for consumers trying to monitor whether load control is
operating. The link between TLC’s pricing and load control may be therefore be creating
some incentives for TLC to load control steadily over peak periods. However, the current
TPM can also create similar incentives, depending on the characteristics of the load
being supplied and the amount of load control response available to the distributor.
4.27 The proposed changes to the guidelines for the transmission pricing methodology
outlined in paragraphs 3.4 - 3.11 above may significantly reduce the incentive for TLC to
apply load control across all six of its network regions to avoid transmission charges.
Existing peak constraints in the TLC network suggest that the level of load control
currently applied may not be required in all the regions solely for the purpose of
managing local constraints and emergencies. This suggests that under a future
transmission pricing methodology, if some areas of TLCs’ network remain relatively
18 29 May 2017 11.13 a.m.The Lines Company Pricing and Load Control
unconstrained, load control will yield less direct benefit for TLC consumers than under
the current methodology.
4.28 The Authority’s view is that while TLC is using load control more than the other
distributors we obtained data from (see paragraph 4.9 above), their use of load control is
consistent with the incentives created under the current TPM. The linking of load control
to distribution pricing may create some incentives with respect to TLC’s load control use,
but the Authority’s view is that these are muted relative to the incentives that are
associated with the current transmission pricing regime.
4.29 A useful benchmark for TLC’s use of load control is the service level applied by Orion,
the distributor for the central Canterbury region. Orion publishes a load control ‘service
level’ to help consumers make decisions about their hot water cylinder requirements.
The current service level is to turn off peak control water heaters for no more than four
hours in any eight-hour period.
4.30 The Authority compared that same service level to the TLC load control data. Figure 8
below shows the total hours of load control that was dispatched within an eight-hour
period, for each load control ‘event’.
Figure 8: Length of TLC load control events (year ended 31 August 2016)
Source: Electricity Authority (underlying data supplied by The Lines Company)
4.31 TLC exceeded Orion’s maximum four-hour service-level only four times. The two longest
periods of load control were across the morning and evening peaks of the same day. Of
the load control events measured, 97% fell within the Orion service level.
19 29 May 2017 11.13 a.m.The Lines Company Pricing and Load Control
4.32 The Authority believes the practice of publishing service-level guidelines for load control
should be adopted by all load-controlling distribution companies if they are not already
doing so. This would help consumers to correctly size water-heating systems to meet
their needs. Given the potential implications for existing consumers, consideration
should be given to the characteristics of the installed stock of water heating cylinders if
new or revised service-level guidelines are being published by distributors.
4.33 In summary, while TLC uses load control more than the other lines companies that
provided data for this review, this appears to be driven by TLC’s approach to manging
load in order to reduce transmission charges rather than any direct outcome of TLC’s
pricing approach. Given that TLC’s use of load control generally fits within Orion’s
published service levels, the Authority’s view is that TLC is not ‘over-using’ load control.
5 Consumer perceptions of TLC pricing
5.1 The Authority published a questionnaire on its website in September 2016 that asked
consumers about their experiences with TLC’s pricing approach. The questionnaire was
available for just under a month and was open to anyone who wished to comment. Its
purpose was to help the Authority gain sufficient understanding of consumers’ primary
areas of concern so that the Authority could conduct a more formally structured survey.
A total of 759 responses to the questionnaire were received through the website or by
letter.
5.2 The Authority engaged UMR Research to conduct a phone-based survey in the TLC
region. The survey of 500 TLC customers was carried out between 3 November 2016
and 8 November 2016. Initial filtering of potential survey respondents ensured that the
sample was representative of the demographic mix in the TLC region.
5.3 The full range of survey questions and responses is attached in Appendix B. Key results
are outlined in the following paragraphs.
5.4 Consumers were asked to rank their level of concern with TLC’s peak pricing
methodology from 1 to 5, with 1 indicating that they are ‘Very concerned’ and 5
indicating that they are ‘Not concerned at all’. The following table shows the distribution
of responses to that question by the 500 consumers surveyed.
Table 1: Consumer response to peak-pricing concern survey question
Level of concern % of respondents
1 Very concerned 50
2 13
3 13
4 6
5 Not concerned at all 12
Unsure 6
Source: Electricity Authority (UMR survey)
20 29 May 2017 11.13 a.m.The Lines Company Pricing and Load Control
5.5 Of those consumers who were concerned about peak pricing, 46% per cent said that
peak pricing was unfair, while 31% said that peak pricing was expensive.
5.6 Consumers were also asked to rank their level of understanding of how their lines
charges are determined. The following table shows the distribution of consumer
responses.
Table 2: Consumer response to level-of-understanding survey question
% of respondents
1 Totally understand 18
2 18
3 23
4 17
5 Have no understanding 22
Unsure 2
Source: Electricity Authority (UMR survey)
5.7 Of the 500 consumers surveyed, 14% indicated that they monitor when TLC is load
controlling. Those consumers that monitor load control use a variety of tools. Using a
SWITCHit device, using their AMI meter, and using a mobile app, all rated about the
same, with approximately 25% of the consumers who monitored load control using each
one. Of those consumers who monitored load control, 16% used internet monitoring.
5.8 Of the 500 consumers surveyed, 29% said they had taken permanent steps to reduce
their lines charges. Of those, approximately 33% had installed energy efficient lights,
30% were using a wood burner, 26% were using gas as an alternative energy source,
and 21% had bought energy efficient appliances.
5.9 Of the consumers surveyed, 15% reported that they had invested in alternative energy
sources because of the TLC charges. Of those, 50% had purchased wood-burners, 36%
purchased gas fuelled appliances or equipment, and 23% had bought solar photovoltaic
or solar hot water heating systems. The amount invested varied significantly. Of the
consumers who had invested in alternatives, 20% spent up to $500 and 25% spent more
than $5,000.
5.10 Forty-six per cent of the surveyed consumers said they took ongoing actions to reduce
charges, including turning lights off (88% of these said they did this ‘all the time’ or
‘daily’), turning off heating (55%) and cooking at a different time (39%).
5.11 Twenty-one per cent of consumers said they had experienced some sort of effect on
their hot water supply as a result of TLC load controlling.
5.12 When consumers were asked if they had experienced any adverse effects other than
financial impacts, 45% of consumers responded that they had. Forty-nine per cent of
consumers responded that they had not.
21 29 May 2017 11.13 a.m.You can also read