Reversible Adhesive Bio-Toe with Hierarchical Structure Inspired by Gecko
←
→
Page content transcription
If your browser does not render page correctly, please read the page content below
biomimetics

Article
Reversible Adhesive Bio-Toe with Hierarchical Structure
Inspired by Gecko
Liuwei Wang 1,2 , Zhouyi Wang 1,2, * , Bingcheng Wang 1 , Qingsong Yuan 1 , Zhiyuan Weng 1
and Zhendong Dai 1

 1 College of Mechanical and Electrical Engineering, Nanjing University of Aeronautics and Astronautics,
 Nanjing 210016, China
 2 Shenzhen Research Institute, Nanjing University of Aeronautics and Astronautics, Shenzhen 518063, China
 * Correspondence: wzyxml@nuaa.edu.cn

 Abstract: The agile locomotion of adhesive animals is mainly attributed to their sophisticated
 hierarchical feet and reversible adhesion motility. Their structure–function relationship is an urgent
 issue to be solved to understand biologic adhesive systems and the design of bionic applications.
 In this study, the reversible adhesion/release behavior and structural properties of gecko toes were
 investigated, and a hierarchical adhesive bionic toe (bio-toe) consisting of an upper elastic actuator
 as the supporting/driving layer and lower bionic lamellae (bio-lamellae) as the adhesive layer was
 designed, which can adhere to and release from targets reversibly when driven by bi-directional
 pressure. A mathematical model of the nonlinear deformation and a finite element model of the
 adhesive contact of the bio-toe were developed. Meanwhile, combined with experimental tests,
 the effects of the structure and actuation on the adhesive behavior and mechanical properties of
 the bio-toe were investigated. The research found that (1) the bending curvature of the bio-toe,
 which is approximately linear with pressure, enables the bio-toe to adapt to a wide range of objects
 controllably; (2) the tabular bio-lamella could achieve a contact rate of 60% with a low squeeze contact
 of less than 0.5 N despite a ±10◦ tilt in contact posture; (3) the upward bending of the bio-toe under
 negative pressure provided sufficient rebounding force for a 100% success rate of release; (4) the ratio
 of shear adhesion force to preload of the bio-toe with tabular bio-lamellae reaches approximately 12,
 which is higher than that of most existing adhesion units and frictional gripping units. The bio-toe
Citation: Wang, L.; Wang, Z.; Wang, shows good adaptability, load capacity, and reversibility of adhesion when applied as the basic
B.; Yuan, Q.; Weng, Z.; Dai, Z.
 adhesive unit in a robot gripper and wall-climbing robot. Finally, the proposed reversible adhesive
Reversible Adhesive Bio-Toe with
 bio-toe with a hierarchical structure has great potential for application in space, defense, industry,
Hierarchical Structure Inspired by
 and daily life.
Gecko. Biomimetics 2023, 8, 40.
https://doi.org/10.3390/
biomimetics8010040
 Keywords: bio-toe; reversible adhesion; hierarchical structure; gecko

Academic Editor: Giuseppe Carbone

Received: 31 December 2022
Revised: 12 January 2023 1. Introduction
Accepted: 13 January 2023 Mimicry of organisms in nature has inspired many significant inventions that have
Published: 16 January 2023 influenced the course of human civilization [1]. Animals have evolved pedipalps that
 form adhesive contact with environmental surfaces and give them the ability to regulate
 adhesion when foraging and escaping from natural predators, and the gecko is a good
 representative [2]. By investigating the adhesion mechanisms of geckos, researchers expect
Copyright: © 2023 by the authors.
 to develop bionic adhesion mechanisms/robots to operate under complex and challenging
Licensee MDPI, Basel, Switzerland.
 working conditions [3]. With in-depth understanding of the gecko’s hierarchical adhesion
This article is an open access article
 system and rapid progress in micro-nano fabrication/growth technologies, dry-adhesive
distributed under the terms and
 surfaces with microstructures similar to gecko bristles have been developed [4]. By opti-
conditions of the Creative Commons
Attribution (CC BY) license (https://
 mizing the structure and material of dry-adhesive surfaces, their adhesion performance can
creativecommons.org/licenses/by/
 meet or surpass that of the gecko itself. Grippers using adhesion technology are capable of
4.0/). grasping smooth surfaces, fragile components, and soft objects that are difficult to grasp by

Biomimetics 2023, 8, 40. https://doi.org/10.3390/biomimetics8010040 https://www.mdpi.com/journal/biomimetics
Biomimetics 2023, 8, 40 2 of 21

 conventional frictional grippers, which can be widely used in industrial assembly and intel-
 ligent agriculture [5,6]. In the space environment, adhesion mechanisms can reliably attach
 targets with a wide range of linear and rotational velocities, laying the foundation for space-
 craft maintenance, noncooperative target capture, and other operations [7]. Wall-climbing
 robots with dry-adhesive feet can climb various slopes [8,9], providing a good mobile plat-
 form for counterterrorism reconnaissance and disaster relief. However, the performance of
 adhesion mechanisms/robots still falls short of expectations, and the advantages of bionic
 dry adhesion have not been fully exploited in engineering applications.
 The toe of the gecko has a precise hierarchical structure from the microscopic to macro-
 scopic scale (spatula–seta–lamella–toe). It is widely accepted that van der Waals forces
 generated by the close contact between microscopic spatula pads and environmental sur-
 faces are the main sources of adhesion [10]. Mechanical tests on the single seta, setae arrays,
 and individual toe suggest that the reliable and rapid switching of the gecko’s adhesion
 and release largely depends on the control of the attachment/detachment angle [11]. In the
 natural configuration, the setae shafts are at an angle of approximately 30◦ to the substrate
 and do not generate adhesion forces. During adhesion, the toes roll in and shearly pull the
 setae to reduce the contact (attachment) angle, resulting in an adhesion force of 40 µN and
 a friction force of 200 µN for a single seta [12]. During release, the toes roll out, and the
 setae relax back to their initial free (natural) state with a significant decrease of more than
 three orders of magnitude in the adhesion and friction forces [13]. Moreover, the slender
 geometry and asymmetric structure contribute to quick adhesion and detachment [14]. The
 gecko-inspired geometry with a tilted pad attached to a curved beam can realize on/off
 switching of adhesion, with lateral sliding in addition to vertical debonding [15]. Soft lamel-
 lae act as a soft spring to sustain most of the normal deformation during preloading and
 maintain a wide range of adhesive states rather than a repulsive state [16,17]. In general, the
 hierarchical structural properties and flexible reversible adhesion/release behavior (rolling
 in/out) significantly contribute to the agile locomotion ability of geckos [18]. Therefore,
 for engineering applications of biomimetic adhesion technology, it is essential to fully
 integrate the lower adhesive layer and the upper supporting/driving layer of the adhesion
 mechanism from a systemic perspective.
 The adhesive devices for transferring flat targets consist of several flat adhesion
 units with wedge-shaped microstructured dry-adhesive surfaces. The adhesion units are
 symmetrically placed and realize the adhesion/release of delicate and fragile flat objects,
 such as silicon wafers, glass wafers, and circuit boards, by shear loading/unloading.
 However, the rigid supporting layer limits the adhesion range of the unit to flat surfaces,
 and the shear-driving mechanism complicates the adhesive device [6,19–21]. Similarly, flat
 adhesion units have also been used in the feet of wall-climbing robots. These units widen
 the range of climbing angles, but do not allow the robot to climb curved surfaces [9,22,23].
 Adhesion devices using tendon-driven underactuated structures [5,24–26], fluid-driven
 elastic actuators [27,28], or fabric bending actuators [29] as supporting and driving layers
 exhibit good drive flexibility and interaction safety. They can envelope and adhere to an
 extensive range of targets. However, owing to the nonlinear mechanical properties of the
 material and fluid drive, the mechanical response of the aforementioned soft adhesion
 devices is difficult to characterize accurately, reducing the controllability and stability of
 the adhesion. In addition, the excellent ability to adapt to objects does not guarantee
 the interfacial fit of the contact area [30], and the structural design for optimizing the
 interfacial adhesive contact has rarely been investigated [31]. In general, research on
 the biomimetic adhesive unit requires investigation of the geckos’ hierarchical adhesion
 system, clarification of the relationships between the upper supporting/driving layer
 and the lower adhesive layer (effects of the structural design, material characteristics,
 and driving property of the supporting/driving layer on the adhesion performance), and
 structure–drive–function integration of the adhesive unit.
 In this work, the gecko toe’s reversible adhesive behavior of rolling in/out and multi-
 layered structure properties are discussed. The design of a reversible bionic toe (bio-toe)
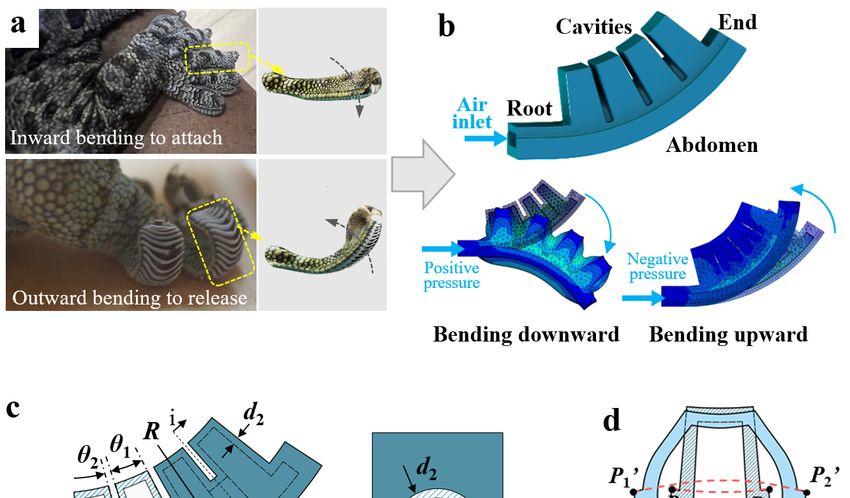
Biomimetics 2023, 8, 40 3 of 21

 with a hierarchical structure is proposed based on biological inspiration. The adhesive be-
 havior and mechanical properties of the bio-toe are analyzed by establishing mathematical
 and finite-element models. Combined with experimental tests, the effects of the structural
 properties and actuation on the adhesive performance of the bio-toe are investigated. Ad-
 hesive mechanisms based on the bio-toe for robotic grippers and wall-climbing robots
 are developed, and functional tests were performed to promote the application of bionic
 dry-adhesive technology.

 2. Design and Analysis
 2.1. Upper Supporting/Driving Layer: Elastic Actuator
 2.1.1. Design of the Structure and Mathematical Model
 The adhesion/release behavior of the gecko toe, captured by a high-speed camera
 (Figure 1a), shows that the toe bends downward until it adhered to the surface stably
 during adhesion and bends upward until it entirely separates from the surface during
 release. In general, a flexible toe with high freedom and bidirectional bending ability is the
 biological basis for the reversible adhesion of the gecko, and the muscle stretch provides the
 driving force for reliable adhesion and rapid release, respectively. Therefore, for adhesive
 bio-toes, flexible and controlled downward/upward bending is required for reversible
 adhesion and high adaptability, as well as sufficient structural stiffness and driving force to
 maintain stable adhesion and effective release.
 In engineering, mechanisms capable of controllable bending deformation mainly
 include electroactive polymers (IPMCs, DEAs, etc.), motor-driven joint mechanisms, and
 fluid-driven elastic actuators [32]. Among these, electroactive polymers usually have high
 requirements for the working environment and drive mode and are deficient in deformation
 rate and load capacity. Joint mechanisms have high strength and working accuracy, but
 they have low fault tolerance and are complex in structure and control. Fluid-driven elastic
 actuators have advantages in terms of flexibility, adaptability, interaction safety, and system
 simplicity, but are inferior to joint mechanisms in terms of operating accuracy and output
 forces. Because the reversible adhesion/release process is fast, the bio-toe should be flexible
 and have a high fault tolerance. In addition, because adhesion contact requires much less
 interfacial squeezing than friction [26], high output forces are not required. Therefore,
 the fluidic-driven elastic actuator shown in Figure 1b was designed as the toe’s upper
 supporting/driving layer, which consists of four internally connected square cavities and
 an abdomen. Owing to the limitation of the abdomen, the elastic actuator can bend upward
 and downward under bidirectional pressure. The initial state of the bio-toe is upward.
 This design ensures that when the bio-toe adheres to the flat substrate, there is a positive
 pressure inside to provide a preload for steady adhesion. In addition, it also increases the
 upward bending deformation of the bio-toe under negative pressure, which is conducive
 to the dry-adhesive surface reaching the critical detachment angle, contributing to rapid
 release from the substrate.
 Inspired by the mathematical modeling method proposed by Hao et al. [33], a mathe-
 matical model that captures both the geometrical properties of the elastic actuator and the
 applied pressure was established to describe the deformation (Figure 1d) of the bio-toe. To
 simplify the model and ignore some minor factors, we made a few simplifications: (1) the
 length of the abdomen was assumed to be constant; (2) the bio-toe deforms mainly by
 expanding or contracting the cavities, and the tensile deformation of the cavity surface is
 ignored; (3) the bending curvature of a single cavity is assumed to be the same as that of the
 bio-toe. Because the four cavities have the same geometry, we only analyzed the bending
 curvature of a single cavity (Figure 1d). For a single cavity, the axial (x-axis) stress σx and
 radial (y-axis) stress σy are as follows:

 P(wh1 − πr2 /2) cos(θ1 /2)
 σx = (1)
 2d2 h1 + d2 (w + 2d2 )
Biomimetics 2023, 8, 40 4 of 21

 Pw( R − d1 − h2 )
 σy = (2)
 2d2 ( R − d1 )
 where P is the air pressure applied to the inner wall of the cavity, h1 is the height of the
 cavity, h2 is the height of the airway, w is the width of the cavity, d1 is the thickness of the
 inextensible abdomen, d2 is the thickness of the cavity, R is the radius of the elastic actuator,
Biomimetics 2023, 8, x FOR PEER REVIEW
 r is the radius of the rib, θ1 is the fillet angle corresponding to a single cavity, and θ2 4isofthe
 22
 fillet angle corresponding to a single rib (Figure 1c).

 Figure
 Figure 1. (a)Reversible
 1. (a) Reversible adhesive
 adhesive behavior
 behavior of the
 of the gecko
 gecko toe.Gecko-inspired
 toe. (b) (b) Gecko-inspired fluidic-driven
 fluidic-driven elastic
 elastic actuator acting as the supporting/driving layer of the bio-toe and its upward/downward
 actuator acting as the supporting/driving layer of the bio-toe and its upward/downward bending
 bending deformation
 deformation when driven
 when driven by positive/negative
 by positive/negative pressure.
 pressure. (c) Schematic
 (c) Schematic of theofelastic
 the elastic actuator.
 actuator. (d)
 Illustration
 (d) Illustrationof the mathematical
 of the mathematical model
 model ofofthe
 thebending
 bendingdeformation.
 deformation.(e) (e)Fitting
 Fitting functions
 functions of the
 the
 strain–stress relationship
 strain–stress relationship for
 for the
 the elastic
 elastic actuator
 actuator onon the
 the xx and
 and yy axis.
 axis. (f)
 (f) Bending
 Bending curvatures
 curvatures of of the
 the
 elastic actuator versus pressure from the mathematical model, simulation, and experimental
 elastic actuator versus pressure from the mathematical model, simulation, and experimental results. results.

 In engineering,
 The deformationmechanisms capable
 of a single cavity of controllable
 along the axial and bending deformation
 radial directions is mainly in-
 clude electroactive polymers (IPMCs, DEAs, etc.), motor-driven joint mechanisms, and
 d x = l these,
 fluid-driven elastic actuators [32]. Among _ (σx )
 ε xelectroactive (3)
 polymers usually have high
 P1 P2 _x
 requirements for the working environment and drive mode and are deficient in defor-
 mation rate and load capacity. Jointdymechanisms
 = l P1 P3 _y ε y (σhave
 y) high strength and working accu-(4)
 racy, but they have low fault tolerance and are complex in structure and control. Fluid-
 driven elastic actuators have advantages in terms of flexibility, adaptability, interaction
 safety, and system simplicity, but are inferior to joint mechanisms in terms of operating
 accuracy and output forces. Because the reversible adhesion/release process is fast, the
 bio-toe should be flexible and have a high fault tolerance. In addition, because adhesion
 contact requires much less interfacial squeezing than friction [26], high output forces are
 not required. Therefore, the fluidic-driven elastic actuator shown in Figure 1b was de-
Biomimetics 2023, 8, 40 5 of 21

 _
 where l _ is the length of the projection of P1 P2 on the x-axis, l P1 P3 _y is the length of the
 P1 P2 _x
 projection of P1 P3 on the y-axis, ε x is a function of σx , and ε y is a function of σy , where

 l _ = 2( R − d1 − h2 − d2 ) sin[(θ1 + θ2 )/2] (5)
 P1 P2 _x

 l P1 P3 _y = (h1 /2 + h2 + r + d2 ) cos[(θ1 + θ2 )/2] (6)
 The relationship between ε and σ can be obtained by calibrating the finite element
 analysis (FEA) results. Here, we selected a set of specific elastic actuator parameters,
 obtained the function ε(σ ) to calculate the bending curvature of the actuator, and compared
 the results with those of physical experiments to verify the model. To get the function, we
 obtained the strain of the single cavity on the x and y axes under different pressures in the
 simulation and then fit the data with quadratic polynomial functions as follows:

 ε x = 3E − 05σx 2 + 0.0018σx + 0.0115 ( R2 = 0.9993) (7)

 ε y = 3E − 05σy 2 + 0.0014σy − 0.0012 ( R2 = 0.9999) (8)
 Figure 1e shows the fitness of the data functions. We defined the bending curvature of
 the single cavity as less than, equal to, and greater than zero in the upward, horizontal, and
 downward bending states, respectively.
 _
 By assumption, the length of P3 P4 remains constant. According to the Figure, the
 _ _
 center angles of P1 P2 and P3 P4 after expansion are the same, and defining C as the curvature
 after the deformation of m, the bending curvature C is given by

 l _
 0 0 l _
 P1 P2 P3 0 P4 0
 = (9)
 C −1 + (d1 /2 + h2 + r + d2 ) C −1

 where
 l _
 0 0
 = ( R − d1 /2 − h2 − r − d2 )(θ1 + θ2 ) + d x (10)
 P1 P2

 l _ =l _ = ( R − d1 /2)(θ1 + θ2 ) (11)
 P3 0 P4 0 P3 P4

 The bending curvature C of the single cavity/bio-toe is

 l _
 0 0
 −l _
 P1 P2 P3 P4
 C= (12)
 l _ (d1 /2 + h2 + r + d2 )
 P3 P4

 To verify the accuracy of the mathematical model, Figure 1f compares the bending
 curvatures of the elastic actuator with the structural parameters in Table 1 versus the
 pressure for the mathematical model, simulation, and experimental results (the simulation
 and experimental results are presented in Sections 2.1.2 and 4.1, respectively). All three
 results agree well, indicating that the bending curvature of the elastic actuator increases
 approximately linearly with increasing air pressure. In general, this mathematical model
 can qualitatively analyze the effects of structural parameters on the bending curvature of
 an elastic actuator. According to the model, the wider and higher the cavity and the thinner
 the wall, the better the bending performance of the elastic actuator.

 2.1.2. FEA Simulation of Elastic Actuators
 The mathematical model only describes the deformation of the elastic actuator but
 not the output force. Therefore, we systematically investigated the effects of the structural
 parameters and applied pressures on the bidirectional bending deformation and contact
 force of the elastic actuator through FEA. First, a set of specific elastic actuator parameters
 was selected as the basis (Table 1). Second, the effects of h1 , w, d1 , and d2 on the bending cur-
Biomimetics 2023, 8, x FOR PEER REVIEW 7 of 22

 d2 1.5
Biomimetics 2023, 8, 40 Thickness of the chamber 6 of 21

 Center angle of the chamber
 θ1 10

 vature C and contact forceangle
 Center of theofelastic
 θ2 under different pressures were
 the ribactuator 2 simulated
 and analyzed using the control
 Radius of thevariable R
 actuatormethod. Figure 2a shows the finite element
 65 models
 (FEMs) of bending deformations and r contact forces of elastic actuators under pressure
 Radius of the rib 6
 driving. The Mooney–Rivlin model that can accurately describe the mechanical properties
 of nonlinear flexible structures similar with the elastic actuator was used [30,34].
 The simulation results (Figure 2b) show that the bending curvatures and contact
 forces
 Table 1.ofValues
 elasticofactuators
 structural increase
 parameters with increasing
 of the air pressure, with the structural param-
 elastic actuator.
 eters affecting only the increment. The wider the cavity, the higher the cavity, and the
 Structural
 thinner the wall Parameters
 thickness, the larger the increase in bending Values (mm) C and contact
 curvature
 force. According
 Height to of Section 2.1.1,
 the chamber h1the bio-toe should be sufficiently16flexible to conform to
 different curvature
 Height ofsurfaces
 the airwayandh2 sufficiently strong to preload for stable
 4 interfacial adhe-
 Widthelastic
 sion. Therefore, of the chamber
 actuators w with low cavity widths, heights, 20 and high wall thick-
 nessesThickness of the inextensible
 were excluded. However,layer d1 cavity width and height directly
 a large 3 increase the size
 Thickness of the chamber d2 1.5
 and fabrication difficulty of the
 Center angle of the chamber θ1
 elastic actuator [34] and the sensitivity
 10
 of the bending de-
 formation and contact force to
 Center angle of the rib θ2 the change in pressure, which increases
 2 the control diffi-
 culty. In general,
 Radiusthe structural
 of the actuator Rparameters of the elastic actuator 65 were determined to be
 identical to those listed
 Radius rib r 1.
 in Table
 of the 6

 Figure 2. (a) Finite element models of the elastic actuator’s bending deformation and contact force
 under pressure drive. (b) Simulation results of the effects of width of the chamber w, height of the
 chamber h1 , thickness of the inextensible layer d1 , and thickness of the chamber d2 on the bi-directional
 bending curvature and contact force of the elastic actuator under pressure drive.
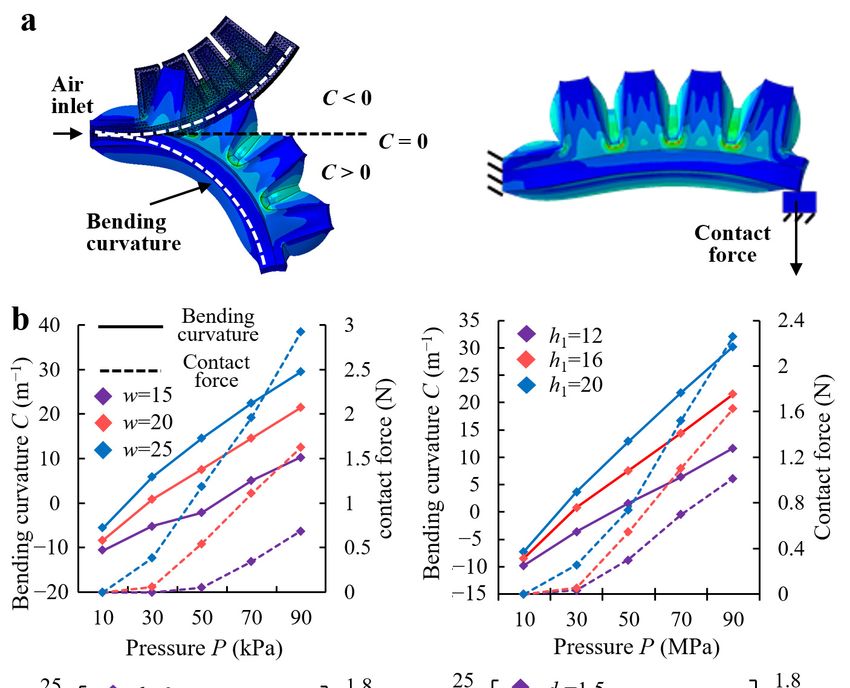
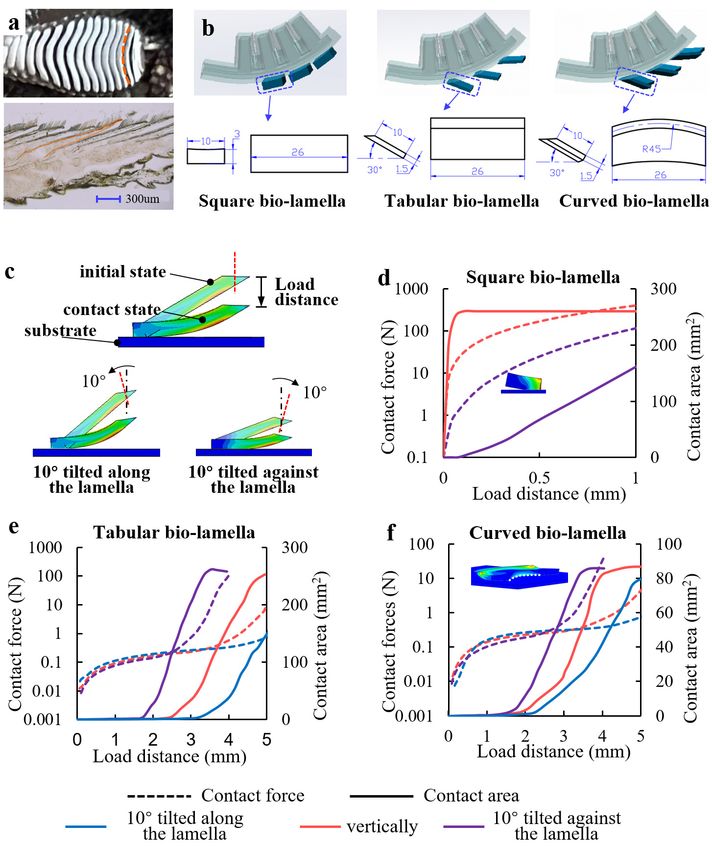
Biomimetics 2023, 8, 40 7 of 21

 The simulation results (Figure 2b) show that the bending curvatures and contact forces
 of elastic actuators increase with increasing air pressure, with the structural parameters
 affecting only the increment. The wider the cavity, the higher the cavity, and the thinner the
 wall thickness, the larger the increase in bending curvature C and contact force. According
 to Section 2.1.1, the bio-toe should be sufficiently flexible to conform to different curvature
 surfaces and sufficiently strong to preload for stable interfacial adhesion. Therefore, elastic
 actuators with low cavity widths, heights, and high wall thicknesses were excluded. How-
 ever, a large cavity width and height directly increase the size and fabrication difficulty of
 the elastic actuator [34] and the sensitivity of the bending deformation and contact force
 to the change in pressure, which increases the control difficulty. In general, the structural
 parameters of the elastic actuator were determined to be identical to those listed in Table 1.

 2.2. Lower Adhesive Layer: Bio-Lamella
 2.2.1. Design of Three Types of Bio-Lamellae
 Dry adhesion has high requirements for the contact state (high contact rate and low
 contact force). As shown in Figure 3a, the lamellae of the gecko toe are discrete and
 uniformly distributed, which helps to avoid the rapid expansion of local adhesion failure
 to the entire adhesion area and enhances the adhesion stability. The longitudinal frozen
 slicing of the lamellae shows that they are in a tabular shape with an angle of 20◦ to 35◦
 to the abdomen of the toe, giving the lamellae a soft spring-like property that enhances
 contact adaptation and reduces contact impacts [17]. The bottom view of the lamellae
 suggests that the end profile of the lamellae can be approximated as a circular arc with a
 radius of approximately 1.7–2 times the radial width of the toe, and it was proposed that
 the gecko pulls the curved lamellae with tendons to control the contact angle for reversible
 adhesion [13]. Therefore, we designed three types of bionic lamellae (bio-lamellae): square,
 tabular, and curved bio-lamellae (Figure 3b). The bio-toe has three bio-lamellae that act as
 an adhesive layer. Mushroom-shaped microstructured adhesive surfaces [35] are attached
 to the outer side of the bio-lamellae (Figure 4a).

 2.2.2. FEA Simulation of Bio-Lamellae
 The behavior and mechanical characteristics of the three bio-lamellae in contact with
 a flat substrate were also explored in the simulation. Taking the tabular bio-lamella as
 an example, three types of FEMs of the tabular bio-lamella under three contact modes
 (vertically, 10◦ tilted along the lamella, and 10◦ tilted against the lamella) were established
 (Figure 3c). The simulation result for the contact force and contact area versus the load
 distance of the square bio-lamella is shown in Figure 3d. Because of the axially symmetrical
 structure of the square bio-lamella, the simulation results of contact at 10◦ tilted along
 and against the lamella are the same. When contacting vertically, the contact area rises
 rapidly to a peak of 260 mm2 (100% contact rate) within 0.05 mm of load distance and
 then remains stable. The contact force also increases sharply to approximately 30 N and
 continues to increase with increasing load distance. However, when the square bio-lamella
 makes contact of 10◦ tilted along (against) the lamella, the area decreases sharply relative
 to the vertical contact. When the contact force is close to 100 N at a load distance of 1 mm,
 the contact area is 160 mm2 (60% contact rate). The simulation results for the contact
 characteristics of the tabular and curved bio-lamellae are shown in Figures 3e and 3f,
 respectively, with similar trends. The contact force of the two bio-lamellae under the three
 contact modes is stable at less than 0.5 N, increases slowly (we refer to this interval as
 “low squeeze contact”), and then increases rapidly to more than 10 N with increasing load
 distance. The distances of low squeeze contact are approximately 4.5, 3.5, and 2.5 mm for
 the two bio-lamellae making contact against the lamella, vertically, and along the lamella,
 respectively. The contact area initially remains almost constant and increases rapidly and
 approximately linearly toward the end of the low-squeeze contact. At the end of the low-
 squeeze contact, the contact areas of the tabular and curved bio-lamellae reach 150 mm2
 (58% contact rate) and 50 mm2 (19% contact rate), respectively. Subsequently, as the contact
Biomimetics 2023, 8, 40 8 of 21

 force increases rapidly, the contact area increases at a similar rate, until it plateaus. The
 final steady contact areas for the tabular and curved bio-lamellae are 250 mm2 (96% contact
Biomimetics 2023, 8, x FOR PEER REVIEW 9 of 22
 rate) and 85 mm2 (30% contact rate), respectively.
 The simulation results indicate that the square bio-lamella can achieve complete
 contact more quickly than the other two bio-lamellae when in vertical contact. However,
 asmall
 slightdistance
 tilt in the(less than posture
 contact 0.1 mm)can of the lowcause
 easily squeeze contact,
 a sudden dropindicating low contact
 in the contact area and ro-
 bustness. The tabular and curved bio-lamellae achieve an average
 a small distance (less than 0.1 mm) of the low squeeze contact, indicating low contact low squeeze contact of
 approximately 3 mm with tilted contact postures. The tabular bio-lamella
 robustness. The tabular and curved bio-lamellae achieve an average low squeeze contact achieves a con-
 tact
 of rate of nearly360%
 approximately mmat lowtilted
 with preloads below
 contact 0.5 N, The
 postures. implying
 tabular high contact adaptability
 bio-lamella achieves a
 and robustness.
 contact However,
 rate of nearly 60% atthelowcurved bio-lamella,
 preloads below 0.5which is morphologically
 N, implying high contactclosest to the
 adaptability
 biological
 and lamella,
 robustness. has only
 However, theone-third of the adhesive
 curved bio-lamella, whichcontact rate of the tabular
 is morphologically closest bio-la-
 to the
 mella. Thelamella,
 biological reasonhas for only
 this can be found
 one-third inadhesive
 of the the simulation
 contact(Figure
 rate of the3f),tabular
 as the curved bio-
 bio-lamella.
 The reason
 lamella foradequately
 is not this can be contacted
 found in the simulation
 because (Figure
 of reverse 3f), asinthe
 warping thecurved
 middlebio-lamella
 part when
 is
 it not
 is inadequately
 contact with contacted because ofInreverse
 the flat substrate. general,warping in the
 the tabular middle part
 bio-lamella haswhen it isdis-
 a longer in
 contact
 tance from withthe the flat substrate.
 low-squeeze In general,
 contact than thethe tabular
 other bio-lamella has
 two bio-lamellae, a longer
 allowing distance
 a larger part
 from
 of thethe low-squeeze
 lamella contact
 to fit the thanwith
 substrate the other twocontact
 a lower bio-lamellae, allowing
 force. In addition,a larger part of bio-
 the tabular the
 lamella
 lamellatoisfit the substrate
 more robust towith a lower
 changes contact force.
 in posture In addition, the
 and disturbances tabular
 in the bio-lamella
 external environ- is
 more
 ment.robust to changes in posture and disturbances in the external environment.

 Figure 3.3. (a)
 Figure (a) Longitudinal
 Longitudinal frozen
 frozen slicing
 slicing and
 and bottom
 bottom view
 view of
 of the
 thegecko
 geckotoe’s
 toe’slamellae.
 lamellae. (b)
 (b) Three
 Three
 gecko-inspired
 gecko-inspired bio-lamellae:
 bio-lamellae: square, tabular,
 tabular, and
 and curved
 curved bio-lamella.
 bio-lamella. (c)
 (c) Finite
 Finite element
 element models
 models of of
 the tabular
 the tabular bio-lamella’s
 bio-lamella’s behavior
 behavior and
 and mechanical
 mechanical characteristics
 characteristics when
 when contacting
 contacting aa flat
 flatsubstrate
 substrate
 underthree
 under threecontact
 contactmodes
 modes(vertically,
 (vertically,10
 10° tiltedalong
 ◦ tilted alongthe
 thelamella,
 lamella,and
 and 10
 10° tilted against
 ◦ tilted against the
 the lamella).
 lamella).
 Simulation results of contact force and contact area versus load distance for the (d) square,
 Simulation results of contact force and contact area versus load distance for the (d) square, (e) tabular, (e) tab-
 ular, and (f) curved bio-lamellae.
 and (f) curved bio-lamellae.

 2.3. Hierarchical Adhesive Bio-Toes
 The bio-toe consists of an elastic actuator and three bio-lamellae. The elastic actuator
 acts as the supporting/driving layer, and the bio-lamellae cemented with a dry-adhesive
 surface [35] acts as the adhesive layer. To investigate the effects of the structural differ-
 ences of the bio-lamellae on the adhesive contact performance of the bio-toe, four types of
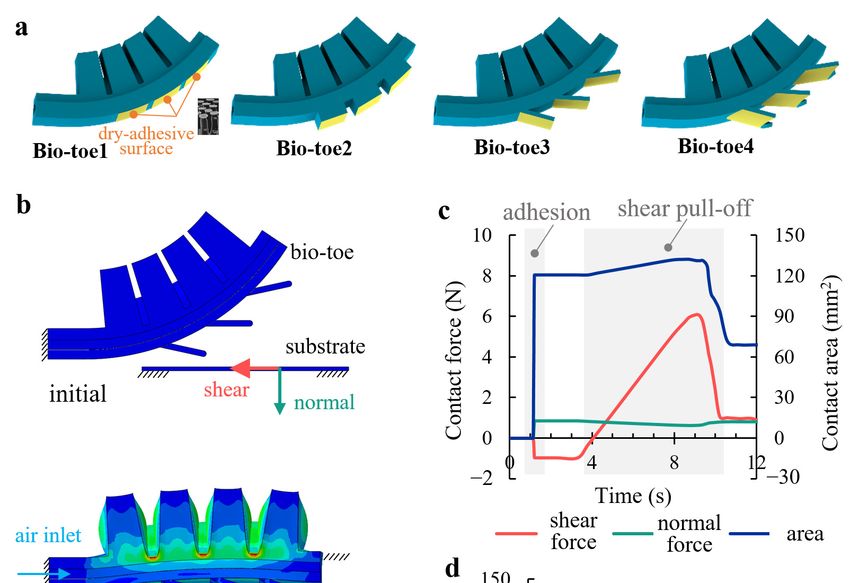
and 2 reach peaks of 41.2 and 25 mm2 at 40 kPa, respectively. The greatest difference is at
 50 kPa, where the contact areas of bio-toe3 are 91.2, 106.6, and 39.7 mm2 more than those
 of bio-toe1, 2, and 4, respectively. The maximum shear adhesion force of the bio-toe when
 pulling off from the substrate is positively correlated with the contact area. In general, the
Biomimetics 2023, 8, 40 simulation results further validate that the tabular and curved bio-lamellae have better9 of 21
 contact adaptability and can improve the contact rate of the bio-toes.

 Figure 4. (a) Four types of bio-toes. (b) Finite element model of bio-toe3 during adhesion to and
 shear pull off from the flat surface. (c) Simulation results of the contact behavior and mechanical
 properties. (d) Contact areas of the four bio-toes in adhesion versus applied pressure.

 2.3. Hierarchical Adhesive Bio-Toes
 The bio-toe consists of an elastic actuator and three bio-lamellae. The elastic actuator
 acts as the supporting/driving layer, and the bio-lamellae cemented with a dry-adhesive
 surface [35] acts as the adhesive layer. To investigate the effects of the structural differences
 of the bio-lamellae on the adhesive contact performance of the bio-toe, four types of bio-
 toes were designed (Figure 4a): an elastic actuator without bio-lamellae (bio-toe1), with
 three square bio-lamellae (bio-toe2), with three tabular bio-lamellae (bio-toe3), and with
 three curved bio-lamellae (bio-toe4). FEMs of the four bio-toes adhering to and shearly
 pulling off from the flat surface were developed to analyze their contact behavior and
 mechanical properties, and the bio-toe3 is taken as an example in Figure 4b. Figure 4b,c
 show the two simulation steps (adhesion and shear pull-off) and contact properties of
 bio-toe3, respectively. During adhesion, bio-toe3 bends downward and adheres to a fixed
 substrate under positive pressure. At this point, the bio-toe applies a shear forward force
 and normal preload to the substrate, and the contact area increases rapidly from zero to
 a steady value. During shear pull-off, the bio-toe contacts tightly with the substrate, and
 the shear adhesion force increases rapidly and approximately linearly, whereas the normal
 contact force decreases very slowly. When the adhesion limit is reached, both the contact
 forces and area rapidly decrease. Figure 4d shows the contact area of the bio-toe in the
 adhesion step versus the applied pressure. The contact areas of all four toes shows an
 increasing and then decreasing trend with increasing pressure. The area of bio-toe3 is the
 highest throughout, increasing from 17 mm2 at 20 kPa to a peak of 128 mm2 at 50 kPa
 and dropping back to 78.9 mm2 at 0.07 MPa. The contact area of bio-toe2 is the second
 highest throughout, reaching a peak of 57.4 mm2 at 50 kPa. The contact areas of bio-toe1
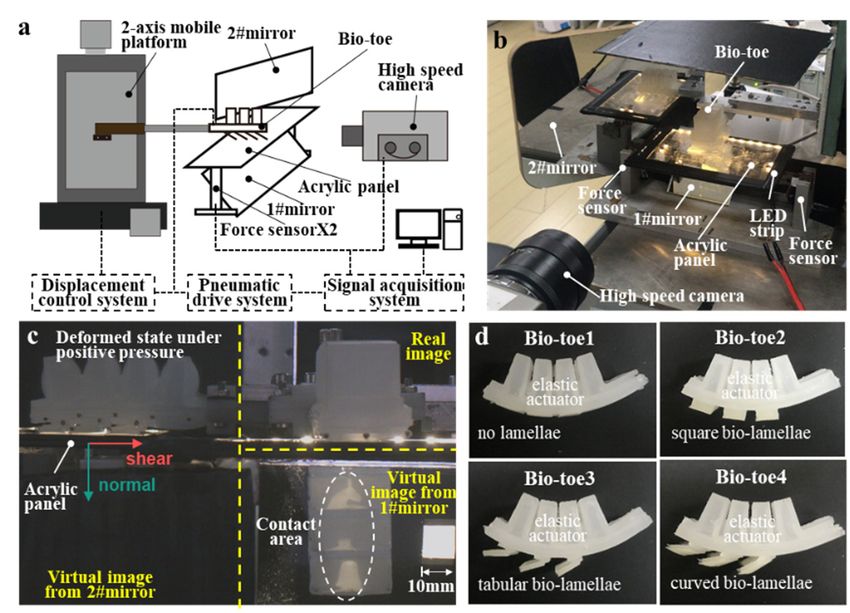
Biomimetics 2023, 8, 40 10 of 21
Biomimetics 2023, 8, x FOR PEER REVIEW 11 of 22

 and 2 reach peaks of 41.2 and 25 mm2 at 40 kPa, respectively. The greatest difference is at
 50 kPa,
 Figure 4. where
 (a) Fourthe contact
 types areas of(b)
 of bio-toes. bio-toe3 are 91.2,model
 Finite element 106.6,ofand 39.7 mm
 bio-toe3 2 more
 during than those
 adhesion to andof
 shear pull off
 bio-toe1, from 4,
 2, and the flat surface. (c)
 respectively. TheSimulation
 maximum results
 shearof adhesion
 the contactforce
 behavior
 of theand mechanical
 bio-toe when
 properties.
 pulling off (d)from
 Contact
 the areas of theisfour
 substrate bio-toes correlated
 positively in adhesionwithversus applied
 the contactpressure.
 area. In general, the
 simulation results further validate that the tabular and curved bio-lamellae have better
 3.contact
 Experimental Setup
 adaptability and can improve the contact rate of the bio-toes.
 A synchronous testing platform for the adhesive contact state and mechanics was
 3. Experimental
 built to evaluate the Setup
 deformation and adhesion properties of the bio-toe. A schematic of
 A synchronous
 the platform is showntesting platform
 in Figure 5a. Twofor the adhesive
 two-axis contact
 force state
 sensors and range:
 (force mechanics±100was built
 N; res-
 to evaluate
 olution: 0.1%the Fs) deformation
 were fixed paralleland adhesion
 to each properties of the bio-toe.
 other at a distance of 140.0A ±schematic
 5.0 mm on of an
 the
 platform isplate.
 aluminum shown Twoin Figure
 ends on 5a.the
 Two two-axis
 long side offorce sensors (force
 a transparent range:
 acrylic ±100
 panel N; resolution:
 (150 × 100 × 4
 0.1%that
 mm) Fs) acts
 wereasfixed parallel to
 the adhered each other
 substrate at a distance
 are fixed to the top of of
 140.0
 each ±sensor
 5.0 mmtoon an aluminum
 form a gantry-
 like two-axis force testing platform. An LED strip was then wound aroundmm)
 plate. Two ends on the long side of a transparent acrylic panel (150 × 100 × 4 the that acts
 acrylic
 as theAccording
 panel. adhered substrate are fixedoftofrustrated
 to the principle the top oftotal
 eachreflection
 sensor to [36],
 formthea gantry-like
 area at which two-axis
 the
 force testing
 bio-toe contacts platform. An LED
 the substrate strip was
 generates then wound
 a facula around the acrylic
 with significantly higher panel. According
 brightness than
 to the
 the principlearea
 non-contact of frustrated
 (Figure 5c), total reflection
 which [36], the for
 is convenient area at whichthe
 extracting thecontact
 bio-toe area
 contacts
 by
 the substrate generates a facula with significantly higher brightness
 computer graphics processing. A flat # 1 mirror was mounted under the acrylic panel at than the non-contact
 anarea (Figure
 angle of 45°,5c),
 and which is convenient
 another # 2 mirrorfor wasextracting
 mountedthe on contact
 the sidearea byacrylic
 of the computer panelgraphics
 at an
 processing. A flat # 1 mirror was mounted under the acrylic
 angle of 45° to its transverse symmetry. A high-speed camera (FLIR, Portland, Oregon, panel at an angle of 45◦ , and
 another
 USA) was# placed
 2 mirror was mountedtoon
 perpendicular thethe side of the acrylic
 longitudinal symmetry panelof at
 theanacrylic of 45◦ toAs
 angle panels. its
 transverse
 shown symmetry.
 in Figure 5c, the A high-speed
 high-speed camera
 camera (FLIR, Portland,
 recorded Oregon,
 the distribution of USA) was placed
 the contact area
 perpendicular to the longitudinal symmetry of the acrylic panels.
 from mirror #1 and the deformed state of the bio-toe # 2 mirror. The bio-toe was fixed to As shown in Figure 5c,
 the high-speed camera recorded the distribution of the contact
 a two-axis mobile platform and could move freely on the laterally symmetrical surface of area from mirror #1 and the
 deformed
 the state ofMarkers
 acrylic panel. the bio-toewere # 2drawn
 mirror.withThe abio-toe
 black was
 pen onfixed
 thetoabdominal
 a two-axis side
 mobile platform
 of the bio-
 and could move freely on the laterally symmetrical surface
 toe, and the coordinate information of the markers was extracted by computer graphics of the acrylic panel. Markers
 were drawn with a black pen on the abdominal side of the bio-toe, and the coordinate
 processing to calculate the bending curvature. The prototypes of the four bio-toes (Figure
 information of the markers was extracted by computer graphics processing to calculate the
 5d) were fabricated by the “simultaneous molding and assembly” method [34] using a
 bending curvature. The prototypes of the four bio-toes (Figure 5d) were fabricated by the
 PDMS silicone rubber material. The elastic moduli of the upper elastic actuator and lower
 “simultaneous molding and assembly” method [34] using a PDMS silicone rubber material.
 bio-lamella were 3 and 1 MPa, respectively.
 The elastic moduli of the upper elastic actuator and lower bio-lamella were 3 and 1 MPa,
 respectively.

 (a)Diagram
 Figure5.5.(a)
 Figure Diagramofofthe
 thesynchronous
 synchronoustesting
 testingplatform
 platformofofadhesive
 adhesivecontact
 contactstate
 stateand
 andmechanics.
 mechanics.
 (b)Synchronous
 (b) Synchronoustesting
 testingplatform.
 platform.(c)(c)AAframe
 framefrom
 fromthe
 thevideo
 videocaptured
 capturedbybythe
 thehigh-speed
 high-speedcamera.
 camera.
 (d)
 (d)Prototypes
 Prototypesofofthe
 thefour
 fourbio-toes.
 bio-toes.

 4. Results
 4.1. Bending Deformation
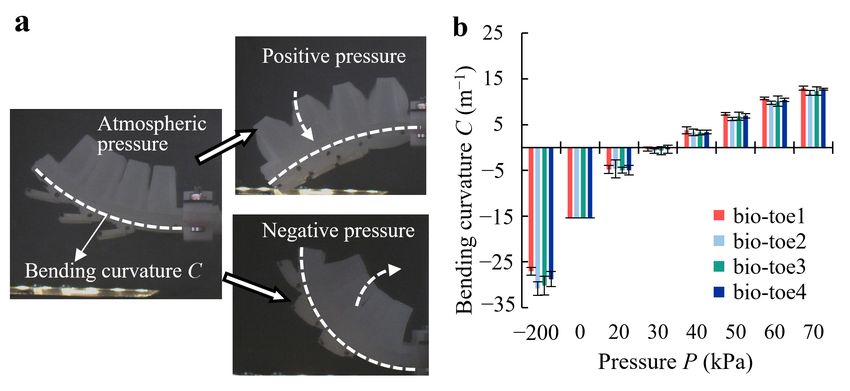
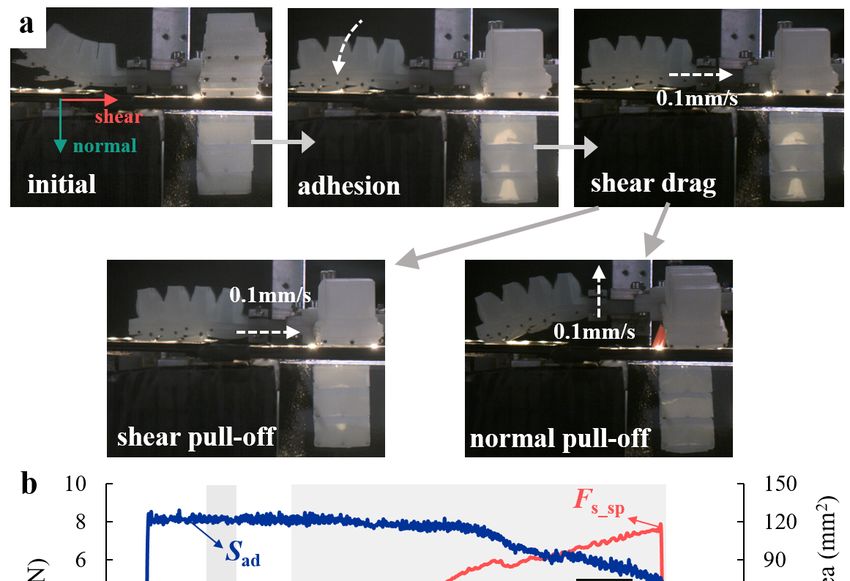
Biomimetics 2023, 8, 40 11 of 21

Biomimetics 2023, 8, x FOR PEER REVIEW 12 of 22

 4. Results
 4.1. Bending Deformation
 The bio-toe was fixed on the mobile platform, and negative air pressure of −200 kPa
 The bio-toe was fixed on the mobile platform, and negative air pressure of −200 kPa
 and positive pressure varying from 20 to 70 kPa at 10 kPa intervals was applied in se-
 and positive pressure varying from 20 to 70 kPa at 10 kPa intervals was applied in sequence.
 quence. Figure 6a shows the bending states of the bio-toe under atmospheric, positive,
 Figure 6a shows the bending states of the bio-toe under atmospheric, positive, and negative
 and negative pressure, respectively. The bending curvature C of the four bio-toes versus
 pressure, respectively. The bending curvature C of the four bio-toes versus pressure is
 pressure is shown in Figure 6b. According to the definition in Section 2.1, the curvature of
 shown in Figure 6b. According to the definition in Section 2.1, the curvature of the bio-toe
 the bio-toe is negative when bending toward the back and positive when bending toward
 is negative when bending toward the back and positive when bending toward the front.
 the front. Under positive pressure, the curvature of all four toes increases approximately
 Under positive pressure, the curvature of all four toes increases approximately linearly
 linearly with increasing pressure ( = 0.9839, = 0.9828, = 0.9801,
 with increasing pressure (R2unit1 = 0.9839, R2unit2 = 0.9828, R2unit3 = 0.9801, R2unit4 = 0.9833). It
 = 0.9833). It approaches zero at approximately 30 kPa, indicating that the bio-toes bend to
 approaches zero at approximately 30 kPa, indicating that the bio-toes bend to a horizontal
 a horizontal state. The difference in bending curvature between the four bio-toes is slight,
 state. The difference in bending curvature between the four bio-toes is slight, with the
 with the bending deformation of bio-toe1 being slightly higher than that of the remaining
 bending deformation of bio-toe1 being slightly higher than that of the remaining three
 three bio-toes.
 bio-toes.

 Figure 6.
 Figure (a) State
 6. (a) State of
 of the
 the bio-toe
 bio-toe under
 under atmospheric, positive, and
 atmospheric, positive, and negative
 negative pressure.
 pressure. (b)
 (b) Bending
 Bending
 curvature of the four bio-toes versus pressure.
 curvature

 4.2. Adhesion Performance
 4.2. Adhesion Performance
 Figure 7a shows the procedure for testing the shear and normal adhesion perfor-
 Figure 7a shows the procedure for testing the shear and normal adhesion perfor-
 mance of the four bio-toes. (1) Adhesion: the fixed bio-toe gradually bends toward the
 mance of the four bio-toes. (1) Adhesion: the fixed bio-toe gradually bends toward the
 abdomen under positive pressure, contacting and adhering to the force-measuring plat-
 abdomen under positive pressure, contacting and adhering to the force-measuring plat-
 form. (2) Shear drag: a shear forward force is applied to the substrate when the bio-toe
 form. (2) Shear drag: a shear forward force is applied to the substrate when the bio-toe
 adheres to the substrate, which is similar to the simulation (Figure 4c), indicating that the
 adheres to the substrate, which is similar to the simulation (Figure 4c), indicating that the
 bio-toe does not adhere stably. Therefore, the moving platform is controlled to drag the
 bio-toe does not adhere stably. Therefore, the moving platform is controlled to drag the
 bio-toe horizontally toward its root at 0.1 mm/s and stop when the shear adhesion force
 bio-toe horizontally toward its root at 0.1 mm/s and stop when the shear adhesion force
 reaches zero. (3) Shear/normal pull-off: the moving platform is controlled to move horizon-
 reaches zero. (3) Shear/normal pull-off: the moving platform is controlled to move hori-
 tally/vertically at 0.1 mm/s until the bio-toe separates from the force-measuring platform.
 zontally/vertically
 We measured at 0.1 mm/s until
 shear/normal the bio-toe
 adhesion separates
 performance of from thebio-toes
 the four force-measuring
 under positive plat-
 form.
 air pressures varying from 20 to 70 kPa at 10 kPa intervals. Figure 7b,c show typical curves
 We measured
 of tangential force,shear/normal
 normal force,adhesion
 and contactperformance
 area versus of the four
 time forbio-toes
 bio-toe3under
 in shearpositive
 and
 air pressures varying from 20 to 70 kPa at 10 kPa intervals. Figure 7b,c
 normal adhesion performance tests, respectively. The behavior and mechanical properties show typical curves
 of tangential
 during adhesionforce, normal
 and shearforce,
 drag ofandtwo contact area versus
 tests were the same. timeTheforbio-toe
 bio-toe3 in sheartoand
 adhered the
 normal adhesion performance tests, respectively. The behavior
 substrate, applying a shear forward force and a normal preload (defined as Fpre and mechanical properties
 ) during
 during
 adhesion. adhesion and shear
 Meanwhile, the drag of two
 contact areatests were the
 increased same.from
 rapidly The zero
 bio-toe
 to adhered
 a steady to the
 value
 substrate, applying a shear forward force and a normal preload (defined
 (defined as Sad ). The shear forward force returned to zero after shear drag. During shear as F pre ) during
 adhesion. Meanwhile,
 pull-off (Figure 7b), the the contact
 bio-toe made area increased
 tight rapidly
 contact with the from zero and
 substrate, to athe
 steady
 shearvalue (de-
 adhesion
 fined
 force as Sad). Therapidly
 increased shear forward force returned
 and approximately to zero
 linearly, after shear
 whereas drag. During
 the normal contactshear
 forcepull-
 and
 off (Figure 7b), the bio-toe made tight contact with the substrate,
 contact area decreased very slowly. When the shear adhesion force reached its peak, theand the shear adhesion
 force
 adhesionincreased rapidly andfailed
 instantaneously approximately
 (the shear linearly,
 adhesionwhereas
 force and thethe
 normal
 normal contact
 contact force and
 force at
 contact
 the moment before failure are defined as Fs_sp and Fn_sp ), and the contact area droppedthe
 area decreased very slowly. When the shear adhesion force reached its peak, to
 adhesion instantaneously
 zero instantaneously. Thefailed
 shear(the
 force shear adhesion
 did not drop to force
 zero and the normal contact
 instantaneously owing force at
 to the
 the moment
 friction. before to
 According failure are defined
 the small graphs as Fs_sp and
 in Figure 7b,Fn_sp
 the),contact
 and theareas
 contact areabio-lamellae
 of three dropped to
 zero instantaneously.
 decreased The shear
 simultaneously. Duringforce did not
 normal drop to
 pull-off zero instantaneously
 (Figure owing toforce
 7c), the shear adhesion the
 friction. According to the small graphs in Figure f, the contact areas of three bio-lamellae
 decreased simultaneously. During normal pull-off (Figure 7c), the shear adhesion force
Biomimetics 2023, 8, x40FOR PEER REVIEW 1312ofof 22
 21

 increased
 increased rapidly
 rapidly for
 for aa short
 short period
 period andand then
 then decreased
 decreased slightly.
 slightly. This
 This isis because
 because thethe two
 two
 bio-lamellae the root
 bio-lamellae near the root were
 werereleased
 releasedfrom
 fromthe
 thesubstrate,
 substrate,according
 according totothethe small
 small graphs
 graphs in
 Figure
 in 7c.7c.
 Figure Meanwhile,
 Meanwhile, thethe
 contact areaarea
 contact decreased to another
 decreased stable
 to another contact
 stable state.state.
 contact AfterAfter
 that,
 the shear
 that, adhesion
 the shear force continued
 adhesion to increase
 force continued as the normal
 to increase as thecontact
 normalforce slowly
 contact decreased
 force slowly
 to a negative
 decreased to avalue, indicating
 negative value,that the interfacial
 indicating that thecontact statecontact
 interfacial changed from
 state compression
 changed from
 to adhesion. When the adhesion force reached its peak, the adhesion failed
 compression to adhesion. When the adhesion force reached its peak, the adhesion failed instantaneously
 (the shear adhesion
 instantaneously (the force
 shearand the normal
 adhesion force contact
 and theforce at the
 normal moment
 contact force before
 at thefailure
 moment are
 before as Fs_np
 definedfailure areand Fn_npas
 defined ). Fs_np and Fn_np).

 Figure 7.
 Figure (a) Flow
 7. (a) Flow of
 of the
 the adhesion
 adhesion performance
 performance test
 test of
 of the
 the bio-toe.
 bio-toe. Typical
 Typical curves
 curves of
 of shear
 shear force,
 force,
 normal force,
 normal force, and
 and contact
 contact area
 area versus
 versus time
 time for
 for the
 the bio-toe
 bio-toe in
 in the
 the (b)
 (b) shear
 shear and
 and (c) normal adhesion
 adhesion
 performance
 performance tests.

 Figure 8a,b
 Figure 8a,b show
 show the the results
 results of
 of the
 the normal
 normal preload
 preload (F pre)) and
 (Fpre and the
 the area
 area when
 when it it comes
 comes
 into adhesion
 into adhesion (S(Sad
 ad),), respectively. The FFpre
 respectively. The ofall
 preof allfour
 four bio-toes
 bio-toes increased
 increased steadily
 steadily with
 with air
 air
 pressure in small increments and was stable within 1.2N overall. The
 pressure in small increments and was stable within 1.2N overall. The difference in Fpre difference in F pre
 between the
 between the four
 four bio-toes
 bio-toes was was slight
 slight but
 but fluctuated
 fluctuated greatly. The S
 greatly. The Sad of all
 ad of all four
 four bio-toes
 bio-toes
 showed aa trend
 showed trend of
 offirst
 firstincreasing
 increasingandandthen
 thendecreasing
 decreasingwith thethe
 with increasing air pressure.
 increasing The
 air pressure.
 S of bio-toe3 was the highest throughout, peaking at 125 mm 2 at 50 kPa. The greatest
 The
 ad Sad of bio-toe3 was the highest throughout, peaking at 125 mm2 at 50 kPa. The greatest
 difference was
 difference was at
 at 50
 50 kPa,
 kPa, where the S
 where the Sad of bio-toe3 was 9.4, 7.7, and 1.9 times greater than
 ad of bio-toe3 was 9.4, 7.7, and 1.9 times greater than
 that of
 that of bio-toe1,
 bio-toe1, 2,
 2, and
 and 4, 4, respectively.
 respectively.
pression, and the opposite is adhesion. The Fn_np of bio-toe3 and 4 was less than 0 N
 throughout, reaching the negative peak of −1.1 N at 40 kPa and −0.71 N at 60 kPa, respec-
 tively. The Fs_np of all four bio-toes showed a trend of first rising and then falling with the
 increasing air pressure. The Fs_np of bio-toe3 was the highest throughout, peaking at 4.3 N
 at 60 kPa and then falling back slightly. The Fs_np of bio-toe4 was second only to bio-toe3
Biomimetics 2023, 8, 40 throughout. The greatest difference was in the range of 40~60 kPa, where the Fs_np of 13 bio-
 of 21
 toe3 was 3.8, 2.8, and 1.5 times greater than that of bio-toe1, 2, and 4, respectively.

 Figure 8. (a)
 Figure 8. (a) Normal preload FFpre
 Normal preload and (b) adhesion contact area S ad of
 pre and (b) adhesion contact area Sad
 of the
 the four
 four bio-toes
 bio-toes during
 during the
 the
 adhesion performance
 performance tests.
 tests.(c)
 (c)Normal
 Normaladhesion forceFF
 adhesionforce and
 and
 n_sp
 n_sp (d)(d) shear
 shear adhesion
 adhesion force
 force Fs_sp
 Fs_sp of
 of the
 the
 fourfour bio-toes
 bio-toes during
 during the adhesion
 the adhesion performance
 performance test
 test of of shear
 shear pull-off.
 pull-off. (e) Normal
 (e) Normal adhesion
 adhesion forceforce
 Fn_np
 Fn_np and (f) shear adhesion force Fs_np of the four bio-toes during the adhesion performance test of
 normal pull-off.

 Figure 8c,d show the results of the normal contact force (Fn_sp ) and shear adhesion
 force (Fs_sp ) at shear pull-off. The Fn_sp of all four bio-toes increased approximately linearly
 with the increasing air pressure from about 0.15 N at 20 kPa to about 1 N at 70 kPa
 (R2unit1 = 0.9903, R2unit2 = 0.9675, R2unit3 = 0.8449, R2unit4 = 0.9524). The difference in Fn_sp
 between the four bio-toes was slight but fluctuated widely. The Fs_sp of all four bio-toes
 showed a trend of first rising and then falling with the increasing air pressure. The Fs_sp of
 bio-toe3 was the highest throughout, peaking at 7.5 N at 50 kPa. The greatest difference
 was at 50 kPa, where the Fs_sp of bio-toe3 was 6.3, 2.7, and 1.7 times greater than that of
 bio-toe1, 2, and 4, respectively.
 Figure 8e,f show the results of the normal contact force (Fn_np ) and shear adhesion force
 (Fs_np ) at normal pull-off. A force greater than 0 N means that the interface is compression,
 and the opposite is adhesion. The Fn_np of bio-toe3 and 4 was less than 0 N throughout,
 reaching the negative peak of −1.1 N at 40 kPa and −0.71 N at 60 kPa, respectively. The
 Fs_np of all four bio-toes showed a trend of first rising and then falling with the increasing
 air pressure. The Fs_np of bio-toe3 was the highest throughout, peaking at 4.3 N at 60 kPa
 and then falling back slightly. The Fs_np of bio-toe4 was second only to bio-toe3 throughout.
away from the platform (the bio-toe cannot achieve 100% release success rate when pas-
 sive releasing). We measured active and passive release performances of the four bio-toes
 with positive air pressure varying from 20 to 70 kPa at 10 kPa intervals in the adhesion
 procedure.
 The typical curves of shear and normal forces versus time for bio-toe3 in the active
Biomimetics 2023, 8, 40 and passive release performance tests are shown in Figure 9b and Figure 9c, respectively. 14 of 21
 The behavior and mechanical properties during adhesion and shear drag are similar to
 those in shear adhesion performance test (Figure 7b). During active release (Figure 9b),
 the bio-toe
 The greatestwas subjected
 difference was toin
 −200
 thekPa
 rangepressure
 of 40~60instantaneously
 kPa, where theand bent
 Fs_np oftowards
 bio-toe3 the wasback
 3.8,
 rapidly, generating a shear impulse force F and a
 2.8, and 1.5 times greater than that of bio-toe1, 2, and 4, respectively.
 s_ar normal impulse force F n_ar , respec-
 tively. After that, the impulse forces fell back to zero quickly, indicating a successful re-
 4.3.
 lease.Active/Passive
 In addition,Release
 there isPerformance
 more than one shear impulse force, indicating that the discrete
 bio-lamellae
 Figure 9a may not be released
 illustrates the test from the substrate
 procedure synchronously. release
 for the active/passive The normal impulse
 performance
 force
 of thedecreased
 bio-toe. The from positive toofnegative,
 procedures indicating
 the adhesion an interfacial
 and shear drag arenormal
 the same adhesion
 as those gen-
 in
 erated at the moment of release.
 Section 4.2. (1) Active release: the bio-toe bends toward the back rapidly under nega-
 During passive
 tive pressure of −200release, the bio-toe
 kPa, releasing andtended to return
 separating fromtotheitsforce
 initialmeasuring
 upward state, with
 platform.
 rebound
 (2) Passiveforces pulling
 release: the bio-lamellae
 the bio-toe tends to returnaway to from the upward
 its initial substrate. Only
 state the atmospheric
 under bio-lamellae
 near the end
 pressure, awayof the
 from bio-toe can release
 the platform (thefrom the substrate,
 bio-toe generating
 cannot achieve 100%arelease
 shear impulse
 successforce rate
 Fs_pr and
 when a normal
 passive impulse
 releasing). Weforce Fn_pr, respectively.
 measured Due torelease
 active and passive the lackperformances
 of active upward of thebend-
 four
 bio-toes with positive
 ing deformation, air pressure
 the adhesion forcevarying frombio-lamella
 of the root 20 to 70 kPawasatlarger
 10 kPathanintervals in the
 the rebound
 adhesion procedure.
 force, resulting in failure to release from the substrate.

 Figure 9. (a) Flow of the active/passive release performance test of the bio-toe. Shear and normal
 forces of the bio-toe during the (b) active and (c) passive release test.

 The typical curves of shear and normal forces versus time for bio-toe3 in the active
 and passive release performance tests are shown in Figures 9b and 9c, respectively. The
 behavior and mechanical properties during adhesion and shear drag are similar to those in
 shear adhesion performance test (Figure 7b). During active release (Figure 9b), the bio-toe
 was subjected to −200 kPa pressure instantaneously and bent towards the back rapidly,
 generating a shear impulse force Fs_ar and a normal impulse force Fn_ar , respectively. After
 that, the impulse forces fell back to zero quickly, indicating a successful release. In addition,
 there is more than one shear impulse force, indicating that the discrete bio-lamellae may not
 be released from the substrate synchronously. The normal impulse force decreased from
 positive to negative, indicating an interfacial normal adhesion generated at the moment
 of release.
 During passive release, the bio-toe tended to return to its initial upward state, with
 rebound forces pulling the bio-lamellae away from the substrate. Only the bio-lamellae near
 the end of the bio-toe can release from the substrate, generating a shear impulse force Fs_pr
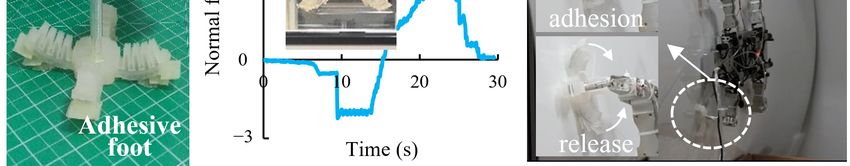
Biomimetics 2023, 8, x FOR PEER REVIEW 16 of 22
Biomimetics 2023, 8, 40 15 of 21

 Figure 9. (a) Flow of the active/passive release performance test of the bio-toe. Shear and normal
 and
 forcesa of
 normal impulse
 the bio-toe during the F(b)
 force , respectively.
 active
 n_pr Duerelease
 and (c) passive to the test.
 lack of active upward bending
 deformation, the adhesion force of the root bio-lamella was larger than the rebound force,
 We define
 resulting theto
 in failure active release
 release fromforce Far of the bio-toe as the combined force of Fs_ar and
 the substrate.
 Fn_ar,We
 anddefine
 the passive release
 the active releaseforce Fpr as
 force Farthe combined
 of the bio-toe force
 as theof Fs_pr and force
 combined Fn_pr. of
 The Far and
 Fs_ar and
 FFn_ar
 pr of all four
 , and the bio-toes (Figureforce
 passive release 10) showed a trend
 Fpr as the of firstforce
 combined increasing
 of Fs_prand
 andthenFn_prgently
 . The de-
 Far
 creasing
 and Fpr ofwith the increasing
 all four air pressure.
 bio-toes (Figure The greatest
 10) showed a trend ofdifference in Far and
 first increasing and Fprthen
 wasgently
 in the
 range of 50–70
 decreasing withkPa,
 the where bothair
 increasing Farpressure.
 and Fpr ofThebio-toe2 reached
 greatest aboutin2 F
 difference N,ar which
 and Fprwas was1.5–
 in
 the range
 2 times of 50–70
 higher thankPa,
 thatwhere both Fand
 of bio-toe3 ar and Fpr of
 4. The Farbio-toe2 reached
 of bio-toe1 and about 2 N,as
 2, as well which
 the Fwas
 pr of

 1.5–2 times
 bio-toe2, higher
 were than that affected
 significantly of bio-toe3 by and 4. The FarIn
 air pressure. ofcontrast,
 bio-toe1 theandF2, ar as
 of well as the
 bio-toe3 andFpr4
 of
 wasbio-toe2,
 stable in were
 the significantly
 range of 0.5 affected
 N to 1.2 by air pressure. In contrast, the Far of bio-toe3 and 4
 N overall.
 was stable in the range of 0.5 N to 1.2 N overall.

 Figure 10. Active and passive release force of the four bio-toes.
 Figure 10. Active and passive release force of the four bio-toes.
 We also used statistics on the release success rate of the active and passive release,
 We also used statistics on the release success rate of the active and passive release,
 respectively. The release success rates of active release of the four bio-toes were all 100%.
 respectively. The release success rates of active release of the four bio-toes were all 100%.
 However, the release success rate of passive release of bio-toe1, 2, 3, and 4 were 100%, 87%,
 However,
 0%, and 0%,therespectively.
 release success rate of passive
 For bio-toe2, the airrelease of range
 pressure bio-toe1,
 for 2, 3, and 4 release
 successful were 100%,
 was
 87%, 0%,
 50–70 kPa. and 0%, respectively. For bio-toe2, the air pressure range for successful release
 was 50–70 kPa.
 4.4. Application in Robotic Gripper and Climbing Robot
 4.4. Application
 The bio-toes in can
 Robotic Gripper
 be used and Climbing
 as basic adhesiveRobot
 units in a robotic gripper or at the end of a
 The bio-toes
 wall-climbing canIn
 robot. bethis
 used as basic
 study, adhesive
 we placed twounits in a robotic
 bio-toes gripper
 oppositely on aor at the end
 parallel frameof
 a wall-climbing
 to robot. In gripper,
 assemble an adhesive this study, we placed
 which two bio-toes
 can control oppositely
 the opening angleonof athe
 parallel
 pair offrame
 two
 to assemble
 bio-toes an adhesive
 according to thegripper,
 size of thewhich can In
 target. control the opening
 the gripping angle of11a),
 test (Figure the pair
 dozensof two
 of
 bio-toes according to the size of the target. In the gripping test (Figure
 objects used in daily life and large smooth hemispheres (difficult to gripped by conventional 11a), dozens of
 objects used in daily life and large smooth hemispheres (difficult to
 friction grippers [26,30] were randomly selected as gripped targets, covering rigid and gripped by conven-
 tional friction
 flexible objects,grippers
 even soft [26,30]
 fluidwere randomly
 objects. selected gripper
 This adhesive as gripped targets, covering
 demonstrated rigid
 versatility.
 and flexible
 Relying objects,
 on the even
 contact soft fluid objects.
 adaptability This adhesive
 of bio-toes, the grippergripper
 coulddemonstrated
 effectively fitversatil-
 targets
 ity. Relying
 with on the
 cylindrical contactspherical
 surfaces, adaptability of bio-toes,
 surfaces (smooththe gripper could
 hemispheres witheffectively
 radius from fit 75
 targets
 mm
 to 150cylindrical
 with mm), right-angle
 surfaces,surfaces,
 sphericalirregular surfaceshemispheres
 surfaces (smooth (cups, mice),with
 andradius
 soft surfaces
 from 75(soft
 mm
 snack
 to 150 bag
 mm), and water bag)
 right-angle and achieve
 surfaces, irregularstable adhesive
 surfaces gripping
 (cups, without
 mice), and soft damaging
 surfaces (soft or
 transitionally squeezing the surface. Not only that, but the gripper was
 snack bag and water bag) and achieve stable adhesive gripping without damaging or tran- capable of gripping
 weights
 sitionallyofsqueezing
 2 kg, showing a good load
 the surface. Not capacity.
 only that, but the gripper was capable of gripping
 We integrated
 weights the adhesive
 of 2 kg, showing a goodgripper into an automatic adhesive gripping system, which
 load capacity.
 can identify and locate the target through a vision module and drive the adhesive gripper
 to the appropriate position to grip the target and place it at the specified location through a
 robot arm (Figure 11b). This adhesive gripping system, with the good inherent flexibility of
 the soft bio-toes and the large stable adhesive space of the adhesive gripper, could realize
 the reversible adhesive gripping and release of the large curved surface, flexible and easily
 deformed snacks, fragile eggs, etc. The automatic adhesive gripping system demonstrated
 good interaction safety and gripping diversity and stability. In the future, it can be applied
 to agricultural picking, industrial grasping, medical rehabilitation, and other fields.
You can also read