Reveal the Heterogeneity in the Tumor Microenvironment of Pancreatic Cancer and Analyze the Differences in Prognosis and Immunotherapy Responses ...
←
→
Page content transcription
If your browser does not render page correctly, please read the page content below
ORIGINAL RESEARCH
                                                                                                                                                published: 17 February 2022
                                                                                                                                             doi: 10.3389/fonc.2022.832715

                                              Reveal the Heterogeneity in the
                                              Tumor Microenvironment of
                                              Pancreatic Cancer and Analyze the
                                              Differences in Prognosis and
                                              Immunotherapy Responses of
                                              Distinct Immune Subtypes
                                              Xiaoqin Wang 1*†, Lifang Li 2†, Yang Yang 3†, Linlin Fan 1, Ying Ma 1 and Feifei Mao 4*
                             Edited by:
                               Fu Wang,
         Xi’an Jiaotong University, China     1 Department of Clinical Laboratory, The First Affiliated Hospital of Xi’an Jiaotong University, Xi’an, China, 2 Emergency

                          Reviewed by:        Department, The First Affiliated Hospital of Xi’an Jiaotong University, Xi’an, China, 3 Department of Hepatobiliary and
                               Yi Xianfu,     Pancreatic Surgery, The First People’s Hospital of Changzhou, Changzhou, China, 4 Tongji University Cancer Center,
     Tianjin Medical University, China        Shanghai Tenth People’s Hospital, School of Medicine, Tongji University, Shanghai, China
                           Meng Wang,
University of California, San Francisco,
                           United States      Purpose: The current clinical classification of pancreatic ductal adenocarcinoma (PDAC)
                    *Correspondence:          cannot well predict the patient’s possible response to the treatment plan, nor can it predict
                             Feifei Mao       the patient’s prognosis. We use the gene expression patterns of PDAC patients to reveal
                  maofeifei01@126.com
                          Xiaoqin Wang
                                              the heterogeneity of the tumor microenvironment of pancreatic cancer and analyze the
            xiaoqinwang2@outlook.com          differences in the prognosis and immunotherapy response of different immune subtypes.
     †
      These authors have contributed          Methods: Firstly, use ICGC’s PACA-AU PDAC expression profile data, combined with the
                 equally to this work
                                              ssGSEA algorithm, to analyze the immune enrichment of the patient’s tumor
                      Specialty section:      microenvironment. Subsequently, the spectral clustering algorithm was used to extract
            This article was submitted to     different classifications, the PDAC cohort was divided into four subtypes, and the
                      Cancer Imaging and
           Image-directed Interventions,
                                              correlation between immune subtypes and clinical characteristics and survival prognosis
                  a section of the journal    was established. The patient’s risk index is obtained through the prognostic prediction
                    Frontiers in Oncology
                                              model, and the correlation between the risk index and immune cells is prompted.
         Received: 10 December 2021
           Accepted: 19 January 2022          Results: We can divide the PDAC cohort into four subtypes: immune cell and stromal cell
          Published: 17 February 2022         enrichment (Immune-enrich-Stroma), non-immune enrichment but stromal cell enrichment
                              Citation:       (Non-immune-Stroma), immune-enriched Collective but non-matrix enrichment (Immune-
         Wang X, Li L, Yang Y, Fan L,
       Ma Y and Mao F (2022) Reveal
                                              enrich-non-Stroma) and non-immune enrichment and non-stromal cell enrichment (Non-
       the Heterogeneity in the Tumor         immune-non-Stroma). The five-year survival rate of immune-enrich-Stroma and non-
      Microenvironment of Pancreatic
                                              immune-Stroma of PACA-CA is quite different. TCGA-PAAD’s immune-enrich-Stroma
                Cancer and Analyze the
          Differences in Prognosis and        and immune-enrich-non-Stroma groups have a large difference in productivity in one
           Immunotherapy Responses            year. The results of the correlation analysis between the risk index and immune cells
         of Distinct Immune Subtypes.
              Front. Oncol. 12:832715.
                                              show that the patient’s disease risk is significantly related to epithelial cells, megakaryocyte-
      doi: 10.3389/fonc.2022.832715           erythroid progenitor (MEP), and Th2 cells.

Frontiers in Oncology | www.frontiersin.org                                            1                                       February 2022 | Volume 12 | Article 832715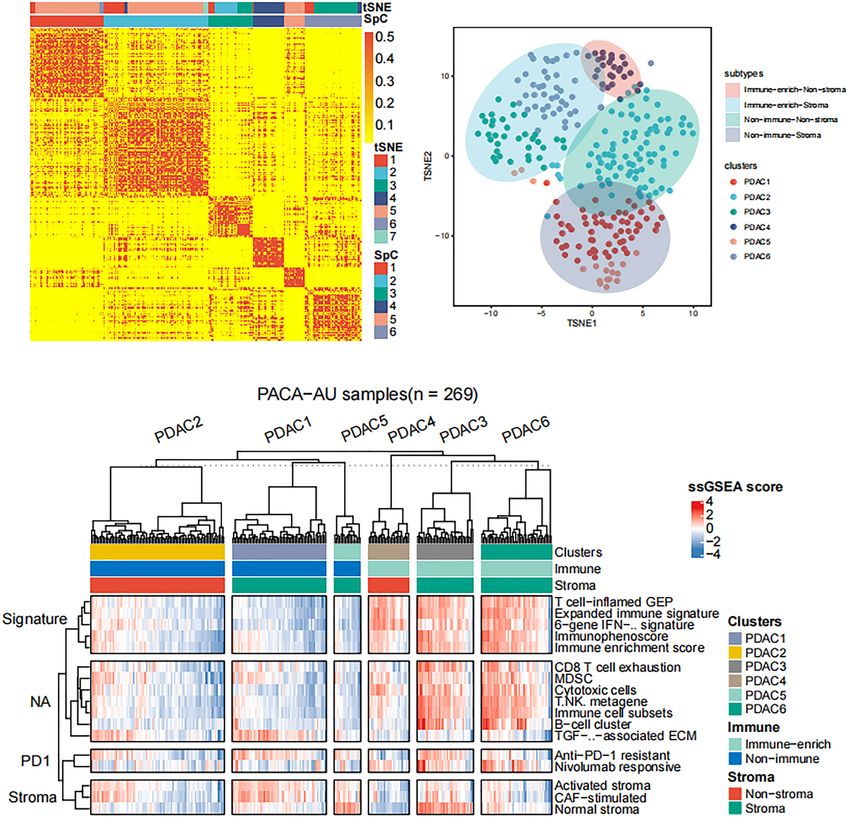
Mao et al. Heterogeneity in Pancreatic Cancer Microenvironment
Conclusion: The tumor gene expression characteristics of pancreatic cancer patients are
related to immune response, leading to morphologically recognizable PDAC subtypes
with prognostic/predictive significance.
Keywords: pancreatic cancer, immune subtypes, heterogeneity, prognosis, microenvironment
INTRODUCTION abnormally differentiated endocrine and exocrine (ADEX)
subtypes correspond to the quasi-mesenchymal, classical, and
Pancreatic ductal adenocarcinoma (PDAC) is one of the lethal exocrine-like subtypes reported by Collisson et al. (22). Recently,
malignant neoplasms around the world (1–4), and its genetic and studies have shown that ADEX and immunogenic subtypes are
phenotypic heterogeneity makes generally effective therapies related to the lower purity of the sample (24, 25). Although
ineffective (5–9). The salient feature of pancreatic cancer is that researchers have basically determined the characteristics of some
it has an immunosuppressive microenvironment, the prognosis of pancreatic cancer subtypes, research conclusions about exocrine
patients is poor, and most of the patients’ tumors will metastasize differentiation or immunogenic subtypes are still inconsistent.
(10, 11). Research on the immune microenvironment of Therefore, we aim to redefine the subtypes of PDAC and
pancreatic cancer may help improve the therapeutic effect (12, clarify its immune expression patterns, provide useful clues for
13). By detecting the expression of anti-tumor immune genes, exploring the different immunosuppressive mechanisms of
markers that can predict patient response to treatment have been PDAC, and use it in the stratification of patient clinical trials,
screened (14). In addition, mutations in genes such as PIK3CA, so as to provide patients with PDAC more precise treatment.
FGFR3, and TP53 have been shown to be related to tumor
immune infiltration (15–18). Although we have a better
understanding of the molecular mechanism and genetic RESULTS
background of pancreatic cancer, the 5-year survival rate for this
disease is approximately 10% in the USA (19). Several phase III Classification of Distinct Tumor
clinical trials that are effective for other cancers have not worked Microenvironment Subtypes
well in pancreatic cancer patients (7). Tumor heterogeneity and Single sample gene set enrichment analysis (ssGSEA) defines an
host differences will affect the characteristics of its tumor enrichment score to indicate the absolute enrichment degree of
microenvironment. It is necessary to identify new biomarkers the gene set in each sample in a given data set. The enrichment
and explore new treatment approaches to provide more and more score of each immune category can be found in the R package
effective references for overcoming the immunosuppressive GSVA In the realization (26). Firstly, ssGSEA algorithm (27) was
mechanism in the pancreatic cancer microenvironment. utilized to analyze the expression profiling database of the
The immune microenvironment plays an important role in PACA-AU pancreatic cancer in the International Cancer
tumor cell invasion and pancreatic cancer progression (20), and Genome Consortium (ICGC). We obtained the immune
immune expression characteristics may affect the degree of enrichment of the tumor microenvironment of each patient’s
inhibition of cancer cells. Invasive PDAC has epithelial-to- tumor tissue. And the tumor microenvironment-related genes
mesenchymal transition (EMT)-like characteristics and has come from the following references (Table 1).
been shown to be a poor prognostic factor for pancreatic Subsequently, we apply the spectral clustering algorithm to
cancer (21). The immune microenvironment with EMT-like extract different categories based on the ssGSEA scores
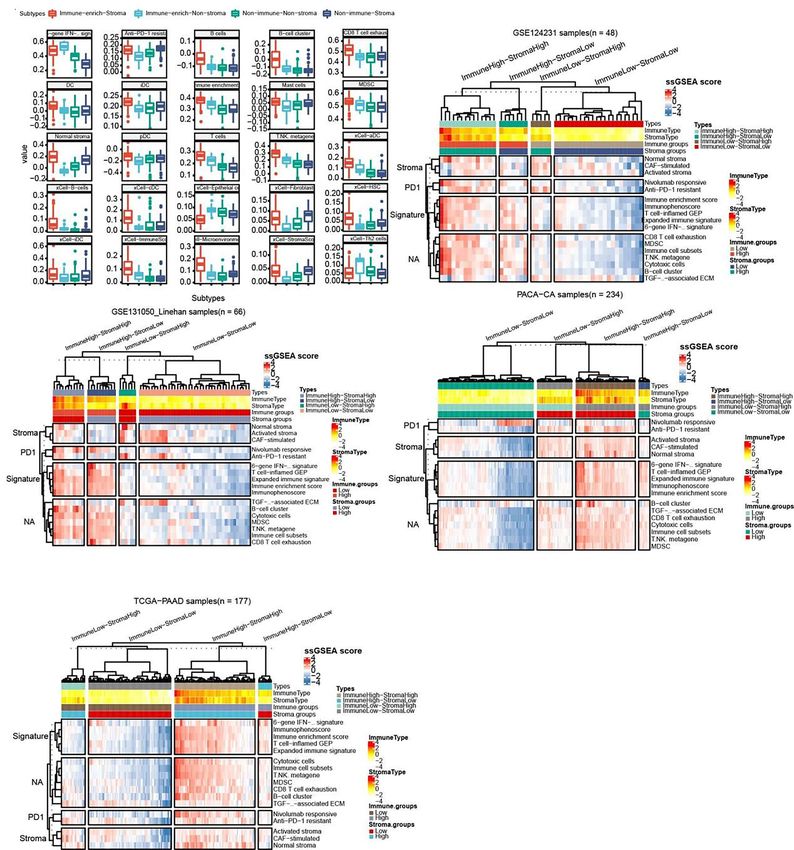
tumors is conducive to tumor growth. Researchers reported on (Figure 1A). Meanwhile, we used t-distributed stochastic
three subtypes of pancreatic cancer: classic, quasi-mesenchymal, neighbor embedding (tSNE) to show the groups (Figure 1B),
and exocrine, and clarified the genetic markers of different and revealed an immune-enriched subtype (Immune-enrich)
subtypes, which may help to carry out more targeted exists in the cohort, and the rest are of the Non-immune type,
treatments for patients (22). Other researchers have identified that is, less immune infiltration (Figure 1C). In addition, even in
two tumor-specific subtypes based on gene expression: basal-like the presence of a large population of immune cells, stromal cells
subtype and classical subtype (23). The classic subtype is also play vital roles in tumor immunity evasion. Therefore, we
consistent with the subtype described by Collisson et al. further dissected the enrichment of stromal cells in the patient’s
Tumor subtypes defined by exocrine-like genes have not been gene expression profile. Also using ssGSEA analysis, we found
validated in its data set, and may be related to tissue that the cohort had characteristics of activated stromal response
contamination. Recently, researchers classified pancreatic (Figure 1C). Based on the above classification, we can divide the
cancer into four subtypes based on genomic studies— pancreatic cancer cohort into four subtypes: immune cell and
squamous cells, pancreatic progenitor cells, immunogenicity stromal cell enrichment (Immune-enrich-Stroma), non-immune
and abnormally differentiated endocrine and exocrine- enrichment but stromal cell enrichment (Non-immune-Stroma),
identified the differences between pancreatic cancer subtypes Immune enrichment but non-matrix enrichment (Immune-
and provided Different subtypes of treatment options (22, 24). enrich-non-Stroma) and non-immune enrichment and non-
Among them, squamous cells, pancreatic progenitor cells, and stromal cell enrichment (Non-immune-non-Stroma). Immune-
Frontiers in Oncology | www.frontiersin.org 2 February 2022 | Volume 12 | Article 832715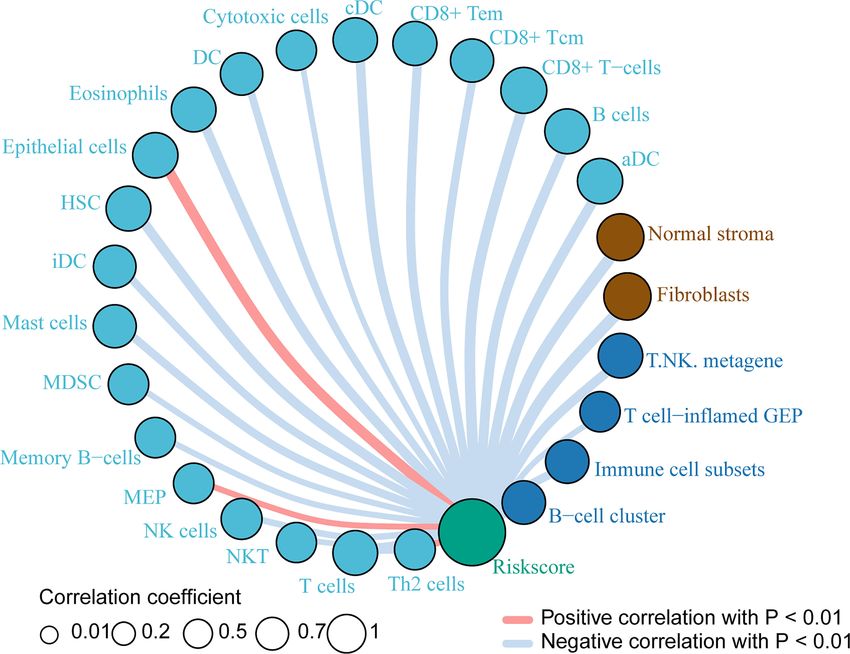
Mao et al.                                                                                                    Heterogeneity in Pancreatic Cancer Microenvironment

TABLE 1 | Immune-related gene signatures and their references.                         enrichment of other data. In addition, select significantly different
Signature name                                       Reference
                                                                                       immune activity or immune cell-related genes to verify their
                                                                                       enrichment. The analysis results show that the GSE124231 data
Immune enrichment score              Yoshihara et al. Nat Commun. 2013 (28)            set (Figure 2B, n=48), the GSE131050 data set (Figure 2C, n=66),
6-gene IFN-gsignature                Chow et al. J Clin Oncol. 2016 (suppl) (29)
Activated stroma                     Moffitt et al. Nat Genet. 2015 (30)
                                                                                       the PACA-CA data set (Figure 2D, n=234) and the TCGA-PAAD
Immune cell subsets                  Cancer Genome Atlas Network. Cell. 2015           database (Figure 2E, n = 177) can be divided into immune
                                     (31)                                              enrichment and stromal cell enrichment groups. According to
T cells                              Bindea et al. Immunity. 2013 (32)                 the constructed gene set, samples of different data sets can
CD8 Tcells                           Bindea et al. Immunity. 2013 (32)
T. NK. metagene                      Alistar et al. Genome Med. 2014 (33)
                                                                                       be divided into immune-enrich-Stroma, immune-enrich-non-
B-cell cluster                       Iglesia et al. Clin Cancer Res. 2014 (34)         stroma, non-immune-stroma and non-immune-non-stroma
Macrophages                          Bindea et al. Immunity. 2013 (32)                 types. And immune enrichment type samples are mainly enriched
Cytotoxic cells                      Bindea et al. Immunity. 2013 (32)                 for immune-related signatures, such as immune enrichment score,
Immunophenoscore                     Charoentong et al. Cell Rep. 2017 (35)
T cell-inflamed GEP                   Cristescu et al. Science. 2018 (36)
                                                                                       immunophenoscore, Immune cell subsets, etc. Stromal cell
Expanded immune signature            Ayers et al. J Clin Invest. 2017 (37)             enrichment types mainly enrich stroma-related signatures, such
TGF-b-associated ECM                 Chakravarthy et al. Nat Commun. 2018) (38)        as normal stroma, activated stromanivolumab responsive, etc.
MDSC                                 Yaddanapudi et al. Cancer Immunol Res.            The above results show that the accuracy and consistency of our
                                     2016 (39)
CAF                                  Calon et al. Cancer Cell. 2012 (40)
                                                                                       classification and research methods are trustworthy.
TAM M2/M1                            Beyer et al. PLoS One. 2012 (41)
CD8 T cell exhaustion                Giordano et al. EMBO J. 2015 (42)                 Four Immune Subtypes Are Related
T cell exhaustion early/late stage   Philip et al. Nature. 2017 (43)
Nivolumab responsive                 Riaz et al. Cell. 2017 (44)                       to Clinical Characteristics and
                                                                                       Survival Prognosis
                                                                                       Based on the previous results, we have divided patients into 4
enrich-Stroma subtypes mainly enrich tumor immune-related                              different subtypes of immune enrichment and stromal cell
molecular signatures, including T cell-inflamed GEP, Expanded                           enrichment. Therefore, we need to further compare the clinical
immune signature, Immunophenoscore, Immune enrichment                                  characteristics of different types and try to explore the relationship
score, CD8 T cell exhaustion, myeloid-derived suppressor cells                         between each type and patient survival prognosis. Firstly, we
(MDSC), cytotoxic cells, Immune cell subset, etc. At the same time,                    sequentially compared the clinical information between different
it also enriches PD1 and stroma related signatures, including anti-                    subtypes in the PACA-AU, PACA-CA and TCGA-PAAD cohorts.
PD-1 resistant, nivolumab responsive and normal stroma. The                            Statistics showed that there were significant differences among
signatures of Non-immune-Stroma subtypes mainly include anti-                          subtypes in the PACA-AU cohort, which included donor_sex,
PD-1 resistant, activated stroma, CAF-stimulated, and normal                           donor_vital_status, donor_relapse_type, donor_age_at_diagnosis
stroma, while its immune-related family features are very low.                         and enrollment, donor_survival_time, donor_interval_up,
Immune-enrich-non-Stroma subtypes mainly enrich tumor                                  donor_interval_up, donor_interval_up (Table S3). In the PACA-
immune-related signatures, including T cell-inflamed GEP,                               CAcohort, clinical markers such as donor_age_at_diagnosis and
Expanded immune signature and cytotoxic cells, etc., while its                         enrollment, donor_age_at_last_followup, donor_survival_time,
stromal signatures expression is very low. Non-immune-non-                             donor_interval_of_last_followup are significantly different among
Stroma subtypes, as the name suggests, are rarely enriched in                          subgroups (Table S4). Age_at_initial_pathologic_diagnosis,
tumor immunity and stromal signatures.                                                 family_history_of_cancer (%), history_of_chronic_pancreatitis
                                                                                       (%), history_of_diabetes (%) and other clinical indicators were
Comparison of the Striking Differences                                                 significantly different among 4 subsets in the TCGA-PAAD cohort
in the Immune Microenvironment                                                         (Table S5).
of the Four Subtypes                                                                       Then, we successively explored the relationship between
As follow, the four subtypes have the following immune                                 different subgroups in the cohort and the survival prognosis of
differences (Figure 2A). Patients with immuno-enriched subtypes                        patients. In the PACA-AU cohort, the 1-year (Figure 3A) and 5-
(Figure 2A red and light blue boxes) showed significant enrichment                      year (Figure 3C) survival rates between different subtypes are
in the characteristics of recognizing immune cells or immune                           significantly different (p.value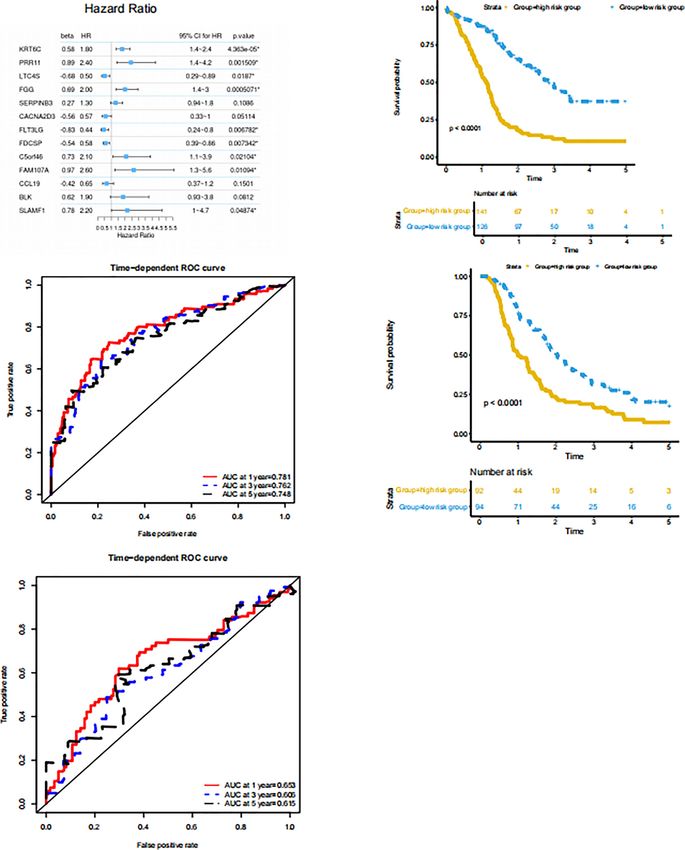
Mao et al.                                                                                                       Heterogeneity in Pancreatic Cancer Microenvironment

                            A                                                       B

                            C

 FIGURE 1 | Classification of distinct tumor microenvironment subtypes (A) Spectral classification of tumor microenvironment in PACA-AU alignment. This plot shows
 a heat map of the ssGSEA score, estimated using the gene set from the ICGC database. Based on tSNE cluster analysis, 7 subgroups were obtained, namely
 PDAC1, PDAC2, PDAC3, PDAC4, PDAC5, PDAC6, PDAC7. Based on Spectral classification, 6 subgroups were obtained, namely PDAC1, PDAC2, PDAC3, PDAC4,
 PDAC5, PDAC6. (B) tSNE classification of tumor microenvironment in PACA-AU cohort. (C) This figure shows the 4 immune subtypes of the PACA-AU cohort based
 on ssGSEA analysis and the main signatures of each subtype.

different subgroups. It is worth mentioning that there is a                             construct a prognostic prediction model. Firstly, PACA-AU data is
relatively large difference in the five-year survival rate between                       treated as training data for parameter training of prediction models
the immune-enrich-stroma and non-immune-stroma groups of                                and selection of related gene sets. PACA-CA and TCGA-PAAD are
PACA-CA (Figure 3I). The analysis results of the TCGA-PAAD                              regarded as testing data to test the parameters given by the training
cohort showed that the survival rates of patients in different                          set and the predictive ability of the gene set. Then, use the cox
subgroups were 1 year (Figure 3J), 3 years (Figure 3K), 5 years                         regression algorithm to initially screen the genes that are
(Figure 3L) and all patients (8 years) (Figure 3M). It was found                        significantly related to the patient’s overall survival (P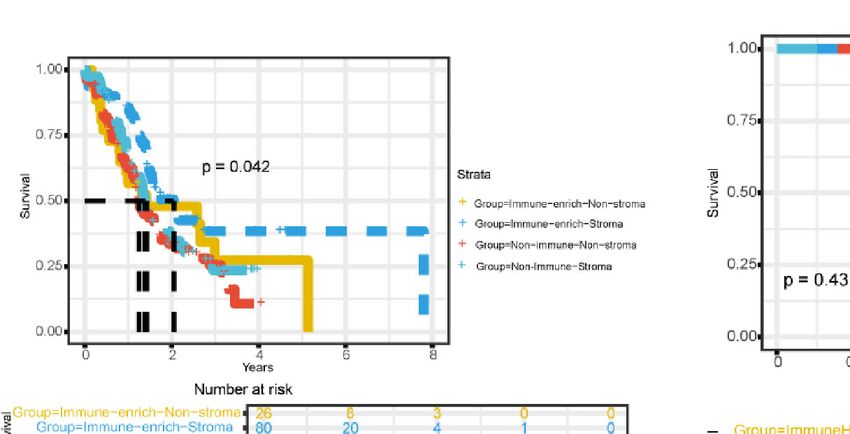
Mao et al.                                                                                                   Heterogeneity in Pancreatic Cancer Microenvironment

                       A                                                           B

                       C                                                           D

                       E

 FIGURE 2 | Comparison of the striking differences in the immune microenvironment of the four subtypes. (A) Comparison of the striking differences in the immune
 microenvironment of the four subtypes. Red represents immune-enrich-stroma subtype, Light_blue represents immune-enrich-non-stroma subtype, Green
 represents non-immune-non-stroma subtype, and Navy blue represents non-immune-stroma subtype. (B) Immune-enrich-Stroma, Immune-enrich-non-Stroma, Non-
 immune-Stroma and Non-immune-non-Stroma types in the GSE124231 data set (n=48). (C) Four types in the GSE131050 data set (n=66). (D) Four types in the
 PACA-CA data set (n=234). (E) Four types in the TCGA-PAAD database (n = 177).

significant difference in survival probability between the high-risk                survival periods. In addition, the prediction effect of the PACA-CA
group and the low-risk group in PACA-AU cohort (p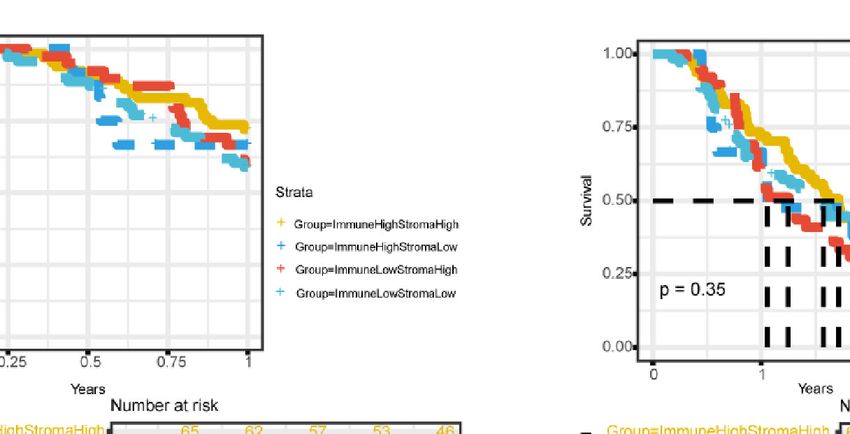
Mao et al.                                                                                                      Heterogeneity in Pancreatic Cancer Microenvironment

                           A                                   B                                   C

                           D                                   E                                   F

                           G                                   H                                   I

                           J                                   K
                                                                                                   L

                           M                                  N

 FIGURE 3 | Four immune subtypes are related to clinical characteristics and survival prognosis Comparison of survival rates between subgroups in different cohorts
 (A) Comparison of 1-year survival rate of PACA-AU cohort. (B) Comparison of 3-year survival rate of PACA-AU cohort. (C) Comparison of 5-year survival rate of
 PACA-AU cohort. (D) Comparison of survival rates of all PACA-AU cohort. (E) Comparison of 1-year survival rate of PACA-CA cohort. (F) Comparison of 3-year
 survival rate of PACA-CA cohort. (G) Comparison of 5-year survival rate of PACA-CA cohort. (H) Comparison of survival rates of all PACA-CA cohort. (I) Comparison
 of survival rates of the Immune-enrich-Stroma and Non-immune-Stromasubtypes. (J) Comparison of 1-year survival rate of TCGA-PAAD cohort. (K) Comparison of
 3-year survival rate of TCGA-PAAD cohort. (L) Comparison of 5-year survival rate of TCGA-PAAD cohort. (M) Comparison of survival rates of all TCGA-PAAD
 cohort. (N) Comparison of survival rates of the Immune-enrich-Stroma and Immune-enrich-non-Stroma subtypes.

index and epithelial cells, megakaryocyte-erythroid progenitor                       then combined the Spectral clustering algorithm to extract the 4
(MEP), and Th2 cells showed a positive correlation with p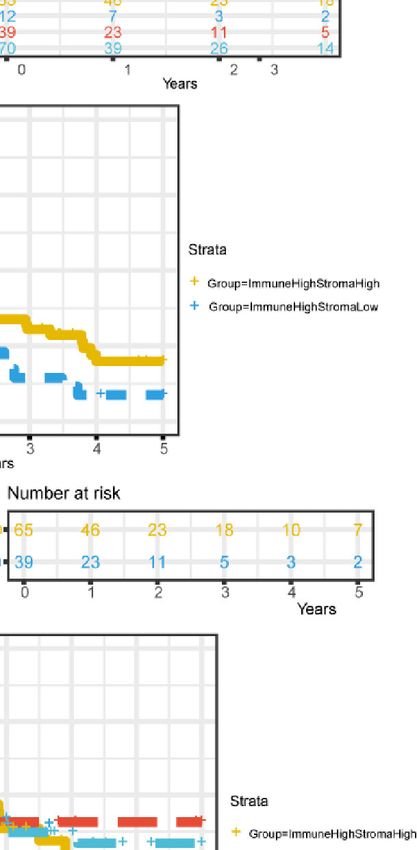
Mao et al.                                                                                                               Heterogeneity in Pancreatic Cancer Microenvironment

                                      A                                                       B

                                      C                                                       D

                                      E

 FIGURE 4 | Prognostic prediction model based on signatures of tumor microenvironment (A) features: significant factor name; multi_beta: Cox multiple regression
 coefficient; multi_HR: Cox multiple regression risk ratio; multi 95% CI for HR: Cox multiple regression risk ratio 95% confidence interval; Forest diagram: horizontal line
 shows the confidence interval interval, and the dot represents the hazard ratio; multi_p.value: Cox multiple regression proportional hazard hypothesis test P value.
 (B) Survival curve of the high and low risk groups in the training set. The horizontal axis represents time (unit: day), the vertical axis represents survival rate. A flat curve
 represents a high survival rate or a longer survival period, and a steep curve represents a low survival rate or a shorter survival period. (C) ROC curve of the training set
 prediction model. The horizontal axis is the false positive rate FP, and the vertical axis is the true positive rate TP. The legend in the upper left corner corresponds to
 the AUC value of the ROC curve for different survival periods. (D) Survival curves of the high- and low-risk groups in the PACA-CA testing set. (E) ROC curve of
 PACA-CA test set prediction model. The horizontal axis is the false positive rate FP, and the vertical axis is the true positive rate TP. The legend in the upper left corner
 corresponds to the AUC value of the ROC curve for different survival periods. The horizontal axis is the false positive rate (FP), and the vertical axis is the true positive
 rate (TP). The legend in the upper left corner corresponds to the AUC value of the ROC curve for different survival periods.

related to inflammatory diseases (47), and its lack will result in a                             Using the same research method, it was verified in the
significant reduction in IFN-g produced by T cells and NK cells.                             GSE124231 (n=48), GSE131050_Linahan (n=66), PACA-CA
In addition, NKG7 is related to the cytotoxic degranulation of                              (n=234), TCGA-PAAD (n=177) cohorts, and the typing was
CD8+ T cells (48). Researchers have discovered that CD96 can                                accurate in different cohorts. Further compare the clinical
serve as a new immune checkpoint receptor target for T cells and                            information of patients in the cohort, and in-depth exploration
natural killer cells (49). Similarly, we observed the top genes and                         of the difference in survival of patients with different subgroups.
their stromal functions in (Table S2). For example, Slits3 is                               We found that in the PACA-AU cohort, the 1-year, 5-year, and
expressed in primary bone marrow stromal and bone marrow-                                   8-year survival times of different subsets patients were
derived endothelial cells and stromal cell lines, and plays a role in                       significantly correlated. Next, cox regression combined with
in vitro migration and in vivo homing of hematopoietic stem and                             Lasso algorithm was performed to construct a multivariate
progenitor cells (50). SPARC is a stromal cell protein, which can                           COX model. Calculate the patient’s risk index based on gene
be produced by cells associated with tumor stromal cells and has                            expression level and multiple regression coefficients, and divide
high expression levels in many cancers. It plays an important role                          the patients into high-risk groups and low-risk groups based on
in the fibroproliferative reaction of tumors (51).                                           the risk index. Interestingly, the PACA_AU and PACA-CA risk

Frontiers in Oncology | www.frontiersin.org                                             7                                         February 2022 | Volume 12 | Article 832715
Mao et al. Heterogeneity in Pancreatic Cancer Microenvironment
FIGURE 5 | Immune cells related to risk index Immune cells associated with the risk index of PACA-AU patients. The red line indicates a positive correlation
between the risk index and immune cells, and the gray line indicates a negative correlation between the risk index and immune cells. The size of the circle indicates
different correlation coefficients, and the larger the area of the circle, the larger the correlation coefficient.
indexes are significantly correlated with the survival level verification come from GSE124231, GSE131050_Linehan,
of patients. PACA-CA and TCGA-PAAD projects, including 48, 66, 234
In PADA-AC and TCGA-PAAD, the survival time difference and 177 donors respectively. Moreover, patients in the PACA-
between different immune subgroups is not significant. Only the CA and TCGA-PAAD cohorts had detailed clinical information.
five-year survival of immune-enrich-stroma and non-immune-
stroma group in PACA-CA cohort and the one-year survival of Bioinformatics Analysis
immune-enrich-Stroma and immune-enrich-non-Stroma group 1) ssGSEA algorithm: Use the R package “GSVA” and use ssGSEA
in TCGA-PAAD cohort are relatively large. On the one hand, the to explore the PACA-AU pancreatic cancer expression profile data
cohort clustering algorithm may not cover all patients in the of the ICGC database, and analyze the immune enrichment of
cohort, on the other hand, it may also be because the cohort each patient’s tumor microenvironment. Additionally, the gene
samples are not large enough, and the representativeness of the expression of all samples were took as the input and ssGSEA
statistical results needs to be further improved. algorithms were occupied to determine the proportion of the
We initially explored the types of immune cells related to the various immune cells of all PDAC samples. The immune gene
risk index, and we identified immune cells that are positively and signatures were listed in the Table 1. According to the immune
negatively related to the risk index. This research lays the enrichment status of PACA-AU samples, they are divided into
foundation for the subsequent in-depth exploration of the immune cells and stromal cell enriched (immune-enrich-stroma),
correlation mechanism between immune cells and patient non-immune enrichment but stromal cell enrichment (non-
disease risk. However, only analyzing the types of immune immune-stroma), and immune-enriched but Non-matrix
cells is insufficient for the study of the mechanism. In the later enrichment (immune-enrich-non-stroma) and non-immune
stage, we will conduct more in-depth analysis and verification of enrichment and non-stromal cell enrichment (non-immune-
important immune cells and their molecular signatures. non-stroma). According to the ssGSEA score obtained by each
sample, the Spectral clustering algorithm is used to extract
different classifications. In addition, the R package “limma” was
METHODS used to analyze immuno-enriched and non-immune-enriched
patients, as well as the significantly different genes of stromal
Project and Sample cell enrichment and non-matrix enrichment, and PMao et al. Heterogeneity in Pancreatic Cancer Microenvironment
neighborhoods (45). In this study, we use tSNE to show the 6) We use the Lasso algorithm (glmnet package) to select the
different subgroups of the PACA-AU cohort. best gene model based on the COX multiple regression model,
3) We performed Kaplan-Meier survival analysis on the and finally draw the unit cox regression model forest diagram
samples and plotted survival curves. Survival analysis divided based on the gene Panel as follows: We calculate the risk score
the samples into high-index groups and low-index groups based (Risk Score) of each patient based on the expression of the gene
on the median. Data visualization is mainly done in the R Panel and the multiple regression coefficient. The formula is as
environment (version 4.1.0). Kaplan-Meier survival analysis follows:
relies on the use of the “survival” package. The ROC curve is
n
drawn based on the’survivalROC’ package. Riskscore = obi ∗ xi
4) Prognosis prediction model establishment process: a). Use i=1
the training set to perform unit cox regression on each gene to
xi represents the expression level of each gene in the Panel, bi is
initially screen disease-related genes; b). After obtaining all cox the multivariate COX regression beta value (multi_beta)
significant genes in all units, perform 1000X LASSO regression to
corresponding to each gene.
calculate the frequency of each gene and rank it; c). According to
the sorting result of the previous step, build the gene set
incrementally. Use each gene set to perform multiple cox
regression to get the contribution of each gene; d). Obtain the DATA AVAILABILITY STATEMENT
optimal gene set according to the gene contribution degree, and
perform multiple cox regression analysis on these genes. Finally, The original contributions presented in the study are included in
we determined the regression coefficient of each gene; e). the article/Supplementary Material. Further inquiries can be
Calculate the death risk score of each patient through directed to the corresponding author.
regression coefficients; f). The death risk score model is tested
in the training set (comparing the predicted situation with the
actual situation); g). The same model is tested in the independent AUTHOR CONTRIBUTIONS
testing set at the beginning (comparison of the predicted
situation with the actual situation). FM and XW conceived this project. XW, LL, LF, and YM
5) Construct the optimal multivariate COX model based on collected the data. YY and FM analyzed and interpreted the
the Lasso algorithm. This analysis uses the LASSO algorithm for data. XW and FM performed the statistical analyses and wrote
gene screening: In the field of statistics and machine learning, the manuscript. All authors have reviewed the manuscript and
Lasso algorithm (least absolute shrinkage and selection operator, approved the final version.
also translated as minimum absolute shrinkage and selection
operator, lasso algorithm) is a regression analysis method that
simultaneously performs feature selection and regularization FUNDING
(mathematics).It aims to enhance the predictive accuracy and
interpretability of statistical models. Lasso adopts the linear This work was financially supported by National Natural Science
regression method of L1-regularization, so that the weight of Foundation of China (82002480).
some learned features is 0, so as to achieve the purpose of sparseness,
selection of variables, and construction of the best model. The
characteristic of LASSO regression is to perform variable selection SUPPLEMENTARY MATERIAL
and regularization while fitting a generalized linear model.
Therefore, regardless of whether the target dependent variable The Supplementary Material for this article can be found online at:
(dependent/response variable) is continuous, binary or discrete, it https://www.frontiersin.org/articles/10.3389/fonc.2022.832715/
can be modeled by LASSO regression and then predicted. full#supplementary-material
5. Schlesinger Y, Yosefov-Levi O, Kolodkin-Gal D, Granit RZ, Peters L, Kalifa R,
REFERENCES et al. Single-Cell Transcriptomes of Pancreatic Preinvasive Lesions and
1. Ansari D, Tingstedt B, Andersson B, Holmquist F, Sturesson C, Williamsson Cancer Reveal Acinar Metaplastic Cells’ Heterogeneity. Nat Commun
C, et al. Pancreatic Cancer: Yesterday, Today and Tomorrow. Future Oncol (2020) 11(1):4516. doi: 10.1038/s41467-020-18207-z
(2016) 12(16):1929–46. doi: 10.2217/fon-2016-0010 6. Dab̨ kowski K, Bogacka B, Tarnowski M, Starzyń ska T. Pancreatic Cancer
2. Goral V. Pancreatic Cancer: Pathogenesis and Diagnosis. Asian Pac J Cancer Microenvironment. Pol Merkur Lekarski (2016) 41((246):296–302.
Prev (2015) 16(14):5619–24. doi: 10.7314/APJCP.2015.16.14.5619 7. Le DT, Durham JN, Smith KN, Wang H, Bartlett BR, Aulakh LK,
3. Gupta R, Amanam I, Chung V. Current and Future Therapies for et al. Mismatch Repair Deficiency Predicts Response of Solid Tumors
Advanced Pancreatic Cancer. J Surg Oncol (2017) 116(1):25–34. doi: to PD-1 Blockade. Science (2017) 357(6349):409–13. doi: 10.1126/
10.1002/jso.24623 science.aan6733
4. Hidalgo M, Cascinu S, Kleeff J, Labianca R, Lohr JM, Neoptolemos J, et al. 8. Knudsen ES, Vail P, Balaji U, Ngo H, Botros IW, Makarov V, et al.
Addressing the Challenges of Pancreatic Cancer: Future Directions for Stratification of Pancreatic Ductal Adenocarcinoma: Combinatorial
Improving Outcomes. Pancreatology (2015) 15(1):8–18. doi: 10.1016/ Genetic, Stromal, and Immunologic Markers. Clin Cancer Res (2017) 23
j.pan.2014.10.001 (15):4429–40. doi: 10.1158/1078-0432.CCR-17-0162
Frontiers in Oncology | www.frontiersin.org 9 February 2022 | Volume 12 | Article 832715Mao et al. Heterogeneity in Pancreatic Cancer Microenvironment
9. Dreyer SB, Chang DK, Bailey P, Biankin AV. Pancreatic Cancer Genomes: Interpreting Genome-Wide Expression Profiles. Proc Natl Acad Sci USA
Implications for Clinical Management and Therapeutic Development. Clin (2005) 102(43):15545–50. doi: 10.1073/pnas.0506580102
Cancer Res (2017) 23(7):1638–46. doi: 10.1158/1078-0432.CCR-16-2411 28. Yoshihara K, Shahmoradgoli M, Martinez E, Vegesna R, Kim H, Torres-
10. Ren B, Cui M, Yang G, Wang H, Feng M, You L, et al. Tumor Microenvironment Garcia W, et al. Inferring Tumour Purity and Stromal and Immune Cell
Participates in Metastasis of Pancreatic Cancer. Mol Cancer (2018) 17(1):108. doi: Admixture From Expression Data. 2013: Nat Commun. doi: 10.1038/
10.1186/s12943-018-0858-1 ncomms3612
11. Lin QJ, Yang F, Jin C, Fu DL. Current Status and Progress of Pancreatic Cancer in 29. Chow LQM, Haddad R, Gupta S, Mahipal A, Mehra R, Tahara M, et al.
China. World J Gastroenterol (2015) 21(26):7988–8003. doi: 10.3748/ Antitumor Activity of Pembrolizumab in Biomarker-Unselected Patients
wjg.v21.i26.7988 With Recurrent and/or Metastatic Head and Neck Squamous Cell
12. Chronopoulos A, Robinson B, Sarper M, Cortes E, Auernheimer V, Lachowski Carcinoma: Results From the Phase Ib KEYNOTE-012 Expansion Cohort. J
D, et al. ATRA Mechanically Reprograms Pancreatic Stellate Cells to Suppress Clin Oncol (2016) 34(32):3838–45. doi: 10.1200/JCO.2016.68.1478
Matrix Remodelling and Inhibit Cancer Cell Invasion. Nat Commun (2016) 30. Moffitt RA, Marayati R, Flate EL, Volmar KE, Loeza SG, Hoadley KA, et al.
7:12630. doi: 10.1038/ncomms12630 Virtual Microdissection Identifies Distinct Tumor- and Stroma-Specific
13. Sunami Y, Kleeff J. Immunotherapy of Pancreatic Cancer. Prog Mol Biol Subtypes of Pancreatic Ductal Adenocarcinoma. Nat Genet (2015) 47
Transl Sci (2019) 164:189–216. doi: 10.1016/bs.pmbts.2019.03.006 (10):1168–78. doi: 10.1038/ng.3398
14. Yamazaki K, Masugi Y, Effendi K, Tsujikawa H, Hiraoka N, Kitago M, et al. 31. Cancer Genome Atlas Research Network. The Molecular Taxonomy of
Upregulated SMAD3 Promotes Epithelial-Mesenchymal Transition and Primary Prostate Cancer. Cell (2015) 163(4):1011–25. doi: 10.1016/
Predicts Poor Prognosis in Pancreatic Ductal Adenocarcinoma. Lab Invest j.cell.2015.10.025
(2014) 94(6):683–91. doi: 10.1038/labinvest.2014.53 32. Bindea G, Mlecnik B, Tosolini M, Kirilovsky A, Waldner M, Obenauf AC,
15. Sivaram N, McLaughlin PA, Han HV, Petrenko O, Jiang YP, Ballou LM, et al. et al. Spatiotemporal Dynamics of Intratumoral Immune Cells Reveal the
Tumor-Intrinsic PIK3CA Represses Tumor Immunogenecity in a Model of Immune Landscape in Human Cancer. Immunity (2013) 39(4):782–95.
Pancreatic Cancer. J Clin Invest (2019) 129(8):3264–76. doi: 10.1172/ doi: 10.1016/j.immuni.2013.10.003
JCI123540 33. Alistar A, Chou JW, Nagalla S, Black MA, D'Agostino RJr., Miller LD. Dual
16. Siemers NO, Holloway JL, Chang H, Chasalow SD, Ross-MacDonald PB, Roles for Immune Metagenes in Breast Cancer Prognosis and Therapy
Voliva CF, et al. Genome-Wide Association Analysis Identifies Genetic Prediction. Genome Med (2014) 6(10):80. doi: 10.1186/s13073-014-0080-8
Correlates of Immune Infiltrates in Solid Tumors. PloS One (2017) 12(7): 34. Iglesia MD, Vincent BG, Parker JS, Hoadley KA, Carey LA, Perou CM, et al.
e0179726. doi: 10.1371/journal.pone.0179726 Prognostic B-Cell Signatures Using Mrna-Seq in Patients With Subtype-
17. Bailey P, Chang DK, Nones K, Johns AL, Patch AM, Gingras MC, et al. Specific Breast and Ovarian Cancer. Clin Cancer Res (2014) 20(14):3818–29.
Genomic Analyses Identify Molecular Subtypes of Pancreatic Cancer. Nature doi: 10.1158/1078-0432.CCR-13-3368
(2016) 531(7592):47–52. doi: 10.1038/nature16965 35. Charoentong P, Finotello F, Angelova M, Mayer C, Efremova M, Rieder D,
18. Hashimoto S, Furukawa S, Hashimoto A, Tsutaho A, Fukao A, Sakamura Y, et al. Pan-Cancer Immunogenomic Analyses Reveal Genotype-
et al. ARF6 and AMAP1 are Major Targets of KRAS and TP53 Mutations to Immunophenotype Relationships and Predictors of Response to Checkpoint
Promote Invasion, PD-L1 Dynamics, and Immune Evasion of Pancreatic Blockade. Cell Rep (2017) 18(1):248–62. doi: 10.1016/j.celrep.2016.12.019
Cancer. Proc Natl Acad Sci USA (2019) 116(35):17450–9. doi: 10.1073/ 36. Cristescu R, Mogg R, Ayers M, Albright A, Murphy E, Yearley J, et al. Pan-Tumor
pnas.1901765116 Genomic Biomarkers for PD-1 Checkpoint Blockade-Based Immunotherapy.
19. Mizrahi JD, Surana R, Valle JW, Shroff RT. Pancreatic Cancer. Lancet (2020) Science (2018) 362(6411):eaar3593. doi: 10.1126/science.aar3593
395((10242):2008–20. doi: 10.1016/S0140-6736(20)30974-0 37. Ayers M, Lunceford J, Nebozhyn M, Murphy E, Loboda A, Kaufman DR, et al.
20. Fabris L, Perugorria MJ, Mertens J, Bjorkstrom NK, Cramer T, Lleo A, et al. IFN-Gamma-Related Mrna Profile Predicts Clinical Response to PD-1
The Tumour Microenvironment and Immune Milieu of Cholangiocarcinoma. Blockade. J Clin Invest (2017) 127(8):2930–40. doi: 10.1172/JCI91190
Liver Int (2019) 39(Suppl 1):63–78. doi: 10.1111/liv.14098 38. Chakravarthy A, Khan L, Bensler NP, Bose P, De Carvalho DD. TGF-Beta-
21. Wartenberg M, Zlobec I, Perren A, Koelzer VH, Gloor B, Lugli A, et al. Associated Extracellular Matrix Genes Link Cancer-Associated Fibroblasts to
Accumulation of FOXP3+T-Cells in the Tumor Microenvironment Is Immune Evasion and Immunotherapy Failure. Nat Commun (2018) 9
Associated With an Epithelial-Mesenchymal-Transition-Type Tumor (1):4692. doi: 10.1038/s41467-018-06654-8
Budding Phenotype and Is an Independent Prognostic Factor in Surgically 39. Yaddanapudi K, Rendon BE, Lamont G, Kim EJ, Al Rayyan N, Richie J, et al.
Resected Pancreatic Ductal Adenocarcinoma. Oncotarget (2015) 6(6):4190– MIF is Necessary for Late-Stage Melanoma Patient MDSC Immune
201. doi: 10.18632/oncotarget.2775 Suppression and Differentiation. Cancer Immunol Res (2016) 4(2):101–12.
22. Collisson EA, Sadanandam A, Olson P, Gibb WJ, Truitt M, Gu S, et al. doi: 10.1158/2326-6066.CIR-15-0070-T
Subtypes of Pancreatic Ductal Adenocarcinoma and Their Differing 40. Calon A, Espinet E, Palomo-Ponce S, Tauriello DV, Iglesias M, Cespedes MV,
Responses to Therapy. Nat Med (2011) 17(4):500–3. doi: 10.1038/nm.2344 et al. Dependency of Colorectal Cancer on a TGF-Beta-Driven Program in
23. O’Kane GM, Grunwald BT, Jang GH, Masoomian M, Picardo S, Grant RC, Stromal Cells for Metastasis Initiation. Cancer Cell (2012) 22(5):571–84.
et al. GATA6 Expression Distinguishes Classical and Basal-Like Subtypes in doi: 10.1016/j.ccr.2012.08.013
Advanced Pancreatic Cancer. Clin Cancer Res (2020) 26(18):4901–10. doi: 41. Beyer M, Mallmann MR, Xue J, Staratschek-Jox A, Vorholt D, Krebs W, et al.
10.1158/1078-0432.CCR-19-3724 High-Resolution Transcriptome of Human Macrophages. PloS One (2012) 7
24. Puleo F, Nicolle R, Blum Y, Cros J, Marisa L, Demetter P, et al. Stratification of (9):e45466. doi: 10.1371/journal.pone.0045466
Pancreatic Ductal Adenocarcinomas Based on Tumor and Microenvironment 42. Giordano M, Henin C, Maurizio J, Imbratta C, Bourdely P, Buferne M, et al.
Features. Gastroenterology (2018) 155(6):1999–2013 e3. doi: 10.1053/ Molecular Profiling of CD8 T Cells in Autochthonous Melanoma Identifies
j.gastro.2018.08.033 Maf as Driver of Exhaustion. EMBO J (2015) 34(15):2042–58. doi: 10.15252/
25. Cancer Genome Atlas Research Network and Electronic address: embj.201490786
andrew_aguirre@dfci.harvard.edu; Cancer Genome Atlas Research 43. Philip M, Fairchild L, Sun L, Horste EL, Camara S, Shakiba M, et al.
Network. Integrated Genomic Characterization of Pancreatic Ductal Chromatin States Define Tumour-Specific T Cell Dysfunction and
Adenocarcinoma. Cancer Cell (2017) 32(2):185–203.e13. doi: 10.1016/ Reprogramming. Nature (2017) 545(7655):452–6. doi: 10.1038/nature22367
j.ccell.2017.07.007 44. Riaz N, Havel JJ, Makarov V, Desrichard A, Urba WJ, Sims JS, et al. Tumor
26. Barbie DA, Tamayo P, Boehm JS, Kim SY, Moody SE, Dunn IF, et al. and Microenvironment Evolution During Immunotherapy With Nivolumab.
Systematic RNA Interference Reveals That Oncogenic KRAS-Driven Cell (2017) 171(4):934–49. doi: 10.1016/j.cell.2017.09.028
Cancers Require TBK1. Nature (2009) 462((7269):108–12. doi: 10.1038/ 45. van der Maaten L. Visualizing Data Using T-SNE. J Mach Learn Res (2008)
nature08460 1:1–48.
27. Subramanian A, Tamayo P, Mootha VK, Mukherjee S, Ebert BL, Gillette MA, 46. Ju H, Lim B Fau - Kim M, Kim M Fau - Kim YS, Kim Ys Fau - Kim WH, Kim
et al. Gene Set Enrichment Analysis: A Knowledge-Based Approach for Wh Fau - Ihm C, Ihm C Fau - Noh S-M, et al. A Regulatory Polymorphism at
Frontiers in Oncology | www.frontiersin.org 10 February 2022 | Volume 12 | Article 832715Mao et al. Heterogeneity in Pancreatic Cancer Microenvironment
Position -309 in PTPRCAP is Associated With Susceptibility to Diffuse-Type Conflict of Interest: The authors declare that the research was conducted in the
Gastric Cancer and Gene Expression. Neoplasia (2009) 11(12):1340–7. absence of any commercial or financial relationships that could be construed as a
doi: 10.1593/neo.91132 potential conflict of interest.
47. van Es LA, de Heer E, Vleming LJ, van der Wal A, Mallat M, Bajema I, et al. GMP-
The handling editor declared a shared parent affiliation with several of the authors
17-Positive T-Lymphocytes in Renal Tubules Predict Progression in Early Stages of
LL, LF, YM, and XW at time of review.
Iga Nephropathy. Kidney Int (2008) 73(12):1426–33. doi: 10.1038/ki.2008.66
48. Ng SS, De Labastida Rivera F, Yan J, Corvino D, Das I, Zhang P, et al. The NK
Publisher’s Note: All claims expressed in this article are solely those of the authors
Cell Granule Protein NKG7 Regulates Cytotoxic Granule Exocytosis and
and do not necessarily represent those of their affiliated organizations, or those of
Inflammation. Nat Immunol (2020) 21(10):1205–18. doi: 10.1038/s41590-
the publisher, the editors and the reviewers. Any product that may be evaluated in
020-0758-6
this article, or claim that may be made by its manufacturer, is not guaranteed or
49. Dougall WC, Kurtulus S, Smyth MJ, Anderson AC. TIGIT and CD96: New
endorsed by the publisher.
Checkpoint Receptor Targets for Cancer Immunotherapy. Immunol Rev
(2017) 276(1):112–20. doi: 10.1111/imr.12518
50. Geutskens SB, Andrews WD, van Stalborch AM, Brussen K, Holtrop-de Haan Copyright © 2022 Wang, Li, Yang, Fan, Ma and Mao. This is an open-access article
SE, Parnavelas JG, et al. Control of Human Hematopoietic Stem/Progenitor distributed under the terms of the Creative Commons Attribution License (CC BY).
Cell Migration by the Extracellular Matrix Protein Slit3. Lab Invest (2012) 92 The use, distribution or reproduction in other forums is permitted, provided the
(8):1129–39. doi: 10.1038/labinvest.2012.81 original author(s) and the copyright owner(s) are credited and that the original
51. Framson PE, Sage EH. SPARC and Tumor Growth: Where the Seed Meets the publication in this journal is cited, in accordance with accepted academic practice. No
Soil? J Cell Biochem (2004) 92(4):679–90. doi: 10.1002/jcb.20091 use, distribution or reproduction is permitted which does not comply with these terms.
Frontiers in Oncology | www.frontiersin.org 11 February 2022 | Volume 12 | Article 832715You can also read