Restaurant Consumer Insights - Q2 2021 - Changing Customer Expectations & Combo Meals
←
→
Page content transcription
If your browser does not render page correctly, please read the page content below
Special Insights

Restaurant
Consumer Insights
Q2 2021 – Changing Customer
Expectations & Combo Meals
revenuemanage.com
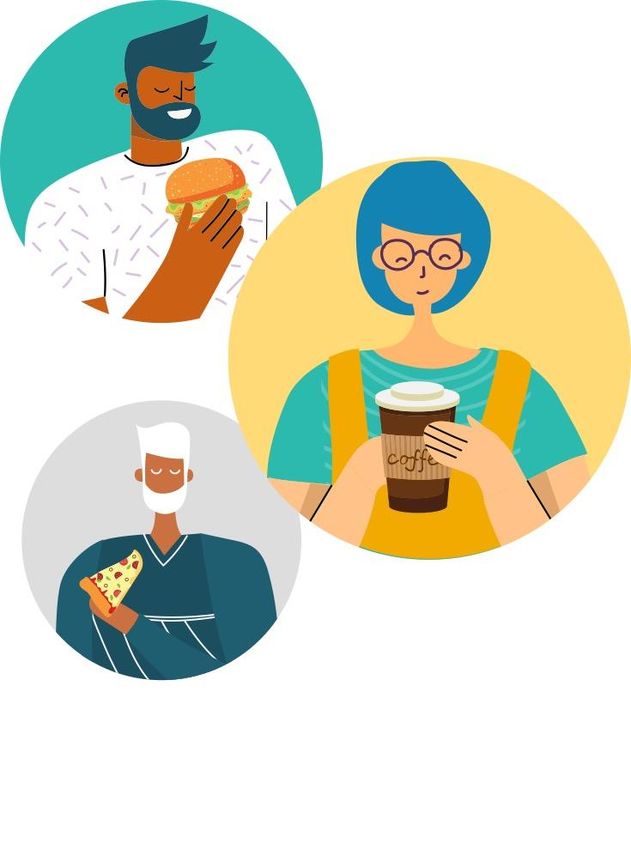
About the survey
RMS surveyed 805 people     Gender                                 Generation
in the United States from
                                                                        Gen Z                12%
May 25 – May 28, 2021.
                                                                   Millennials                           29%

                                                                        Gen X                      22%

                            51%           49%                        Boomers                                   33%
                            Female        Male
                                                                        Silent    4%

                            Restaurant usage

                             12%            32%                    56%
                             Infrequent     Moderate               Frequent
                             users          users                  users

                                          Order from restaurants    Order from restaurants
                                          at least 2x               at least 5x
                                          per week                  per week

                                                                                                                     2
Respondent breakdown
RMS surveyed 805 people                          Employment status                                        Region
in the United States from
                                                                                                                                                      18%
May 25 – May 28, 2021.                                                                                                                               Northeast
                                                 Employed for wages                                 46%                            22%
                                                              Retired                   20%                     21%               Midwest
                                                                                                                West
                                                       Self-employed               9%
                                             Out of work (not looking)         7%
                                                         Homemaker             7%                                                              39%
                                                                                                                                            South
                                                      Unable to work           6%
                                                              Student         3%
                                             Out of work (but looking)        2%

Children                                         Household Income                                         Geographic area
Under the age of 16 in the household
                                                      Under $50k                              50%
       +
       3+       5%                                                                                             Rural    24%
                                                  $50k to $100k                     31%
        2    11%                                                                                            Suburban                     50%
                                                      Over $100k     14%
                                                                                                               Urban        26%
        1      15%
                                                       No answer         5%
    None                               69%

                                                                                                                                                                 3
COVID-19
Service Expectations

Insight One

Guests expect to continue seeing sanitation
processes & safety precautions in place
Share of respondents who "agree" or "strongly agree“ with the following factors when it comes to
their current restaurant dining expectations

Themes
Surfaces, such as tables and counters, should be sanitized after
                                                                                   80%
each customer
Hygiene safety policies should be clearly displayed in the restaurant              76%
                                                                                                   Deep Dive
I expect the staff to be wearing masks                                             65%

Seating areas should be socially distanced                                         65%
                                                                                                   58% of respondents
I expect to order from a physical menu                                             58%             expect to use a physical
I want minimal contact points throughout my experience                             58%             menu (disposable or not)
                                                                                                   when dining out.
Plexiglass partitioning should be used when appropriate                            55%

I want to be able to make a reservation prior to my visit                          48%             Only 37% expect to order
I expect to order from a digital menu                                              37%             from a digital menu.
May 2021 n=805                                                                                                                5
Insight Two

Younger generations are more likely to
expect a digital menu when dining out
Share of respondents who "agree" or "strongly agree" with the expectation of
digital menus at restaurants

    Gen Z                                                                            50%

Millennial                                                                     44%

    Gen X                                                             37%

  Boomer                                             27%

May 2021 n=439                                                                             6
Insight Three

Older generations (boomer, Gen X and
millennials) are more attached to
COVID-19-related service processes
Share of respondents who "agree" or "strongly agree“ with the following factors when it
comes to their current restaurant dining expectations

Factors                                                 Gen Z         Millennial          Gen X   Boomer

I expect the staff to be wearing masks                   65%              66%             60%       66%
                                                                                                            Deep Dive
Hygiene safety policies should be
clearly displayed in the restaurant                      64%              75%             76%       81%
Seating areas should be socially                                                                           Most respondents
distanced                                                56%              68%             57%       69%
                                                                                                           across all generations
Plexiglass partitioning should be used
when appropriate                                         45%              50%             55%       62%    expressed that they
Surfaces, such as tables and counters,                                                                     expect to see the
should be sanitized after each                                                                             restaurant staff wearing
customer                                                 62%              75%             81%       89%
                                                                                                           masks.
 May 2021 n=805                                                                                                                       7
Insight Four

Respondents who have been back to
restaurants are more comfortable and
expect fewer COVID-19-related measures
Share of respondents who "agree" or "strongly agree“ with the following factors when it
comes to their current restaurant dining expectations

                                                        No weekly dine-in     At least 1 weekly dine-in
Factors                                             restaurant visit (38%)       restaurant visit (62%)   Difference

I expect the staff to be wearing masks                               73%                         59%           14%      Deep Dive
Hygiene safety policies should be clearly
displayed in the restaurant                                          81%                         73%             8%
                                                                                                                       Maintaining COVID-19
Seating areas should be socially distanced                           75%                         58%           17%
                                                                                                                       measures will help
I want minimal contact points throughout
my experience                                                        70%                         50%           20%
                                                                                                                       welcome back
Plexiglass partitioning should be used
                                                                                                                       customers who have
when appropriate                                                     68%                         48%           20%     not yet dined out.
I expect to order from a physical menu                               48%                         64%           -16%

 May 2021 n=805                                                                                                                               8
Dine-in vs.
Off-premise
Restaurants have been forced to change
and tweak their service processes in line
with CDC and local government guidelines,
often several times during a month.
How have the changes to their service and
business models impacted the consumer
experience?

Insight Five

Diners are now eating out more
                 of respondents in May ’21 reported
62%              at least 1 weekly dine-in visit vs.
                 42% in Feb ’21

                                          Experience has been a strong driver
                                          for guests when returning to dine-in

                                          6
                                                out of 10 respondents
                                                said they missed the experience of
                                                dining out at restaurants

May 2021 n=805
                                                                                     10
Insight Six
66% value the in-person experience and
stated that off-premise is not a replacement
for dine-in
Share of respondent who "agree" or "strongly agree" with "I get the same experience
whether I take-out or dine-in"
Gen Z 47%
Deep Dive
Millennial 38%
Younger generations
differentiate between
Gen X 34%
dine-in and off-premise
less often. 47% of Gen Z
feel they get the same
Boomer 27% experience when taking
out or dining in.
May 2021 n=439 11Insight Seven
Takeout is the new winner
67% consider takeout crucial going forward
vs. 60% who preferred delivery
When looking at generations, the importance slightly differs:
RMS Advice
of boomers consider takeout
74% crucial going forward compared
to 56% of Gen Z This indicates that
takeout is likely to be the
preferred off-premise
option going forward.
May 2021 n=805
12Insight Eight
Younger generations are more likely to
choose takeout when ordering off-premise
Share of respondent who "agree" or "strongly Share of respondent who "agree" or "strongly
agree" with "I am now used to ordering takeout agree" with "I am now used to ordering delivery
from my favorite restaurants" from my favorite restaurants"
Gen Z 60%
Gen Z 47%
Millennial 58%
Millennial 45%
Gen X 54%
Gen X 49%
Boomer 48%
Boomer 27%
May 2021 n=805
13Restaurant Experience Despite an ease in restrictions and high demand from consumers, restaurants have unexpected new hurdles to manage — including labor and food shortages. Have the issues affected customers? Will a changed experience affect their likelihood to return?
Insight Nine

56% stated they experienced limited
operating hours in their last dine-in visit
During the last month on an
average week, did you have at
least 1 weekly dine-in visit?
                                 38%           62%
                                  No           Yes

                                                     56%   Limited operating
                      And did you experience               hours
                      any of the following?
                                                           Limited dining space due
                                                     54%   to labor shortages

                                                           Limited services (ex:
                                                     50%   take-out or delivery only)

                                                           Longer than
                                                     49%   usual wait times

                                                     47%   Reduced menus                15
May 2021 n=805
Insight Ten
Despite experiencing service disruptions
when dining out, 71% are likely to return
to the same restaurant
Longer than usual wait times seem to have the
greatest impact.
79% of those who did not experience long
waits are “likely” or “very likely” to return
Deep Dive
Consumers may be more
This drops down to 67% for those who experienced forgiving of COVID-19-
related disruptions such as
long waits.
limited services, dining
space or hours, but they
don’t want to wait.
May 2021 n=500 16Restaurant Menus Due to operational pressures, brands trimmed menu selections during the pandemic. Did menu changes impact consumer perception? variety, fan-favorite items and value options?
Insight Eleven

Despite restaurants’ menu reductions, 72%
of respondents said they can easily find their
favorite foods
Share of respondents who "agree" or "strongly agree“ with the statements below when it comes
to restaurant menus

Statements
I enjoy having a variety of ordering options on the menu                      76%
                                                                                               Deep Dive

I can easily find my favorite foods on the menu                               72%
                                                                                               Only 29% could no
I enjoy simple menus with a few good options                                  55%
                                                                                               longer find satisfying
I would like to see more innovation on restaurant menus                       50%              value options on the
I miss having a variety of options to choose from                             48%              menu.
I no longer find satisfying value options                                     29%
                                                                                               25% stated they can
I no longer find my favorite options                                          25%
                                                                                               no longer find their
                                                                                               favorite foods.
 May 2021 n=805
                                                                                                                        18
Summary of Insights
COVID-19 Service Expectations — Insights Dine-in vs. Off-premise — Insights
1. Guest expect continued focus on sanitation 5. Diners are eating out more. 62% of
processes and safety precautions. respondents in May ’21 reported at least 1
weekly dine-in visit vs. 42% in Feb ’21.
2. A majority (58%) of respondents expect to use a
physical menu, though 50% of Gen Zers and 6. 66% of respondents state that off-premise
44% of millennials now expect a digital menu visits were not a replacement for dine-in. Yet
when dining out. 47% Gen Z see no difference between the
experience of off-premise vs. on-premise.
3. Older generations (boomers, Gen X and
millennials) expect COVID-19 procedures in 7. Takeout is the future. More respondents see
greater percentages. Most respondents expect takeout (67%) as a vital channel going forward
to see restaurant staff wearing masks. than delivery (60%).
4. Respondents who have returned to dining out 8. Younger generations are more likely to choose
regularly expect fewer COVID-19-related takeout when ordering off-premise.
measures.Summary of Insights
Restaurant Experience — Insights Restaurant Menus — Insights
9. A majority (56%) of respondents experienced 11. Respondents are finding their favorite foods
limited operating hours during their last and finding value options, despite reduced
restaurant visit. menus.
10. Longer than usual wait times have the
greatest impact on respondents’ likelihood to
return to restaurants.
20Combo Meals at QSR Restaurants With average check growing significantly since March 2020, a large contributor of this for quick-service restaurants was the combo meal. Why exactly do customers choose to purchase combo meals from quick service restaurants?
Combo Meals at Quick-Service Restaurants:
Demographics

65%              of respondents purchased a combo meal from
                 a quick-service restaurant in the past month

Of those…
                                        47% have a household
                                        income between $30k-$74k

                                       Are predominantly millennials

                                       Live in family households

May 2021 n=484
Why Do We Purchase Combo Meals at Quick-Service Restaurants? In an open-ended question, we asked the reason for choosing combo meals. Respondents answered along 3 common themes*: 39% referenced efficiency 38% referenced economics 34% referenced product preference *The open-ended nature of the question yielded 484 comments from participants. RMS coded those responses into overarching themes and subthemes to identify key purchase drivers for combo meals and understand their relative importance for consumers. Note that the percentages reported state distinct references to the general themes and subthemes and do not add up to 100%. May 2021 n=484 23
Combo Meals at Quick-Service Restaurants:
What efficiency means

   Consumers find combo meals are
   more efficient than ordering a la
   carte. The “all-in-one” solution
   reduces the cognitive load of                    Of those…
   ordering.                           Efficiency
                                          39%
   Respondents also associated                          17%               17%                    10%
                                                                                           referred to the notion
   combo meals with ease and                        referred to the    referred to the
                                                                                           of “convenience”
                                                    notion of “ease”   notion of “speed”
   speed when looking for a quick
   meal on the go.

May 2021 n=484                                                                                               24
Combo Meals at Quick-Service Restaurants:
What economics means
Respondents cite value as a
reason to order combo meals and
believe they are more affordable
than the sum of their parts.
Of those…
Economics
Consumers are aware of the
38%
framework used to price combo 38% 16%
48%
meals. When asked how much mentioned the referred to the referred to the
cheaper a combo meal should be, word “cheap” notion of “value” notion of “deal”
no respondents offered a specific
dollar amount.
May 2021 n=484 25Combo Meals at Quick-Service Restaurants:
What is Product Preference?
Respondents reported that
combo meals thoroughly
fulfill their needs in one
price.
Product Of those…
They cited a fondness for Preferences
the items in the combo 34% 10% 9% 6%
10%
meal and liked the referred to the referred to the mentioned that referred to their
product’s ability to provide a notion of notion of it “fulfilled their “hunger”
“complete meal” “fondness” needs”
complete meal and satisfy
their hunger.
May 2021 n=484 26Combo Meals at Quick-Service Restaurants:
RMS Takeaways
Operators In a market where consumers increasingly value
speed, ease and convenience, combo meals are
may have more than just value.
more pricing Price of Combo < (Price of Entrée + Price of Side + Price of Drink)
leverage. Traditional discount rates (near 20%) may not be necessary to
a consumer base that is increasingly looking for a quick and
easy order that meets their needs. Combo meal prices should
never exceed the sum of their parts, but the market may
tolerate prices close to the ceiling.
27
May 2021 n=484Increasing margins for food service and
hospitality companies for 25 years.
We help executives and finance professionals in the restaurant
industry address profitability challenges. Our data-driven
approach to optimizing sales, menus and financial health
helps iconic brands and upcoming concepts in more than 40
countries. We currently count more than 100,000 restaurants
as clients.
Do more with your data. Partner with us today. North America: +1 813 277-0034
Europe/London: +44 (0)20 3948 1871
Visit revenuemanage.com Europe/Paris: +33 (0)1-80-96 47-00
Email us at info@revenuemanage.com
Asia/Singapore: +65 6807 0650
Or call any of our five offices across the globe.
Asia/Tokyo: +81 (03) 5326-3022
We are ready to help.You can also read