Resolving Food-Web Structure - Annual Review of Ecology, Evolution, and Systematics - Princeton University
←
→
Page content transcription
If your browser does not render page correctly, please read the page content below
Annual Review of Ecology, Evolution, and
                                                                                                                                            Systematics
                                                                                                                                            Resolving Food-Web Structure
                                                                                                                                            Robert M. Pringle and Matthew C. Hutchinson
                                                                                                                                            Department of Ecology and Evolutionary Biology, Princeton University, Princeton,
                                                                                                                                            New Jersey 08544, USA; email: rpringle@princeton.edu
Annu. Rev. Ecol. Evol. Syst. 2020.51:55-80. Downloaded from www.annualreviews.org
 Access provided by Princeton University Library on 05/11/21. For personal use only.

                                                                                       Annu. Rev. Ecol. Evol. Syst. 2020. 51:55–80          Keywords
                                                                                       First published as a Review in Advance on
                                                                                                                                            cryptic species interactions, dietary niche partitioning, DNA barcoding,
                                                                                       July 31, 2020
                                                                                                                                            environmental DNA metabarcoding, ecological network analysis,
                                                                                       The Annual Review of Ecology, Evolution, and
                                                                                                                                            specialization, generalization, taxonomic impediment, trophic niche
                                                                                       Systematics is online at ecolsys.annualreviews.org
                                                                                                                                            breadth
                                                                                       https://doi.org/10.1146/annurev-ecolsys-110218-
                                                                                       024908                                               Abstract
                                                                                       Copyright © 2020 by Annual Reviews.
                                                                                                                                            Food webs are a major focus and organizing theme of ecology, but the data
                                                                                       All rights reserved
                                                                                                                                            used to assemble them are deficient. Early debates over food-web data fo-
                                                                                                                                            cused on taxonomic resolution and completeness, lack of which had pro-
                                                                                                                                            duced spurious inferences. Recent data are widely believed to be much better
                                                                                                                                            and are used extensively in theoretical and meta-analytic research on net-
                                                                                                                                            work ecology. Confidence in these data rests on the assumptions (a) that
                                                                                                                                            empiricists correctly identified consumers and their foods and (b) that sam-
                                                                                                                                            pling methods were adequate to detect a near-comprehensive fraction of
                                                                                                                                            the trophic interactions between species. Abundant evidence indicates that
                                                                                                                                            these assumptions are often invalid, suggesting that most topological food-
                                                                                                                                            web data may remain unreliable for inferences about network structure and
                                                                                                                                            underlying ecological and evolutionary processes. Morphologically cryptic
                                                                                                                                            species are ubiquitous across taxa and regions, and many trophic interac-
                                                                                                                                            tions routinely evade detection by conventional methods. Molecular meth-
                                                                                                                                            ods have diagnosed the severity of these problems and are a necessary part
                                                                                                                                            of the cure.

                                                                                                                                                                                                               55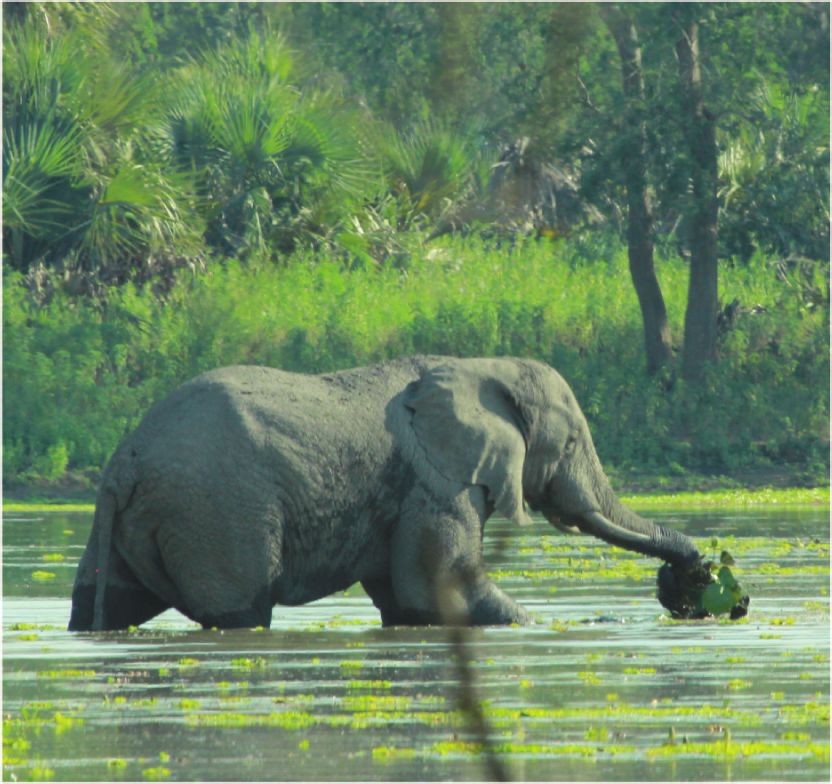
1. INTRODUCTION
                                                                                               Food web ecology has always had to deal with the demons of resolution.

                                                                                                                                                                        —Smith et al. (2011, p. 9)

                                                                                            A food web is an attempt to describe what the organisms in a community eat—their trophic inter-
                                                                                            actions with other organisms. The study of food webs has many branches, and food webs can be
                                                                                            conceptualized and drawn in various ways to derive different kinds of inferences. Accordingly, the
                                                                                            term food-web structure can signify various properties. The most literal and common usage refers
                                                                                            to a graph depicting species (as nodes/vertices) and their trophic interactions (as links/edges) with
                                                                                            other species. The structure of the food web is the topology of this network. This definition is our
                                                                                            focus, and we use structure and architecture synonymously with topology throughout, although
Annu. Rev. Ecol. Evol. Syst. 2020.51:55-80. Downloaded from www.annualreviews.org

                                                                                            we acknowledge that there are other valid meanings of food-web structure (e.g., energy pathways,
 Access provided by Princeton University Library on 05/11/21. For personal use only.

                                                                                            trophic pyramids, food-chain lengths).
                                                                                                By studying food webs and their structure, researchers seek to answer a range of questions
                                                                                            that is almost as broad as ecology itself. Indeed, it has been argued that food webs provide a uni-
                                                                                            fying framework for linking the conventional subdisciplines of ecology (Thompson et al. 2012).
                                                                                            Through the lens of food webs, ecologists investigate energy flows and nutrient transfers, popula-
                                                                                            tion dynamics, indirect effects, ecological niches and competitive interactions, species coexistence
                                                                                            and biodiversity, specialization and coevolution, ecosystem functions, the stability of populations
                                                                                            and communities, the robustness of systems to environmental changes, and various other phe-
                                                                                            nomena (Moore et al. 2018). Many studies distinguish different categories of food webs, such
                                                                                            as those involving insect hosts and their parasitoids and those consisting primarily of mutualis-
                                                                                            tic interactions between plants and their pollinators, protectors, and seed dispersers (Ings et al.
                                                                                            2009). Here, we refer to food webs inclusively to describe ecological networks of consumer-
                                                                                            resource interactions. We believe that our observations and arguments pertain equally to all such
                                                                                            networks.
                                                                                                When Smith et al. (2011, p. 9) called out “the demons of resolution,” they were referring to a
                                                                                            problem that has dogged food-web ecology since its inception. Gathering the empirical data nec-
                                                                                            essary to assemble and meaningfully study a food web of wild organisms—answering the question,
                                                                                            what do animals actually eat?—is enormously difficult for multiple reasons. Researchers have tried
                                                                                            to simplify this problem in various ways, often by lumping species into groups thought to share
                                                                                            similar characteristics or by proceeding with analyses of data that lack some substantial fraction
                                                                                            of the species (nodes) and interactions (links) actually present in an assemblage. Such aggregated
                                                                                            or fragmentary data have low resolution—they are blurry; the details are not visible. The resolu-
                                                                                            tion of food-web data is demonic because it can radically change network topology and associated
                                                                                            biological inferences in ways that are unknowable in the absence of better data. The history of
                                                                                            food-web ecology is marked by debates over whether the resolution of the data is adequate to
                                                                                            support the conclusions drawn.
                                                                                                Many important questions about food webs can be addressed without high-resolution data on
                                                                                            network topology. Examples of significant progress include greater understanding of how top-
                                                                                            down control and trophic cascades regulate species’ abundances (Power 1990, Terborgh & Estes
                                                                                            2013), of the ways in which food webs are coupled in space (Rooney et al. 2006), of the potency of
                                                                                            indirect and trait-mediated effects (Schmitz et al. 2004), and of the factors that determine food-
                                                                                            chain length (Post 2002). Not coincidentally, these advances have been fueled by the interplay
                                                                                            of testable theory, observational data, and manipulative experiments. The study of food webs as
                                                                                            networks, by contrast, is theoretically and computationally sophisticated (Delmas et al. 2019) but

                                                                                       56   Pringle   •   Hutchinson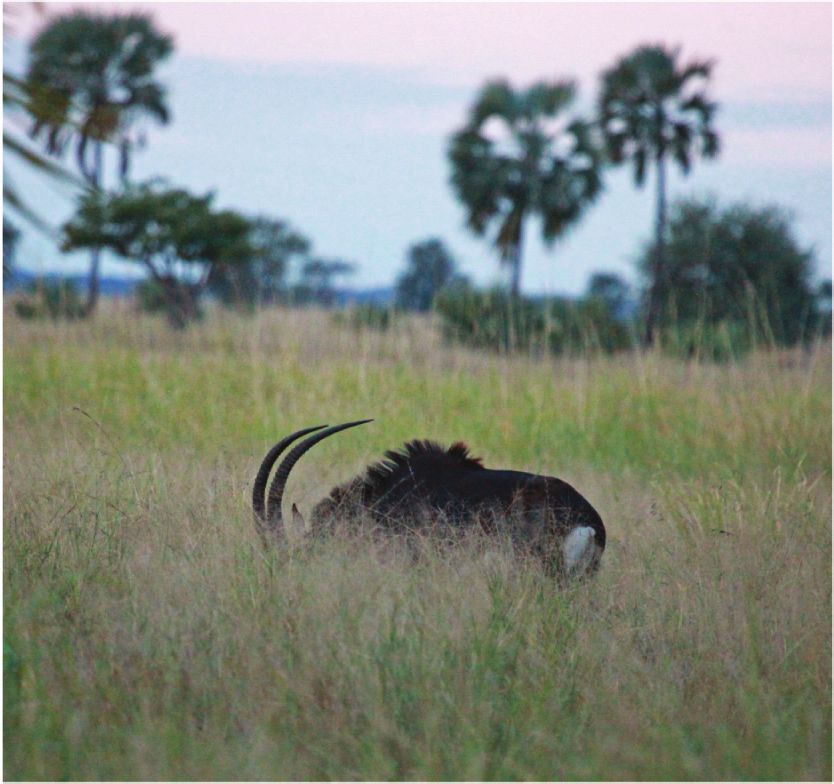
arguably has not yet produced fundamental advances in our understanding of the biology, in large
                                                                                       part because the available empirical data are simply inadequate to enable rigorous tests of mathe-
                                                                                       matical predictions or to expose the mechanisms underlying recurring statistical patterns.
                                                                                           We develop this argument below. We contend that the data sets used to analyze food-web
                                                                                       structure are in general much worse than most users appreciate. Recent research in molecular
                                                                                       ecology has cast serious doubt on things that ecologists would like to take for granted, such as the
                                                                                       ability to correctly delineate species in the field. Related work has shown that things long con-
                                                                                       sidered manageably difficult, such as the ability to compile an accurate and quasi-comprehensive
                                                                                       list of an animal’s foods, are actually extremely difficult, and that many existing lists are far more
                                                                                       incomplete and incorrect than commonly assumed. However, we also argue that the same molec-
                                                                                       ular methods that have brought the depth of these problems to light can play an important role in
                                                                                       solving them. The title of our article has two intended meanings. One highlights the importance
                                                                                       of resolving food-web data—of bringing the details into focus to the finest measurable grain. The
Annu. Rev. Ecol. Evol. Syst. 2020.51:55-80. Downloaded from www.annualreviews.org
 Access provided by Princeton University Library on 05/11/21. For personal use only.

                                                                                       other meaning of the word resolve is to bring closure to a dispute or contentious matter. In this
                                                                                       regard, early debates about the quality and resolution of food-web data remain relevant, and we
                                                                                       briefly review their history.

                                                                                       2. FOOD-WEB STRUCTURE: A BRIEF HISTORY OF IGNORANCE
                                                                                       2.1. A First Wave of Graph Theory
                                                                                          These qualitative descriptions were never intended to be data, to serve as grist for the theoretician’s
                                                                                          mill.

                                                                                                                                                                             —Paine (1988, p. 1652)

                                                                                       Quantitative food-web analysis began trending in the late 1970s, following May’s (1973) explo-
                                                                                       rations of the complexity-stability relationship and Cohen’s (1978) explorations of the statistical
                                                                                       properties of “real food webs” combed from the ecological literature. Subsequent studies, drawing
                                                                                       on an incrementally increasing number of published webs, addressed questions that remain open
                                                                                       today. Are there universal regularities of food-web organization (Cohen & Briand 1984)? What
                                                                                       determines food-web stability (De Angelis 1975) and sensitivity to species loss (Pimm 1980)? What
                                                                                       is the dimensionality of dietary niche space, and how much do niches overlap (Cohen 1978)? Are
                                                                                       food webs divided into compartments, and what does that mean (Pimm & Lawton 1980)? Is there
                                                                                       a consistent relationship between the numbers of predators and prey within communities (Briand
                                                                                       & Cohen 1984)? How long are food chains, and why (Pimm & Lawton 1977)? It briefly seemed
                                                                                       that food webs would prove “orderly and intelligible” (Pimm et al. 1991, p. 669).
                                                                                           By the mid-1990s, a string of empirical critiques had crushed this optimism (Paine 1988, Polis
                                                                                       1991, Hall & Raffaelli 1993). The supposedly real food webs were grossly incomplete and comi-
                                                                                       cally oversimplified. Resolution was uneven and biased; primary producers and small consumers
                                                                                       were typically aggregated into broad lumps (e.g., “algae,” “land vegetation,” “insects,” “fish”),
                                                                                       whereas mammals and birds were often resolved as species (e.g., “pig,” “rat,” “man,” “boobies”)
                                                                                       (Cohen 1989, figure 13.1). To standardize such webs, investigators combined organisms that al-
                                                                                       legedly shared identical sets of foods and predators into “trophic species” (Cohen 1989, p. 183).
                                                                                       Subsequent studies showed that putative generalities about food-web structure were sensitive to
                                                                                       the taxonomic resolution of the data and to the various contrivances of the analyses (Martinez
                                                                                       1993, Thompson & Townsend 2000, Winemiller 2007). Ecologists were asked to supply better
                                                                                       data (Cohen et al. 1993). When some did, it became clear that even moderately resolved whole-
                                                                                       community food webs were analytically intractable and contained many assumption-defying

                                                                                                                                                 www.annualreviews.org   •   Resolving Food-Web Structure   57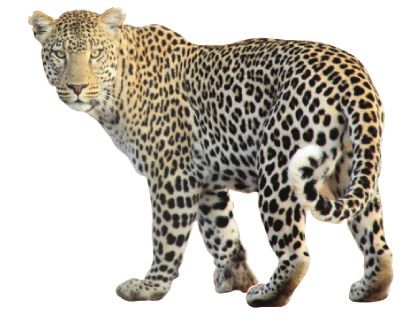
annoyances such as cannibalism, loops, and omnivory (Polis 1991). For a time, food-web ecol-
ogy turned elsewhere (Polis & Winemiller 1996, Polis et al. 2004).
Bipartite network:
a graph in which all 2.2. A Second Wave of Graph Theory: Network Ecology
links connect two
Nestedness is an interesting abstract network property that undoubtedly influences the statistical be-
separate groups of
havior of large systems of differential equations.
nodes (for example,
interactions between —James et al. (2013, p. E3)
herbivore species and
plant species)
Interest in networks accelerated at the turn of the millennium, stimulated by the growth of the
Modularity: the
internet and enabled by increasing computational power (Strogatz 2001). These developments
extent to which a web
is organized into rejuvenated the study of topological patterns in trophic networks (Dunne et al. 2002, Bascompte
compartments of et al. 2003, Pascual & Dunne 2006). The core questions have not changed fundamentally and
Annu. Rev. Ecol. Evol. Syst. 2020.51:55-80. Downloaded from www.annualreviews.org
Access provided by Princeton University Library on 05/11/21. For personal use only.
species that have many resemble those of community ecology at large, although variations and elaborations on these
interactions with each themes have proliferated—sometimes to the point of getting lost within themselves [what does
other but few with
stability even mean? (Domínguez-García et al. 2019)]. The methods and vocabulary, however,
species outside their
compartment have changed radically. Bipartite networks of predominantly mutualistic trophic interactions—
ignored in early food-web theory—have been a particularly salient focus (Bascompte & Jordano
Nestedness:
2014). The aims and claims of modern network ecology are reviewed extensively elsewhere (Ings
the extent to which
specialists interact only et al. 2009, Delmas et al. 2019), as is the multitude of metrics used to quantify various topological
with subsets of the properties (Lau et al. 2017).
species that generalists Network ecology has produced exciting theoretical developments, but once again, data are lim-
interact with iting. Model predictions are generated and debated, and then they hang, both theoretically and
Rewiring: empirically unresolved. Modularity and/or nestedness might promote diversity and/or stability,
the reorganization of or they might not (Bastolla et al. 2009, Thébault & Fontaine 2010, Allesina & Tang 2012, James
food-web links that et al. 2012, Grilli et al. 2016). Behavioral rewiring of species interactions might buffer communi-
occurs when animals
ties against extinction (Valdovinos et al. 2010) or not (Gilljam et al. 2015). Metrics abound, but
change their diets in
response to some it is unclear “which of the many available measures actually hold ecological meaning” (Delmas
perturbation, such as et al. 2019, p. 17). The latest frontier, multilayer networks that accommodate multiple types of in-
the disappearance of a teraction and spatiotemporal heterogeneity, multiplies the challenges of obtaining adequate data
preferred food (Pilosof et al. 2017).
Food-web data are limited in two respects. One is quantity. Despite the rapid growth of network
ecology over the last 20 years, the number of empirical data sets in use remains surprisingly small
and overwhelmingly wet. Cirtwill et al. (2015) found 196 usable food webs to investigate latitudi-
nal variation in niche width; of these, only 31 (16%) were terrestrial, and those were derived from
just 19 primary sources with a mean age of >50 years. The other limitation is data quality—the fa-
tal flaw of first-generation food webs. Many studies now explicitly acknowledge the importance of
consistent taxonomic resolution, and contemporary data do contain many more nodes, links, and
metadata than did early data (Ings et al. 2009). But it does not necessarily follow that “food-web
structure is well described” (Thompson et al. 2012, p. 695). The use of aggregated trophic species
persists (de Visser et al. 2011, Jacquet et al. 2016) despite considerable evidence that species shar-
ing exactly the same foods and predators should be virtually nonexistent in nature (see Section 3).
Moreover, first-generation food webs are still used for meta-analysis despite their known defects.
Critical evaluations of recent data have highlighted inadequacies and asymmetries of sampling
effort, which bias inferences by missing rare species and/or interactions (Blüthgen 2010, Fründ
et al. 2016, Jordano 2016). This is indeed a crucial issue, but not the only one. Another is whether
data gatherers have correctly identified nodes and links (Poisot et al. 2016). There has been little
scrutiny of this latter issue, but there is cause for concern.
58 Pringle • Hutchinson
3. THE ROOTS OF IGNORANCE ABOUT FOOD-WEB STRUCTURE
                                                                                          Detailed information about the diet of the majority of free-ranging mammals and birds does not exist
                                                                                          and often only the most generalized approximation of food items consumed is known.

                                                                                                                                                                              —Jordan (2005, p. 108)

                                                                                       Jordan’s statement is as true today as it was 15 years ago—and it pertains to mammals and birds,
                                                                                       which are better known than anything else. A food web is a collection of diets; if detailed dietary
                                                                                       information does not exist, then no well-resolved food web is possible. Our ignorance of what wild
                                                                                       animals actually eat has multiple causes, some of which have been discussed for decades. Others
                                                                                       have gone mostly unmentioned, even if they are widely perceived by field biologists. Still others
                                                                                       have only recently become apparent and reveal that our ignorance is even deeper than anyone had
                                                                                       realized. In this section, we discuss these causes, focusing mostly on three issues that we believe are
Annu. Rev. Ecol. Evol. Syst. 2020.51:55-80. Downloaded from www.annualreviews.org
 Access provided by Princeton University Library on 05/11/21. For personal use only.

                                                                                       underappreciated—at least in their scale and scope. In the process, we touch upon developments
                                                                                       in molecular ecology that have brought problems to light but also offer solutions; we expand on
                                                                                       these developments in Section 4.

                                                                                       3.1. Taxonomic Impediments and Pseudotaxonomy
                                                                                          I am also frustrated by working for a half century in the field, nurtured and guided at long distance by
                                                                                          the world’s best taxonomists, among hundreds of thousands of species of organisms, most of which are
                                                                                          actually known to science yet can be identified in the field, at best, by only a select few.

                                                                                                                                                                              —Janzen (2004, p. 732)

                                                                                       It is exacting work to accurately identify most wild organisms to the species level, even for a tax-
                                                                                       onomic specialist with a mint-condition specimen. Thus, a major question for food webs is not
                                                                                       just how finely resolved the nodes are, but also how and by whom the nodes were identified. Most
                                                                                       ecological studies provide little to no methodological information about taxonomic identifica-
                                                                                       tion, and only a tiny minority involve professional taxonomists or deposit reference specimens in
                                                                                       permanent collections (Bortolus 2008). Many community-level studies group look-alikes as mor-
                                                                                       phospecies, which frequently confounds ecologically important distinctions in ways that cannot
                                                                                       be reconstructed after the fact (Figure 1; Section 3.2).
                                                                                           The frequency and severity of taxonomic misidentifications in the community-ecology litera-
                                                                                       ture has never been quantified but is undoubtedly high, even in intensively studied communities
                                                                                       (Egli et al. 2020). Gotelli’s (2004) personal account of struggling to identify North American ant
                                                                                       species resonates with our own experiences. For example, when a list of Kenyan savanna plants
                                                                                       compiled by ecologists (Goheen et al. 2013) was refined by DNA barcoding in collaboration with
                                                                                       botanists (Gill et al. 2019), a wide variety of identification errors came to light and the list grew
                                                                                       considerably (Pringle 2020). This example is probably fairly typical of community-level studies by
                                                                                       taxonomic amateurs. In several well-documented cases, such errors have led to flawed biological
                                                                                       inferences and catastrophic management decisions (Bortolus 2008). And taxonomic errors propa-
                                                                                       gate once they are etched into the literature and incorporated into public databases (Vilgalys 2003;
                                                                                       but see Leray et al. 2019). Knowlton & Jackson (1994, p. 8) pointed out that “‘pseudotaxonomy’
                                                                                       is just as much an impediment to understanding as ‘pseudoreplication,”’ but ecology has yet to
                                                                                       confront the implications of this impediment.
                                                                                           For most food-web inferences, the correct application of currently accepted Latin names
                                                                                       (if those even exist) is not overwhelmingly important. What is essential is that taxa have been

                                                                                                                                                  www.annualreviews.org   •   Resolving Food-Web Structure   59
correctly distinguished—or, if taxa are unavoidably lumped, that the boundaries of the lumps are
at least knowledgeably defined (Roslin et al. 2013). These things cannot be assumed even for the
small set of putatively highly resolved food webs that are commonly used and reused in network
analyses.
a b Consumers lumped Consumers distinguished
c
Acanthaceae Hare A
Amaranthaceae Hare B
Plant family
A Convolvulaceae
Crassulaceae
B Fabaceae
Malvaceae
Annu. Rev. Ecol. Evol. Syst. 2020.51:55-80. Downloaded from www.annualreviews.org
Access provided by Princeton University Library on 05/11/21. For personal use only.
Poaceae
Solanaceae
0.1 0.3 0.5
Lepus saxatilis Lepus capensis
Food plants (colored by family) Hares Mean RRA
d e f
30 Food plants
20
10
Count
0
Astraptes audax Astraptes inflatio
7.5 Parasitoids
5.0
2.5
0
0 0.25 0.50 0.75 1.00
Food plants Astraptes caterpillars Parasitoid wasps
(colored by
Pairwise dissimilarity
Astraptes favilla Astraptes obstupefactus Caterpillars eaten by Parasitoid flies
Same Different
family) Apanteles diniamartinezae Apanteles diniamartinezae
Figure 1
Failure to distinguish cryptic species distorts food-web structure and masks ecological specialization. (Top row) Splitting hares alters
inferences about diet breadth and composition. (a) Scrub hare (Lepus saxatilis) and Cape hare (Lepus capensis) co-occur in central Kenya
but are virtually indistinguishable in the field. Kartzinel et al. (2019) sequenced hare DNA (D-loop of the mitochondrial control region)
and plant DNA (P6 loop of the chloroplast trnL intron) from fecal samples, which revealed two hare haplotypes with significantly
different diets; these types could not be conclusively matched with Latin binomials based on GenBank accessions and were
provisionally labeled A and B. (b) Bipartite networks show the trophic interactions inferred when hares A and B are lumped (left) or
distinguished (right); food-plant taxa are colored by family, and link widths reflect the relative read abundance (RRA) of plant DNA
sequences in fecal samples (data from Kartzinel et al. 2019, including only sequences that accounted for ≥1% of RRA per sample).
(c) Bar graph shows the mean RRA (+1 SE) of DNA from eight top plant families in samples from hares A and B; the former’s diet is
dominated by legumes (Fabaceae), whereas the latter eats more grass (Poaceae). (Bottom row) DNA barcoding (mitochondrial CO1)
resolved 10 morphologically cryptic species of skipper butterfly—lumped for more than 100 years under the name Astraptes
fulgerator—all from within just 1,260 km2 in Área de Conservación Guanacaste, Costa Rica (Hebert et al. 2004). (d) Adult males of four
of these species: Astraptes audax (voucher: 02-SRNP-29798); Astraptes inflatio (voucher: 02-SRNP-20353); Astraptes favilla (voucher:
06-SRNP-55033); and Astraptes obstupefactus (voucher: 97-SRNP-1804). Barcoding similarly resolved many cryptic parasitoid species.
(e) These discoveries transformed the tripartite network of food plants (left in each network; colored by family), caterpillars (center;
yellow), and parasitoids (right; red, wasps; pink, flies). Braconid wasps formerly known as Apanteles leucostigmus resolved into 36 highly
specialized cryptic species (Smith et al. 2008, Fernandez-Triana et al. 2014), one of which, Apanteles diniamartinezae, eats six of the
cryptic Astraptes species (dark outlines in the network on the right). ( f ) Histograms show distributions of pairwise Bray-Curtis
dissimilarities between caterpillar species in terms of their food plants and parasitoids (1 indicates total difference), showing that the 10
cryptic butterfly species occupy extremely different ecological niches. Photographs in panel a reproduced with permission from
BIOSPHOTO/Alamy Stock Photo (left), Nature Photographers Ltd./Alamy Stock Photo (right). Photographs in panel d reproduced
with permission from D. Janzen and W. Hallwachs.
60 Pringle • Hutchinson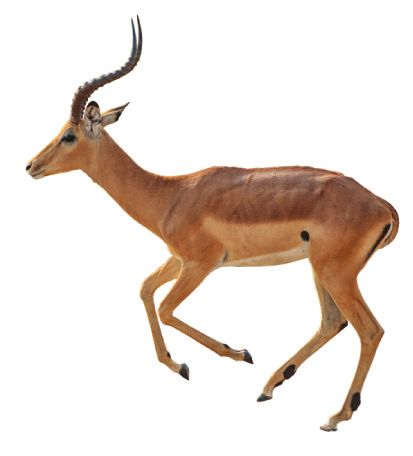
3.2. The Problem of Cryptic Species
                                                                                          It makes no sense to describe the interaction structure of nodes which in themselves are poorly defined.

                                                                                                                                                                       —Roslin et al. (2013, p. 2)

                                                                                       Many currently accepted Latin binomials are in fact complexes of two or more genetically and eco-
                                                                                       logically distinct lineages that are difficult or impossible to distinguish morphologically (Knowlton
                                                                                       1993). The discovery of such cryptic species has accelerated with the advent of modern molecular
                                                                                       diagnostics, especially DNA barcoding (Hebert et al. 2004; Smith et al. 2006, 2007, 2008; Janzen
                                                                                       et al. 2017). Cryptic species are not confined to diverse and poorly studied biotas, nor to small
                                                                                       and inconspicuous taxa. Indeed, they appear to be remarkably evenly distributed across taxa and
                                                                                       biogeographic regions (Pfenninger & Schwenk 2007).
                                                                                           The ubiquity of cryptic species massively compounds the problems associated with inexpert
Annu. Rev. Ecol. Evol. Syst. 2020.51:55-80. Downloaded from www.annualreviews.org

                                                                                       taxonomy and the resulting mischaracterization of biodiversity, co-occurrence patterns, niche
 Access provided by Princeton University Library on 05/11/21. For personal use only.

                                                                                       relationships, specialization, individual variation, population dynamics, species interactions, and
                                                                                       network architecture. When cryptic species are distinguished, seemingly widespread generalist
                                                                                       species resolve into multiple more-specialized ones (Knowlton & Jackson 1994, Janzen et al.
                                                                                       2009, Smith et al. 2011). In central Kenya, two outwardly indistinguishable species of hare (Le-
                                                                                       pus spp.) were detected using mitochondrial DNA and were found to have significantly different
                                                                                       diets (Kartzinel et al. 2019). Field observations alone would indicate a single hare morphospecies
                                                                                       with a broader and more indiscriminate dietary niche than either of the cryptic species actually
                                                                                       has (Figure 1a–c). An unresolved complex of cryptic specialists will also appear to be both more
                                                                                       numerous and more intraspecifically variable than its constituent species really are. The relation-
                                                                                       ships between abundance, generalization, and network structure is one area of current interest
                                                                                       (Fort et al. 2016, Dormann et al. 2017) where a failure to distinguish cryptic species will thwart
                                                                                       progress. The causes and consequences of individual variation (Araujo et al. 2011, Clegg et al.
                                                                                       2018) is another.
                                                                                           The implications of cryptic species for inferences about food webs and the biology of the
                                                                                       species involved are powerfully illustrated by the plant-caterpillar-parasitoid food web of the dry,
                                                                                       rain, and cloud forests of Área de Conservación Guanacaste (ACG) in Costa Rica (Figure 1d–f ).
                                                                                       An inventory that began in 1978 has reared ∼850,000 caterpillars of ∼7,000 Lepidoptera species,
                                                                                       along with ∼3,000 species of fly and wasp parasitoids of those caterpillars ( Janzen et al. 2009,
                                                                                       Janzen & Hallwachs 2016). For the comparatively well-studied butterflies and moths, 10–20% of
                                                                                       morphologically characterized species turn out to be multispecies complexes in light of DNA bar-
                                                                                       codes and collateral ecological data on habitat affiliation and larval food plants (Hebert et al. 2004;
                                                                                       Janzen et al. 2009, 2017). Although there are many variations in the hundreds of such complexes
                                                                                       discovered thus far (reviewed in Janzen et al. 2009, Janzen & Hallwachs 2016), the adults are typ-
                                                                                       ically morphologically very similar to completely indistinguishable, often including the genitalia
                                                                                       and other characters used by taxonomists to describe and identify species, whereas the caterpil-
                                                                                       lars are often morphologically distinct and eat different food plants (sometimes sympatrically and
                                                                                       sometimes not). Sometimes morphological features previously assumed to reflect individual vari-
                                                                                       ation are discovered to be diagnostic of species differences in the hindsight of genetic informa-
                                                                                       tion (and sometimes not). The parasitoids of these caterpillars include many more species than
                                                                                       previously thought, are much more specialized than previously assumed, are only occasionally
                                                                                       generalists, and are mostly undescribed (Smith et al. 2006, 2007, 2008; Fernandez-Triana et al.
                                                                                       2014; Arias-Penna et al. 2019). One of the few (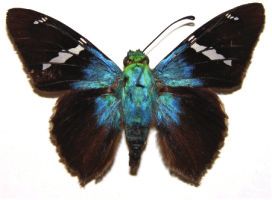
caterpillar species (Smith et al. 2008). Crypticity can result from shallow divergence, selection for
morphological similarity [i.e., mimicry ( Janzen et al. 2009)], or simply the lack of selection for any
morphological dissimilarity that a human can perceive ( Janzen et al. 2017).
Host-parasitoid webs are a staple of the network-ecology literature, in part because they are
believed to be empirically tractable and “usually resolved to the level of biological species” (Ings
et al. 2009, p. 256). In ACG, this only became true after specimens were routinely DNA barcoded
starting in 2004. The 25-year-long, professional-taxonomist-assisted inventory up to that point
had been conflating hundreds of cryptic species as well as incorrectly splitting some species in
which extreme sexual dimorphism had led taxonomists to assign different names to males and
females ( Janzen et al. 2009). The lessons of ACG are not peculiar to the tropics (Kaartinen et al.
2010, Smith et al. 2011) or to insects. Killer whales go by one name (Orcinus orca) but include
multiple genetically differentiated, sympatric types that specialize on different prey (LeDuc et al.
2008). Other examples span everything in between wasps and whales (Pfenninger & Schwenk
Annu. Rev. Ecol. Evol. Syst. 2020.51:55-80. Downloaded from www.annualreviews.org
Access provided by Princeton University Library on 05/11/21. For personal use only.
2007).
3.3. The Problem of Cryptic Interactions
Even if one were to stand beside the animal, it would be difficult to identify which individual plants
were being eaten.
—Talbot & Talbot (1962, p. 131)
Even for noncryptic species, trophic interactions are difficult to quantify by any means. Visual
observations are especially problematic. Organisms that are nocturnal, small, rare, shy, remote, or
hidden (in soil, sediments, or other organisms) are all hard to observe. Many interactions happen
in the blink of an eye—zap, a lizard ate an insect, but which insect? Others are easy to overlook.
Scavengers eat dead meat but also invertebrates within the carrion (Polis 1991). Gut contents and
fecal macroremains often can be identified only to family or order (if that). Many interactions
are infrequent and atypical and are thus unlikely to be detected or deduced: Leopards eat fish
(Balme et al. 2019), sharks eat birds (Drymon et al. 2019), wolves eat grasshoppers (Barton et al.
2020), hippos eat elephants and other hippos (Dudley et al. 2016). Such rare interactions may
strongly influence consumer fitness and community dynamics (e.g., Dudley et al. 2016), as well as
assumptions about forbidden links in food webs ( Jordano 2016). Indeed, weak links and their con-
figuration are thought to be important in stabilizing food webs (McCann et al. 1998, Jacquet et al.
2016; but see Allesina & Tang 2012), and their omission can bias network metrics and inferences
about specialization.
Powerful insights about food webs have emerged from studies of animals that eat slowly in
plain sight, such as sea otters (Tinker et al. 2008), starfish (Paine 1966), and big cats (Balme et al.
2019). Even for this least-cryptic category of consumers, the issues of Sections 3.1 and 3.2 apply.
Moreover, the amount of time and effort required to approach a comprehensive dietary database
is far greater than is typical of ecological field studies (Figure 2).
Cryptic interactions can profoundly affect inferences about food-web topology. In an Arctic
Connectance: host-parasitoid web, the addition of molecular diagnostics to a database of rearing records tripled
the proportion of all the number of links, the connectance, the number of host taxa per parasitoid taxon (generality),
possible interactions in and the number of parasitoid taxa per host taxon (vulnerability) (Wirta et al. 2014). Nestedness
a network that actually
occur
increased ninefold. Parasitoids that attack host eggs or pupae were missed by rearing but were
detected by sequencing host DNA from adult parasitoids. In other host-parasitoid webs world-
wide, DNA barcoding has simultaneously resolved both cryptic taxa and cryptic interactions,
with variable effects on overall network architecture (Kaartinen et al. 2010, Hrcek et al. 2011,
62 Pringle • Hutchinsona Leopard (South Africa) b Impala (Kenya)
50
80
40 n = 1,000 2013–2016
Number of food-plant taxa
Number of prey species (S)
Proportion of kills
2013–2015
0.6
S = 32.6 n = 5,598 60 2013–2014
0.4
2013
30
n = 250 0.2
S = 50
0.0
S = 19.4 0 20 40
Prey species' rank in diet 40
20
n = 100
S = 13.5
20
10
Annu. Rev. Ecol. Evol. Syst. 2020.51:55-80. Downloaded from www.annualreviews.org
Access provided by Princeton University Library on 05/11/21. For personal use only.
n = 20
S = 6.6
0 0
0 1,000 2,000 3,000 4,000 5,000 0 50 100
Number of observations Number of fecal samples
Figure 2
Intensive sampling is required to characterize diet composition and detect infrequent interactions. (a) Rarefaction curve of leopard
(Panthera pardus) dietary richness as a function of sampling effort (n = 5,598 observations of 146 leopards over 6 years) in Sabi Sands
Game Reserve, South Africa (data from Balme et al. 2019). Impala (Aepyceros melampus) accounted for 54% of kills, and three prey
species (all antelopes) collectively accounted for 75% of kills, meaning that leopards contribute a few strong and many weak links to the
food web. Many infrequent prey (e.g., birds, catfish, pangolin, hyena, other leopards) were detected only with extraordinary sampling
effort. Insets are rank-abundance distributions of diet composition at different sampling intensities (n observations in each inset); the
prevalence of dominant prey is conserved across sampling depths, but dietary species richness (S in each inset) decreases sharply as
sampling effort decreases. A food web constructed on the basis of even 1,000 observed kills would contain fewer than two-thirds of the
prey species actually eaten by this leopard population, thereby omitting many weak links. (b) Sample-based rarefaction of dietary
richness for impala in Laikipia, Kenya, based on DNA metabarcoding of fecal samples collected over four field seasons [data from
Kartzinel et al. 2019, including only sequences that accounted for ≥1% of relative read abundance (RRA) per sample]. Curves show the
richness of food-plant taxa after one year (2013, 48 samples, 63 foods), two years (2013–2014, 74 samples, 73 foods), three years
(2013–2015, 114 samples, 80 foods), and four years (2013–2016, 129 samples, 85 foods). Metabarcoding enables the identification of
many foods with few samples, yet dietary richness nonetheless increases as cumulative sample size grows and infrequent interactions are
detected. Photographs reproduced from (a) https://commons.wikimedia.org/wiki/File:Panthera_pardus_(passant_regardant).jpg;
copyright Martyn Seddon (CC0 1.0) and (b) https://commons.wikimedia.org/wiki/File:Trotting_impala_ram.jpg; copyright 2012
Hein Waschefort (CC BY-SA 3.0 US).
Smith et al. 2011). As in Costa Rica’s ACG, the trend is often toward greater specialization, but
not always (Wirta et al. 2014). The difference might depend on the prevalence of cryptic species,
which by definition cannot be more generalized than the original morphospecies.
Trophic interactions involving large generalist consumers are often cryptic in a different way.
It is easy to watch an elephant eating but hard to quantify the diet of an elephant population
(Figure 3). Early studies of African ungulates, noting that “the observational method proved of
very limited value” (Talbot & Talbot 1962, p. 131), analyzed stomach contents of shot animals.
In one study of 71 shot elephants in Uganda, the two most abundant foods were “mature grass”
and “young grass” (Buss 1961, p. 134)—a family-level taxonomic identification (Poaceae). Other
such studies resolved many grasses to genus or species but lumped other food taxa to family or
coarser (Talbot & Talbot 1962). Conventional alternatives to shooting large numbers of animals,
such as visual observation followed by identification of bitten stems (Kleynhans et al. 2011) or fecal
microhistology (Hansen et al. 1985), are notoriously effort-intensive and tricky to get right. The
few attempts to build food webs for African savannas have combined records from early studies
www.annualreviews.org • Resolving Food-Web Structure 63a
Elephant (Loxodonta africana) Sable (Hippotragus niger) Bushbuck (Tragelaphus sylvaticus)
Annu. Rev. Ecol. Evol. Syst. 2020.51:55-80. Downloaded from www.annualreviews.org
Access provided by Princeton University Library on 05/11/21. For personal use only.
b c
Food plants
Herbivore species
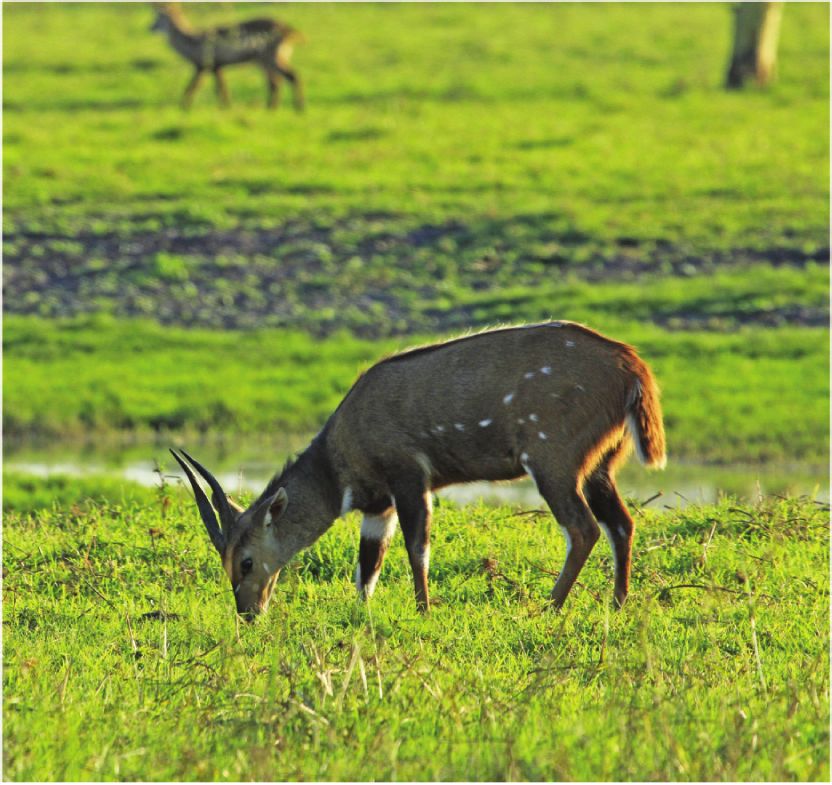
Figure 3
Observational diet assessment is difficult even for the world’s largest and most conspicuous land animals. (a) Left to right, foraging
African savanna elephant (Loxodonta africana), sable antelope (Hippotragus niger), and bushbuck (Tragelaphus sylvaticus) in Gorongosa
National Park, Mozambique. Even through powerful binoculars, it is impossible to identify (much less quantify) all plant species being
consumed. (b) Bipartite network of unweighted (presence-absence) links from observational records of 11 herbivore species (yellow) and
181 food plants (blue) in Gorongosa over five years (data from Tinley 1977). (c) Fecal DNA metabarcoding of the same 11 Gorongosa
herbivore species during just one dry season detected 25% more total interactions involving a comparable number of plant taxa (n =
151) and enabled the weighting of links using the relative read abundance (RRA) of plant DNA sequences (data from Pansu et al. 2019,
including only sequences that accounted for ≥1% of RRA per sample).
to build unweighted networks (Baskerville et al. 2011) or aggregated all basal resources into a
handful of categories (de Visser et al. 2011). Recently, fecal DNA metabarcoding has been used to
construct highly resolved networks for entire communities of large herbivores, which has clarified
the taxonomic and phylogenetic dimensions of diet composition (Kartzinel et al. 2015, 2019; Pansu
et al. 2019; Kartzinel & Pringle 2020). Analysis of one such data set reaffirms previous conclusions
(Hall & Raffaelli 1993, Martinez 1993, Thompson & Townsend 2000, Winemiller 2007) that the
taxonomic resolution of food-web data matters for ecological inference (Figure 4).
64 Pringle • HutchinsonCryptic interactions are also common in mutualistic networks. Plant-pollinator networks are
overwhelmingly constructed on the basis of observational flower-visitation data. Leaving aside
the considerable challenge of correctly identifying and distinguishing all visitors (Figure 1d), such
plant-centered sampling can bias the network structure ( Jordano 2016). When visitation data have
been supplemented with microscopic identification of pollen grains from captured pollinators,
network metrics changed markedly (Bosch et al. 2009, Olesen et al. 2011). A DNA-metabarcoding
study of insect pollen loads in French heathland quadrupled the number of interactions and al-
tered essentially all metrics of network structure relative to a visitation data set (Pornon et al.
2017). Environmental DNA (eDNA) from flowers can also be used to detect insect visitation
Taxonomic resolution
High Low
mOTU Genus Family
Annu. Rev. Ecol. Evol. Syst. 2020.51:55-80. Downloaded from www.annualreviews.org
a
Access provided by Princeton University Library on 05/11/21. For personal use only.
Food plants Herbivore species
b
Frequency
6 6 6
4 4 4
2 2 2
0 0 0
20 40 60 80 20 30 40 50 60 10 15 20 25 30
Degree (number of food plants) Degree (number of food plants) Degree (number of food plants)
c
Axis 2
Axis 1 Axis 1 Axis 1
0.67 0.70 0.83 0.87 0.97 0.93 0.93 0.93 1.00 0.97 0.99 0.96
Plains zebra Grevy's zebra Cattle Buffalo Elephant Impala Giraffe Dik-dik
Figure 4
(Continued)
www.annualreviews.org • Resolving Food-Web Structure 65d Taxonomic resolution
High Low
mOTU Genus Family
Annu. Rev. Ecol. Evol. Syst. 2020.51:55-80. Downloaded from www.annualreviews.org
Access provided by Princeton University Library on 05/11/21. For personal use only.
Plant taxa
Relative read abundance
0.04 0.16 0.36
Small Large
Proportion of diet
Module membership
of herbivores
Herbivore species
(Caption appears on following page)
66 Pringle • HutchinsonFigure 4 (Figure appears on preceding page)
Taxonomic resolution affects food-web structure. Fecal DNA metabarcoding data on plant taxa in large-herbivore diets in Kenya
were progressively coarsened from molecular operational taxonomic units (mOTUs, left) to genus (center) and family (right) [data from
Kartzinel et al. 2019, including only sequences that accounted for ≥1% of relative read abundance (RRA) per sample]. In this data set,
62% of plant mOTUs matched a single Latin binomial, 27% matched one genus, and 11% matched multiple genera or were resolved
only to family. (a) Bipartite networks showing links (weighted by RRA) between 24 herbivore species (yellow, including elephant
and all ungulates represented by ≥10 fecal samples) and food-plant taxa (blue; n = 165 mOTUs, 121 genera, 41 families). Mean
dietary diversity decreases, and network connectance increases, as resolution is coarsened. (b) Degree distributions (histograms with
10 bins each, showing the number of herbivore species with a given number of trophic links) shift as taxonomic resolution decreases.
(c) Nonmetric multidimensional scaling ordinations illustrating the dietary dissimilarity (reflected by separation in the plots) among
eight dominant herbivore species (colored 90% confidence ellipses; data points, corresponding to individual fecal samples, are not
shown). At mOTU-level resolution, all species pairs exhibit some degree of dietary resource partitioning, which decreases when data
are coarsened to genus level; at family-level resolution, the assemblage collapses into three guilds (grazers, browsers, and mixed-feeders)
with near-total niche overlap within guilds. Beneath each panel are pairwise Pianka niche-overlap values (1 indicates total overlap) for
the four pairs of species (colors) with the most similar diets (plains and Grevy’s zebra, Cape buffalo and cattle, impala and elephant, dik-
Annu. Rev. Ecol. Evol. Syst. 2020.51:55-80. Downloaded from www.annualreviews.org
Access provided by Princeton University Library on 05/11/21. For personal use only.
dik and giraffe). (d) Network modularity (rows, plant taxa; columns, herbivore species; shading, RRA of each plant taxon in each herbivore
diet). Modularity decreases, and the module membership of herbivores (dashed boxes) changes, as taxonomic resolution decreases.
(Thomsen & Sigsgaard 2019), suggesting a way to combine individual-level plant- and animal-
centered sampling, analogous to the combination of host- and parasitoid-centered DNA barcod-
ing by Wirta et al. (2014).
Non-consumptive predator-prey interactions are important in food webs (Schmitz et al. 2004,
Ings et al. 2009, Valdovinos et al. 2010, Pringle et al. 2019). Topologically, these are links that
could be strong but are in fact weak or absent owing to anti-predator responses by prey. Such
interactions are inherently cryptic, but accounting for them is often essential for understanding
ecological dynamics. For example, on small Bahamian islands, an experimental invasion of large
predatory lizards decimated populations of two smaller Anolis lizard species (Pringle et al. 2019).
The intuitive explanation was that the large species simply ate many of the smaller ones. However,
PCR assays and DNA metabarcoding of the predator’s feces, coupled with isotopic analysis of tail
tissue, indicated that the predator mostly ate insects and only rarely ate Anolis lizards (which had
rapidly moved into arboreal refuges to avoid the predator). This habitat shift intensified compe-
tition between the Anolis species for space and food, contributing to the decline of both species.
In this study, molecular methods were key in documenting both the rarity of intraguild predation
and the signatures of interspecific competition (dietary niche shifts and overlaps). This example
also illustrates how behavioral responses can complicate efforts to predict network structure on
the basis of trait matching or co-occurrence (Pilcher et al. 2020).
3.4. Other Problems
Various other empirical problems degrade the quality of data used for the analysis of food webs and
other ecological networks. These have been more frequently discussed, but they have not gone
away. Most of them ultimately stem from the enormous effort required to catalog and quantify
species interactions in the field.
Sampling intensity is a problem regardless of the methods used to infer links (Blüthgen 2010,
Fründ et al. 2016, Jordano 2016) (Figure 2). A key question is how to interpret the absence of an
otherwise plausible interaction: Is it because that link is forbidden by phenological mismatches or
other trait incompatibilities, or is it because the network was studied for too little time with too
few observations ( Jordano 2016)? Similarly, is a species with only one documented link really an
extreme specialist, or were its other interactions simply not observed (Bosch et al. 2009)?
Food webs are spatiotemporally dynamic, but measurements are discrete. A consumer may eat a
food in one place or time but not others. Such contingency can be problematic when investigators
www.annualreviews.org • Resolving Food-Web Structure 67pull data from widely dispersed literature sources to assemble food webs [as many do by necessity
(Baskerville et al. 2011, de Visser et al. 2011)]. Such amalgamated data are likely to mix and match
ecological factors, leading to the assembly of webs that may not have existed in any real place at
any actual time.
Data on interaction strengths and on species’ traits and relative abundances greatly inform
the study of ecological networks, and they are often necessary to resolve ambiguities that arise
otherwise (Ings et al. 2009, Dormann et al. 2017, Gaiarsa & Guimarães 2019). But such data are
rarely available. Cohen et al. (2009, p. 22335) found only three food webs with “relatively complete
trophic link data and with average body mass and population density data for each taxon,” and two
of them were from the same lake in different years. The number has not increased much, if at all,
since then.
Individuals within a population often differ dramatically in diet—depending on size, physiolog-
ical condition, behavioral plasticity, habitat heterogeneity, species interactions, and other factors—
Annu. Rev. Ecol. Evol. Syst. 2020.51:55-80. Downloaded from www.annualreviews.org
Access provided by Princeton University Library on 05/11/21. For personal use only.
and such intraspecific variation affects food-web structure (Clegg et al. 2018). In populations
with pronounced individual specialization, poorly resolved data or insufficient sampling effort
may severely distort perceptions of the population-level diet. Within one 0.5-ha field, Roeder &
Kaspari (2017) found that fire ants (Solenopsis invicta) were extreme trophic generalists, but that in-
dividual colonies were consistently specialists ranging from herbivores to predators-of-predators.
3.5. The Upshot and Universality of These Problems
Food webs are simply proving to be composed of more nodes linked in more ways than we ever knew.
—Roslin & Majaneva (2016, p. 616)
Data on the structure of real food webs have never been good; whether they have been even ad-
equate for the purposes of previous studies is impossible to know until the conclusions of those
studies can be tested against data sets that account for the issues described above. Some authors
appear to have concluded that the demons of resolution have been vanquished. Thompson et al.
(2012, p. 691) implied that the “limitations of older data” had been “dealt with,” while Ings et al.
(2009, p. 253) celebrated “a new catalogue of evermore complete, taxonomically resolved, and
quantitative data.” These sentiments are true insofar as the earliest food webs were so crude that
any attention to biological detail is an improvement. But research during the last 10 years has
exposed how stubborn the demons of resolution really are. Ecologists have not gotten better at
taxonomy—if anything, the reverse—and professional taxonomic expertise continues to starve for
resources. Cryptic taxa and interactions are ubiquitous, and resolving them can transform network
topology and associated inferences about structural generalities, species’ roles, niche breadth and
overlap, competition and indirect effects, individual variability, generalization and specialization,
coevolution, functional redundancy, and many other phenomena that ecologists study (Figures 1–
4). These issues are common to tropical, temperate, boreal, and polar regions; to terrestrial, fresh-
water, and marine environments; and to traditional food webs, mutualistic networks, and host-
parasitoid networks.
4. OPPORTUNITIES AND CHALLENGES IN FORENSIC
FOOD-WEB ANALYSIS
4.1. Molecular Tools for Diet Analysis
Many of the problems reviewed above have been illuminated by the use of molecular methods to
resolve network nodes and links, particularly DNA barcoding and metabarcoding, although the
68 Pringle • Hutchinsonpotential arsenal of tools is larger (Pompanon et al. 2012, Roslin & Majaneva 2016, Taberlet et al.
2018). These techniques have been developed and refined by molecular ecologists, but over the
last five years they have increasingly merged into the ecological mainstream (Zinger et al. 2019).
Here, we provide a minimalist overview of these methods and refer readers to recent reviews
for details, caveats, and best-practice guidelines (Cristescu & Hebert 2018, Taberlet et al. 2018,
Deagle et al. 2019).
Barcoding and metabarcoding involve the amplification and sequencing of a short and tax-
onomically diagnostic genomic region (DNA barcode). Barcoding with Sanger sequencing is
used for individual organismal samples that yield relatively high-quality DNA and hence longer
barcodes [500–1,000 bases for commonly used plant and animal markers (Hebert et al. 2003,
Hollingsworth et al. 2011)], which facilitate taxonomic identification. Metabarcoding with high-
throughput sequencing is used for complex soups of DNA from many taxa, including bulk organ-
ismal samples and eDNA samples such as feces, gut contents, and pollen loads (in which the DNA
Annu. Rev. Ecol. Evol. Syst. 2020.51:55-80. Downloaded from www.annualreviews.org
Access provided by Princeton University Library on 05/11/21. For personal use only.
is often degraded by digestion and/or environmental exposure). Diversity, degradation, and the
capacity of high-throughput sequencing platforms necessitate reliance on shorter sequences that
can be amplified with conserved primers, and there is generally a trade-off between taxonomic
breadth and taxonomic resolution (Pompanon et al. 2012).
Either barcoding or metabarcoding can be used to reconstruct trophic interactions, depending
on the study design (e.g., Wirta et al. 2014, Kartzinel et al. 2015). We focus primarily on metabar-
coding of fecal and other eDNA samples, which has the greatest potential to transform food-web
data because it enables broad-spectrum and high-resolution characterization of vast numbers of
samples using standardized methods, with considerable economies of scale (Evans et al. 2016).
High-throughput sequence data are typically clustered into molecular operational taxonomic units
(mOTUs), which are then identified to the finest taxonomic category possible by comparison to
DNA reference libraries. Data can be presented as frequencies of occurrence (the proportion of
samples that contain an mOTU) and/or as relative read abundances (RRA; the proportion of se-
quence reads per sample of an mOTU). These metrics offer complementary information about
the intensity of an interaction (Deagle et al. 2019). RRA is often assumed to be a first-order ap-
proximation of proportional diet composition. This assumption is strong and loaded with caveats
(see Section 4.3); it performs reasonably well in some contexts (Willerslev et al. 2014, Craine et al.
2015, Kartzinel et al. 2015) and worse in others (Deagle et al. 2010). Judicious interpretation is
required.
Barcode-based approaches have repeatedly been shown to yield higher taxonomic resolution
and accuracy than the available alternatives for characterizing diets (Deagle et al. 2009, Soininen
et al. 2009, Newmaster et al. 2013, Wirta et al. 2014). They consistently detect interactions
that would otherwise go unrecorded. They enable large sample sizes, which does not bypass the
sampling-intensity problem but does alleviate it (Figure 2). And they have other desirable fea-
tures. Fecal samples can generally be collected more easily than animals can be observed (and
noninvasively). Fecal samples also provide individual-level data and can thus be used to create
individual-based and trait-based networks (Ings et al. 2009). Moreover, frequency of occurrence
and RRA provide imperfect but often decent proxies for interaction intensity (Deagle et al. 2019).
Taxonomically verified DNA reference libraries based on vouchered reference specimens
are essential to maximize the reliability of DNA-based diet analyses. Global databases such as
GenBank (Leray et al. 2019) and BOLD (Ratnasingham & Hebert 2007) are good and getting
better. Ideally, each study would create its own local reference library and deposit the specimens
in museums and the sequences in public databases, thereby supporting strong system-specific in-
ferences while simultaneously augmenting global repositories. For example, Gill et al. (2019) bar-
coded 460 of an estimated 500 plant species thought to occur at a Kenyan site and deposited the
www.annualreviews.org • Resolving Food-Web Structure 691,781 specimens in herbaria, where they were identified by botanists; this local reference database
was then used to characterize the diets of the 33-species large-herbivore community via metabar-
coding of 1,322 fecal samples (Kartzinel et al. 2019).
4.2. Opportunities
The potential of metabarcoding and allied techniques to inform network ecology is recognized
(Evans et al. 2016, Poisot et al. 2016), but the marriage is just beginning. We believe that this union
is essential and urgent in light of the problems reviewed in Section 3. With it, we expect to gain
not just more complete and taxonomically resolved networks but also fresh insights in a number
of conceptual and applied arenas.
4.2.1. Dietary niches: cryptic differentiation is common. Metabarcoding has been used to
Annu. Rev. Ecol. Evol. Syst. 2020.51:55-80. Downloaded from www.annualreviews.org
Access provided by Princeton University Library on 05/11/21. For personal use only.
probe subtleties of niche partitioning and overlap. In Kenyan large herbivores, mOTU-resolution
data confirmed a canonical niche axis, proportional grass consumption, but also revealed a distinct
axis of niche partitioning at the level of plant species (Kartzinel et al. 2015) (Figure 4c). In Wales,
Lucas et al. (2018) discovered resource partitioning between species and genera of generalist hov-
erflies (Syrphidae), contrary to expectation—and contrary to the common practice of lumping
all hoverflies as a single functional group in pollination studies. In Jamaica, insectivorous bats
exhibited cryptic dietary separation that corresponded with differences in echolocation behavior
(Emrich et al. 2014). Many similar examples are emerging of cases in which the dietary differences
between coexisting species were simply never perceivable using conventional methods, which is
one reason why the continuing use of aggregated trophic species in network analysis is likely to
misrepresent biological reality.
4.2.2. Nutritional ecology. Combining dietary metabarcoding with data on the traits of food
items can be used to characterize the nutritional ecology of free-ranging animals, which has long
been difficult (Raubenheimer 2011) and is needed for captive husbandry and breeding programs
( Jordan 2005). This has recently been attempted for large herbivores in Mozambique’s Gorongosa
National Park (Branco et al. 2019). Incorporation of data on animals’ age, sex, condition, and
movements further expands the range of potentially answerable ecological questions (Atkins et al.
2019).
4.2.3. Specialization and individual variation. Because of its sensitivity and because it allows
large sample sizes, metabarcoding enhances the detectability of rare interactions that otherwise
complicate the diagnosis of population-level specialization, which in turn underpins inferences
about coevolution, coextinction, and the causes of network modularity (Dormann et al. 2017). Pre-
dictions about populations’ robustness or fragility to disturbance may depend on which dimension
of dietary specialization is considered. Analysis of one of the most extensive fecal-metabarcoding
data sets compiled to date found that large herbivores can be taxonomic generalists (high dietary
species richness) but phylogenetic specialists (few dietary lineages) and vice versa (Kartzinel &
Pringle 2020).
Metabarcoding data can also be used to evaluate ideas about individual-level specialization,
such as the niche-variation hypothesis (Bison et al. 2015, Pansu et al. 2019). However, a single fe-
cal sample or pollen load per individual (integrating some few days of consumption) may often be
an insufficient representation of individual niche breadth. The noninvasiveness of fecal sampling
creates the opportunity for repeated sampling of known individuals and hence fuller characteri-
zation of individual variation. Few studies have yet capitalized on this opportunity.
70 Pringle • HutchinsonYou can also read