RESIN City Assessment Report Greater Manchester - www.resin-cities.eu - RESIN project
←
→
Page content transcription
If your browser does not render page correctly, please read the page content below
RESIN
City Assessment Report
Greater Manchester

Work Package          4

Dissemination Level   PU

Lead Partner          ICLEI – Local Governments for Sustainability

Due Date              29 February 2016

Submission Date       29 February 2016

www.resin-cities.eu
Deliverable No.                D4.1

Work Package                   4

Dissemination Level            PU

                               Matt Ellis | Association of Greater Manchester Authorities
Authors
                               Jeremy Carter and Angela Connelly | University of Manchester

Editor                         Alice Reil | ICLEI – Local Governments for Sustainability

Date                           28 February 2016

File Name                      D4.1_ City Assessment Report Greater Manchester_ICLEI_2016-02-29

Status                         Revised

Revision                       Completed

                               Matt Ellis | Association of Greater Manchester Authorities
                               Jeremy Carter and Angela Connelly | University of Manchester
Reviewed by
                               Eric Luiijf | TNO
                               Clara Grimes | ICLEI – Local Governments for Sustainability

This document has been prepared in the framework of the European project RESIN – Climate
Resilient Cities and Infrastructures. This project has received funding from the European Union’s
Horizon 2020 research and innovation programme under grant agreement no. 653522.

The sole responsibility for the content of this publication lies with the authors. It does not necessarily
represent the opinion of the European Union. Neither the EASME nor the European Commission are
responsible for any use that may be made of the information contained therein.

CONTACT:                                                                              This project is funded
                                                                                      by the Horizon 2020
                                                                                      Framework
Email: resin@tno.nl                                                                   Programme of the
                                                                                      European Union.
Website: www.resin-cities.eu

                                                   RESIN City Assessment Report | Greater Manchester           1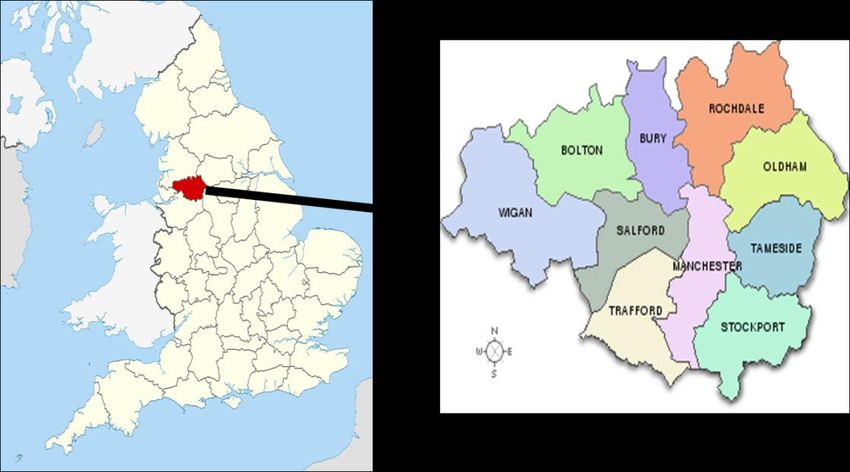
Executive Summary .................................................................................................... 4

1 ..... Introduction ......................................................................................................... 5

2 ..... Greater Manchester’s socio-economic, physical and climate
        characteristics ..................................................................................................... 7

2.1 .. Social and economic characteristics ................................................................ 7

People .......................................................................................................................... 7

Societal Vulnerability .................................................................................................. 10

Economy ...................................................................................................................... 11

2.2 .. GM’s urban fabric and critical infrastructure features ..................................... 11

Transport infrastructure.............................................................................................. 11

Utilities infrastructure ................................................................................................. 12

Social Infrastructure .................................................................................................... 12

Other built environment assets .................................................................................. 13

2.3 .. GM’s changing climate ....................................................................................... 13

Recent and future weather and climate trends ......................................................... 13

Climate change projections ........................................................................................ 14

2.4 .. Climate change implications for GM’s society, economy, infrastructure
       and built environment ......................................................................................... 15

3 ..... State of adaptation and critical infrastructure protection planning and
        activity in GM ....................................................................................................... 17

3.1 .. EVIDENCE: Existing climate change risk and vulnerability data and
       assessments........................................................................................................ 17

National level risk information ................................................................................... 17

Regional level risk information .................................................................................. 18

Research focussed on GM.......................................................................................... 18

GM level/cross authority studies/reports .................................................................. 19

Local/Municipality level studies ................................................................................. 20

3.2 .. POLICIES AND PLANS: Existing adaptation and critical infrastructure
       protection plans and strategies ......................................................................... 20

                                                           RESIN City Assessment Report | Greater Manchester                   2
National/sector level Plans and Strategies................................................................ 21

GM level plans and strategies (including emerging/currently developing) ............ 21

Critical Infrastructure specific plans and strategies (with GM
      footprint/coverage) ............................................................................................. 22

Legal and financial frameworks for supporting planning and implementation ..... 23

3.3 .. SUPPORTING DELIVERY: The stakeholder landscape in Greater
       Manchester .......................................................................................................... 24

Integration of adaptation and critical infrastructure protection plans and
     strategies ............................................................................................................. 24

Political commitment .................................................................................................. 25

Communication throughout planning processes/stakeholder engagement .......... 26

3.4 .. IMPLEMENTATION of adaptation and critical infrastructure protection
       measures ............................................................................................................. 27

4 ..... Main challenges and opportunities with regards to adaptation and critical
        infrastructure protection .................................................................................... 28

4.1 .. Challenges ........................................................................................................... 28

4.2 .. Opportunities....................................................................................................... 29

4.3 .. GM’s achievements in terms of adaptation and critical infrastructure
       protection to date ................................................................................................ 30

4.4 .. GM’s needs for adapting to climate change impacts and protecting
       (critical) infrastructure ........................................................................................ 31

References ................................................................................................................... 32

                                                         RESIN City Assessment Report | Greater Manchester                 3
Executive Summary
RESIN is a 3.5-year EU-funded interdisciplinary research project investigating climate resilience in
European cities that launched on 6 May 2015. The project combines existing approaches to climate
change adaptation and disaster risk assessment to develop guidelines and tools to support cities in
adapting to a changing climate.
Four city assessment reports will allow the RESIN project partners and the RESIN cities, Bratislava,
Bilbao, Greater Manchester (GM) and Paris, to assess which adaptation and Critical Infrastructure
Protection (CIP) strategies, plans and measures are already in place or planned. This will enable a
better understanding of the options and decision-support tools and products that may best be suited to
the specific local context of each of these four European cities and which of them might best be tested
within the course of the project. The reports will also enable the local government, the stakeholders in
the cities as well as the RESIN partners to better understand each city’s needs in the adaptation and
CIP process.
GM is delighted to be part of the Climate Resilient Cities and Infrastructures (RESIN) project. The
project focuses on urban climate change risk and resilience, with a particular focus on ‘critical’
infrastructure. It will help us to further our understanding of the potential impacts of extreme weather
and climate change, and support action to build the climate resilience of our city. As one of the
UNISDR’s ‘role model’ resilient cities, GM recognises that building resilience is a continual process,
not a fixed outcome. It is also significant that high level strategy documents, including the Greater
Manchester Strategy, support the need to take action on this agenda. Extreme weather events disrupt
our everyday lives in the present, and we recognise the need to increase our resilience both now and
in the future to related risks and those linked to the changing climate. Doing so will help to safeguard
the health and well-being of our citizens, protect our investments and, ultimately, ensure that GM is a
good place to live and work.
This report outlines the work that has been done to date in the field of climate change adaptation and
resilience in GM. It also looks at the characteristics of the city-region that may make it susceptible to
harm from extreme weather events, and the factors that influence the city-region’s capacity to adapt.
Key messages include:
There is demonstrable political commitment towards building resilience and adapting to the
changing climate across the city-region;
A complicated and evolving governance structure, with new powers for the Greater Manchester
Combined Authority (GMCA), can support the climate change agenda locally;
A legal and political mandate exists to act, with supportive policies and strategies at multiple
levels of government;
There is a complicated landscape of numerous public and private stakeholders involved in CIP
and urban climate change adaptation and resilience more broadly;
GM faces some significant deprivation issues in certain parts of the city-region that have a
bearing on the vulnerability of some residents to the changing climate.
The data and statements are to the best of the current knowledge that exists within the GM RESIN
team. Other data may exist, and GM’s participation in the RESIN project provides the opportunity to
reduce knowledge gaps as the project progresses.
RESIN City Assessment Report | Greater Manchester 4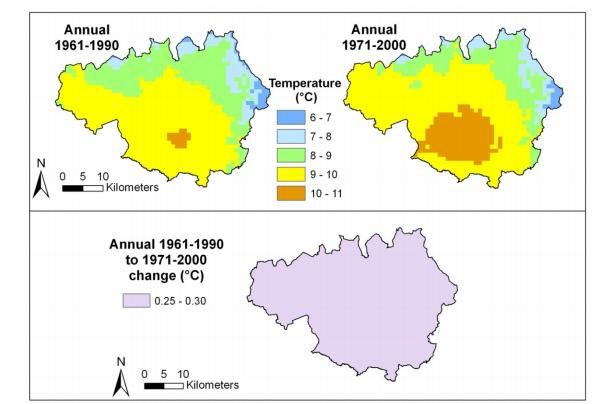
1 Introduction
Greater Manchester (GM) was at the heart of the industrial revolution, becoming the world’s first
industrial city. This brought great wealth, but also substantial environmental and social problems. Over
many years, much of the environmental damage arising from its industrial heritage, such as water
quality and contaminated land, has been addressed.

As a result, parts of GM have been transformed in economic, social and environmental terms.
However, the significant regeneration and economic growth, which has driven this transformation has
not overcome all of GM’s issues. A number of its communities are amongst the most deprived in the
UK. Some parts of GM still suffers considerable negative environmental effects from the industrial
legacy. There are also current pressures including loss of urban green spaces, air pollution and the
impacts of extreme weather and climate change (AGMA/TEP 2008).

The ongoing efforts to transform GM and address its challenges need to be looked at in the context of
a changing climate. GM’s response to this challenge needs to be considered collectively by its ten
constituent local authority districts (Fig. 1), who work in partnership with a number of public and private
sector partners ranging from the emergency services, health, housing and service providers to
infrastructure and utility companies and operators. GM influences and is influenced by processes
operating in the wider region that the climate change agenda must consider, including flows of people
(via transport networks) and resources (e.g. water from the Lake District).

                  Fig. 1: Map of the ten GM districts in context of England (Matt Ellis, GMCA)

Even now, extreme weather events impact upon GM’s citizens, economy and its ecosystems (see
section 2.3).

GM’s future climate risk is also expected to conspire with other economic, health and social factors.
This will significantly affect some of our most vulnerable communities, putting them at higher risk from
GM’s changing climate. Crucially, GM’s climate risk, if not understood and addressed, may undermine
wider efforts and investments within the city to deliver its sustainable economic growth and social
wellbeing aspirations. GM is not alone in needing to face this challenge. And, like many cities across
the world, GM is starting to develop and share learning around how to prioritise and link action on
climate change to a wider urban economic competitiveness offer.

GM therefore recognises that, alongside a pressing need to reduce greenhouse gas emissions, it must
adapt and increase its’ climate resilience, particularly of its critical infrastructure. So, it is notable that
                                                   RESIN City Assessment Report | Greater Manchester         5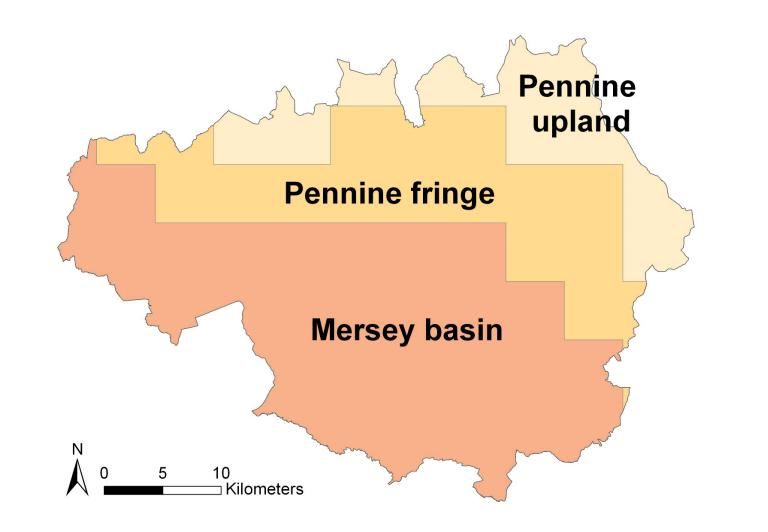
both Stronger Together - the Greater Manchester Strategy and the Greater Manchester Climate
Change Strategy reflect the imperative; to ‘be prepared for and actively adapting to a rapidly
changing climate’ (GMCA, 2012: 2) and to ‘protect our communities from the extreme weather
events which are now unavoidable’ (GMCA, 2013: 18).
GM is able to approach these emerging climate challenges from a position of strength and opportunity
for the following reasons:
The new style of local governance born out of many years of collaboration across the ten local
authority districts that make up GM, such that they became the UK’s first statutorily recognised
Combined Authority in 2011.
A range of powers being devolved from central Government, which will enable GM and its
elected Mayor to have greater legislative, operational and fiscal control of local health, transport,
housing and planning decision-making and budgets. Particularly relevant is an enhanced
responsibility for local transport and a £300m housing investment fund for an additional 15,000
new properties over a ten year period.
GM is England’s first city region to begin developing a Spatial Framework which, when adopted
in 2018, will become the statutory joint Development Plan for GM for the period up to 2035. This
plan will guide investment in long-term economic, housing and infrastructure development, and
addressing its environmental (including climate change) priorities.
The long standing history of collaboration between GM and its districts, and GM with local
universities and research partners on themes linked to climate change impacts and adaptation.
The RESIN project providing the latest opportunity to further support the City’s adaptation and
resilience goals.
The remainder of GM’s City Assessment Report sets out its climate adaptation and CIP baseline and
the challenges and opportunities it faces in increasing its climate resilience. This report has been
prepared both in the context of climate resilience as a stated priority for GM, and also for its role as a
case study city within the RESIN project. The report includes:
A summary of the climate risk GM is projected to face in the context of its key social, economic
and physical/infrastructure characteristics;
An overview of where GM is in its efforts to understand, plan and start to deliver climate
adaptation and CIP actions to address future climate issues; and
An indication of the emerging set of GM challenges, opportunities and needs around climate
adaptation and CIP.
RESIN City Assessment Report | Greater Manchester 6
2 Greater Manchester’s socio-economic,
physical and climate characteristics
This section looks in more detail at the economic, social, and physical characteristics of GM and their
key relationships to the climate change risk and resilience. It also examines how GM’s climate is
changing and how this process, interacting with the city regions other characteristics, will continue to
affect the conurbation over the coming decades.
2.1 Social and economic characteristics
2
GM covers an area of 1,277 km with a population of 2.7m, which is growing and will continue to grow,
according to projections, although at a slower rate (Oxford Economics 2014). Table 1 provides an
overview of the key statistics.
Area 1,277 km2
Population 2.7 million
Population Growth (2001 – 2011) 19 %
Estimated population growth (2013 – 2037) 12.4 %
GVA (2014) GBP 54 billion
Tab. 1: Key area and population statistics for GM. Sources: ONS 2014a; Oxford Economics, 2014.
People
A more detailed breakdown of GM’s demographic characteristics follows:
Age - Around 65% of GM’s population is between the ages of 16 – 64. Projections indicate an
aging society. According to the projections, the older age group (over 65) will increase from
474,000 to 644,000 between 2021 and 2037.
Health - GM has seen the overall health of residents improve for several decades including an
increase in life expectancy, a decline in infant mortality, and a fall in overall mortality rates
(Public Health England, 2015). Despite these trends, health in GM is still below the UK average
which indicates the need for continuing improvement in the overall health of residents. It should
be noted that health inequality in the United Kingdom is correlated with high deprivation; thus
reducing deprivation should reduce health inequalities (Marmot, 2010). People in poor health
may be more vulnerable to extreme weather events and the consequences of infrastructure
failure (e.g. reduced access to healthcare).
Employment and Education - The proportion of GM’s economically active population
(between the ages of 16 and 65) has slightly increased from 70.0 per cent to 70.8 per cent
between 2001 and 2011. Almost 8 per cent of GM’s population was unemployed at the last
census (2011); this figure has increased by 2.9 per cent since the previous census (2001). The
service industry contains the highest number of employee jobs across GM (just over one million
employees) (See ONS 2015a).
In 2015, average weekly earnings across England’s north-west region (which includes GM), for
RESIN City Assessment Report | Greater Manchester 7full-time employees working over 30 hours per week, were £488.80 per week. This is less than
England’s southern regions but higher than, for example, Yorkshire and England’s north-east.
The UK average is £528 (ONS 2015b).
Levels of educational attainment across GM vary. Around 25% of the population do not have
any qualifications due to a range of factors including the tendency for older people to not have
qualifications. The GM figure is slightly above the average for England and Wales (22.7%).
Another quarter (24.2%) has a degree or higher qualification. Fig. 2 shows the full data against
the national averages (ONS 2014b).
Other qualifications
Type of Qualification
Degree Level or above
2+ A-levels or equivalent
Apprenticeship
5+ GCSEs or equivalent England and Wales
1-4 GCSEs or equivalent Greater Manchester
No Qualifications
0 5 10 15 20 25 30
Per cent
Fig. 2: Educational qualification distribution (Census 2011), GM compared with the England and Wales average.
Source: Office for National Statistics, 2014b.
RESIN City Assessment Report | Greater Manchester 8 Ethnic diversity - GM is ethnically diverse,
although there are significant differences
between the ten local authority districts. In
terms of climate change, some communities
may not be connected to the social networks
that underpin resilient responses to extreme
weather events, and therefore may be more
vulnerable should events occur (Lindley et al.
2011). Issues include communicating flood
warnings and resilience approaches where
English is not the first language. In response, Fig. 3: Chinatown, Manchester during Chinese
the local authority district of Rochdale, for New Year celebrations. Source: Pete
example, has developed sewer flood risk Birkinshaw, 2008, via wikicommons. Licensed
information in Urdu and Bengali (Twigger- for reuse under a CC-BY-2.0
Ross et al. 2015: 76).
Deprivation - Deprivation in England is based on an Index of Multiple Deprivation (IMD) with
seven domains (weighted) including health, crime, living environment and income. The figures
are relative to other local authorities in England; that is, local authority districts are ranked
between 1 and 32,844. The rankings are divided into ten equal groupings (deciles) Figure 4
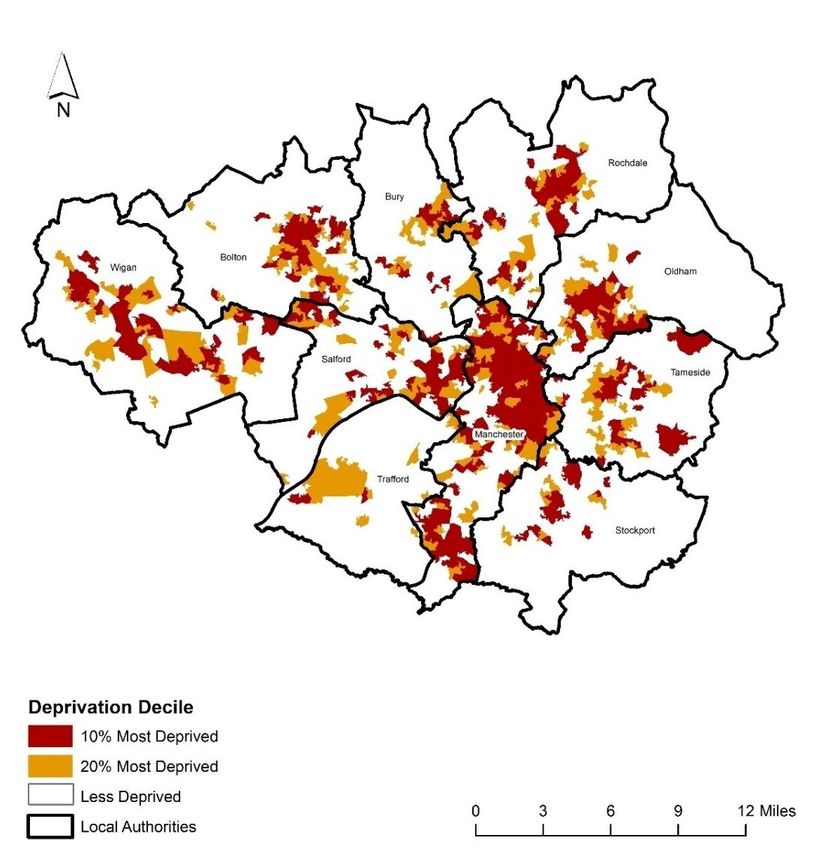
shows significant contrasts in the spatial distribution of deprivation across GM: 63% of GM
wards have an IMD score above the English average. Deprivation is evident in levels of child
and pensioner poverty, which are particularly acute in the Manchester local authority district
(Greater Manchester Poverty Commission, 2012). When spatially represented, it can be seen
that areas which fall within in the top ten per cent for deprivation in England are located in the
urban centres to the north and east of GM, such as Manchester (particularly to the north of the
district), Rochdale, Oldham and Bolton (Fig. 4). Many of the areas that are exposed to certain
climate hazards (for example flooding) are also the residential locations of people who are less
able to cope with and adapt to the current risk of extreme weather events, and the changing
climate.
RESIN City Assessment Report | Greater Manchester 9Fig. 4: Spatial distribution of deprivation across Greater Manchester based on the Indices of Deprivation 2015. The
Indices of Deprivation 2015 have been published using the Open Government License (OGL) version 3.0, see
www.nationalarchives.gov.uk/doc/open-government-licence/version/3/ The Indices of Deprivation 2015 have been
constructed for the Department for Communities and Local Government (DCLG) by Oxford Consultants for Social
Inclusion (OCSI).
Societal Vulnerability
The previous points highlight the parts of the population who may be more vulnerable to a changing
climate. Whilst there is no single definition of vulnerability at GM level, national level research and
information point to the identification of particular groups or characteristics of populations which affects
their vulnerability to various impacts, especially from a changing climate. Certain factors may make
people more vulnerable, such as social isolation, a short length of residency in an area and the
tenancy status of residents. In addition, the specific circumstances people live in also make them more
vulnerable than others. Amongst them are very young children and older people, people in poor health
and with poor mobility and access, residents living in damp or inefficient housing and people on low
incomes (see www.climatejust.org.uk). This has been explored for surface water flooding in GM within
the EcoCities project (Kazmierczak and Cavan 2011).
RESIN City Assessment Report | Greater Manchester 10Economy
GM’s Gross Value Added (GVA) in 2014 was approximately £54 billion; this has increased from £34.9
1
billion in 1991. GM, as a whole, outperforms England’s north-west region (in which it is located) but
does not outperform the UK (Oxford Economics 2014). In terms of delivering employment, the biggest
increases between 2008 and 2014 were in professional and scientific activities as well as admin and
support services. The highest decreases occurred in the manufacturing and construction sectors
(Oxford Economics 2014). GM’s economy consists of a large number of small-to-medium enterprises
2
(SMEs) . There are 86,255 SMEs; their numbers are increasing across the north-west of England
(ONS 2015a). It is likely that the number of SMEs will continue to increase. It should be noted that
approximately 85% of SMEs have between 0 and 9 employees, which may pose issues for their
capacity to address the risk of climate change on their business (ONS, 2015a).
2.2 GM’s urban fabric and critical infrastructure features
Infrastructure planning and CIP are a national priority for the UK government. Nine sectors are
regarded to be ‘critical’ at the national level: ‘food, energy, water, communications, transport, health,
emergency services, government, and finance’ (Cabinet Office, n.d: 12). GM’s draft Spatial
Framework (2015) follows this, but adds ‘social infrastructure’. For GM, CI is categorised as:
Transport infrastructure – air (Manchester), rail, port (Salford) tram (metrolink), road, walking
and cycling;
Utilities infrastructure – gas, electricity, heat, digital connectivity, water and waste water;
Social infrastructure – schools and education, health services, community facilities, recreation
3
provision and green infrastructure .
An open data map of key infrastructure and other environmental information has been produced by
the GM Local Enterprise Partnership’s (LEP) Infrastructure Advisory Board. This includes spatial
information on various utilities and transport infrastructure networks within GM, including a range of
information on public service facilities and a wider network of infrastructure. This, along with the
natural environment information shown, represents an increasingly comprehensive spatial picture of
many of the key and connected urban systems which operate and support the functioning of the
conurbation in socio-economic and environmental terms. The map includes basic flood risk
information but does not yet represent wider climate change impacts, and the impacts these would
have on the current infrastructure (and its capacity) as presented.
This map has been delivered to provide underpinning evidence for economic growth and spatial land
use plans. Further development of the open data mapping process is occurring which is starting to
map (and identify new) future development for housing and employment sites.
Transport infrastructure
GM has a mix of public transport options including bus, rail and light rail. Transport for Greater
Manchester (TfGM) is the public body responsible for coordinating transport across GM including
1
GVA for GM is measured by NUTS3 area and is divided into two main areas: Greater Manchester North (which
includes Wigan, Bolton, Bury, Rochdale and Oldham) and Greater Manchester South (which includes Salford,
Trafford, Manchester, Stockport and Tameside).
2
An SME can be defined as a business with under 250 employees.
3
Green infrastructure is treated separately in other GM strategies, for example Manchester City Council has a
Green and Blue Infrastructure Strategy.
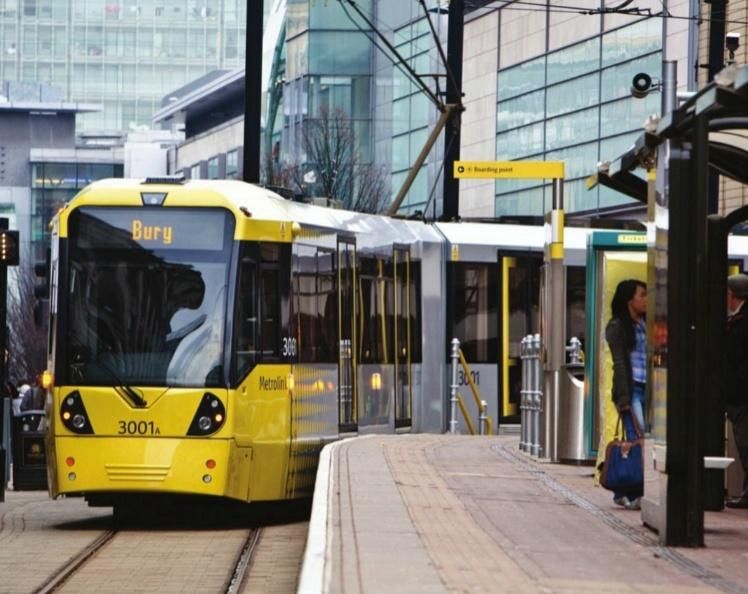
RESIN City Assessment Report | Greater Manchester 11planning, investments and maintenance. In terms of light rail, the Metrolink (Fig. 5) is in receipt of
significant investment form TfGM (£1.4 billion) to increase the size of the network. Other investments
are being made to improve the cycle network. TfGM are currently preparing their strategy - Greater
Manchester Transport Strategy 2040: Our Vision – which is due for publication in 2016.
Fig. 5: Bury Tram at Market Street Station, Manchester. Source: Duncan Hull, 2012 via Flickr. Licensed for reuse
under a CC-BY-2.0
Additional transport investments include £560 million for the Northern Hub rail scheme (completed c.
2019). The UK Government has also designated the Manchester Airport Enterprise Zone and there is
ongoing work at the port of Salford and the Manchester Ship Canal. These will deliver significant
economic benefits, connect Greater Manchester to other global cities and will help to improve
connectivity between areas within the conurbation to improve job access in the most deprived areas
(GMCA, 2013) shown in Figure 4.
Utilities infrastructure
Utilities such as the communication and electricity networks have been mapped on the GM Open Data
infrastructure map. However, this does not contain information on the extent to which these items are
resilient to extreme weather events, nor their susceptibility under the context of a changing climate.
Section 3 provides details of national requirements, through the UK’s Climate Change Act (2008), for
the major utilities to report their progress on understanding climate change risk to their assets. The
extent of the dependencies between utilities infrastructure with regard to climate change is currently
not well known.
Social Infrastructure
The EcoCities Spatial Portal for GM maps social infrastructure, such as emergency services,
hospitals, educational establishments and homeless shelters, in relation to GM’s UHI and in terms of
flood risk. Some of these elements are governed by existing guidance in order to make them more
resilient to climate change, most notably through the National Health Service (NHS) Heatwave Plan,
which is regularly updated. It is important to note that social infrastructures are elements at risk, but
may also assist in increasing resilience by, for example, designating them as cooling centres during a
heatwave, or as a central point of help when recovering from floods (see, for example, Kazmierczak
2012).
RESIN City Assessment Report | Greater Manchester 124
It is also notable that GM is increasingly seeing green infrastructure as critical infrastructure. For
example, Manchester City Council’s Green and Blue Infrastructure Strategy states that:
“Green and blue infrastructure will be a core component of Manchester’s plans to 2025. It
is as important as our other types of infrastructure; energy, transport, water, waste,
telecommunications and others.” (Manchester City Council 2015: 4)
Some green infrastructure assets have been mapped on the GM open data infrastructure map.
Other built environment assets
As at 2013, GM’s current rate of house building is around 3,000 units per annum; however, the target
is 9,200 per annum (GMCA 2013). The developing GM Spatial framework will examine whether the
rate should be further increased.
GM, because of its long history of redevelopment, contains many different building types from different
periods – in both the housing and commercial sectors. This has implications in a changing climate. A
predominance of terraced housing (particularly in the north of the conurbation) may pose issues for
the protection of individual homes from flooding as they are within interconnected blocks. Significantly,
the proportion of semi-detached and detached houses, and properties that are owner occupied,
decreases across GM neighbourhoods where the urban heat island (UHI) effect increases. This
suggests that rented, high rise properties may be vulnerable to increasing temperatures (Kazmierczak
2012).
Industry and investment areas are often sited close to key pieces of infrastructure. So for example
Media City and the Salford Quays regeneration are linked to the Manchester Ship Canal and there is
significant associated activity (including a new Manchester Airport City Enterprise Zone) linked to
Manchester Airport itself and its surrounding infrastructure. In the regional centre (central
Manchester), many commercial office blocks are high rise with glazed curtain walling, which may have
significant implications under increasing temperatures for the comfort of their occupants, and may
therefore need to be adapted. There have also been large investments in energy efficiency retrofitting
programmes, which will continue help GM realise its low carbon emissions targets (GMCA 2013).
2.3 GM’s changing climate
Recent and future weather and climate trends
GM can be split into three distinct climate zones (Cavan, 2011) with different seasonal precipitation
and temperature profiles:
4
Broadly defined as a strategically planned network of high quality natural and semi-natural areas with other
environmental features, which is designed and managed to deliver a wide range of ecosystem services and
protect biodiversity in both rural and urban settings. (European Commission 2013b) European Commission,.
2013. Building a green infrastructure for Europe. European Union: Brussels. Doi: 10.2779/54125
Note: Green infrastructure may incorporate both landscape and water features, the latter of which may be termed
‘blue infrastructure’. Other terms include ‘green-blue infrastructure’ and ‘green and blue infrastructure’
RESIN City Assessment Report | Greater Manchester 13Fig. 6: The three climate zones of GM (Cavan 2010)
The areas closest to the Pennine upland tend to be cooler (and wetter) than the urban core around the
Mersey basin:
Fig. 7: Annual average daily mean temperature for GM, 1914-2000
(Cavan, 2010)
The overall trend in GM is towards a warming climate (Cavan 2010; Fig. 7). Historic reports of extreme
weather events indicate that flooding is the most prevalent extreme weather event to have impacted
on GM over recent decades, and that pluvial flooding in particular is becoming more common (Carter
and Lawson, 2011).
Climate change projections
Cavan (2011) provides a full overview of climate projections for GM. The main headlines are:
5
A greater number of cooling degree days
6
A decreasing number of heating degree days
5
An annual measure of the extent to which temperatures suggest that buildings may require some form of cooling
(e.g. air conditioning) is based on the daily temperature being above a specified threshold (22°C).
UKCIP website, 2011 (http://www.ukcip.org.uk/glossary/)
RESIN City Assessment Report | Greater Manchester 14 Drier summers
Wetter winters
More frequent and intense extreme weather events, particularly strong winds, storms (although
projections on future changes to these hazards are limited) and associated periods of high level
short duration rainfall.
The projections highlight that GM may face a greater risk of flooding and heat stress over the coming
decades.
2.4 Climate change implications for GM’s society, economy,
infrastructure and built environment
The expected changes to GM’s climate, when viewed in the context of its social, demographic and
physical characteristics, have some specific implications. Understanding these and the interplay
between the climate and the socio-economic and physical urban on the one hand, and biophysical
fabric characteristics of GM on the other, is essential in identifying and addressing its climate
vulnerability.
The EcoCities project identified three areas of focus for acting on climate change adaptation in GM.
These were:
Safeguarding future prosperity;
Protecting the most vulnerable in society; and
Building the resilience of critical infrastructure.
Extreme weather events and climate change may disrupt economic prosperity. Therefore, in order
to protect the up-front investments as well as realising their future value, it is necessary to ensure that
infrastructures and the built environment more generally (and the economic activity this underpins) are
made increasingly resilient to extreme weather-related phenomena. It should be noted that SMEs are
a group who are currently particularly vulnerable to extreme weather events and may lose out, due to
loss of earnings for example, if there is a flood (Wedawatta and Ingirige, 2012).
Also the significant variability in levels of social vulnerability (including its spatial distribution) across
GM, means that certain groups (and locations) may be less able to prepare for, respond to, and
recover from extreme weather events as well as adapt to the changing climate (Lindley et al., 2011).
Robust analyses of these trends and subsequent policy responses at the GM level, within spatial
planning and infrastructure planning for example, can underpin local activities and priorities that seek
to increase the resilience of vulnerable neighbourhoods to the changing climate. Understanding the
proximity to critical infrastructure that may be at risk of extreme weather events and climate change,
as well as the potential knock-on implications and cascading affects across sectors and spatial scales,
may help to increase the resilience of the most vulnerable in society.
GM’s infrastructure helps to support good quality of life and economic prosperity. It follows that these
key policy objectives may be negatively impacted upon as the risk to infrastructure from certain
extreme weather events increases as a result of climate change. Recent studies by the University of
Manchester have provided insights into related issues. The FINA project looked specifically at the risk
6
An annual measure of the extent to which daily temperatures suggest that buildings may require some form of
space heating is based on the daily temperature being below a certain threshold (15.5ºC).
UKCIP website, 2011 (http://www.ukcip.org.uk/glossary/)
RESIN City Assessment Report | Greater Manchester 15of flooding to GM’s transport infrastructure (Carter 2015). This identified that the most severe flood
events impacting on GM’s main highways network occur during the autumn and winter months, and
that although these events occur across the conurbation there are certain locations where events
appear to be more frequent. On the rail network a pattern emerges with a spike of flood events in July
and August. Spatially, these events tend to cluster at particular points on the network. A twin-track
approach is needed in response to these events and related risks; firstly identifying and reducing risks
associated with current extremes and secondly responding to the challenges linked to the changing
climate.
A further study made a spatial assessment of extreme weather and climate change risks to key
sectors that are central to GM’s current and future prosperity (Carter and Kazmierczak 2013). This
focused on GM’s strategic employment sites, science and innovation assets, critical infrastructure,
future housing development areas and town centres. This assessment demonstrated that risks to
these sectors varies considerably across GM. Risk differs according to location (and therefore
likelihood of exposure to hazard events) and the significance of the sector or asset to GM’s future
prosperity (and therefore the severity of consequences associated with exposure to a hazard event).
This study emphasises that, given many weather and climate change hazards are spatial in nature,
there is real value in assessing related risks spatially where data and resources permit this approach.
This can support the development of targeted strategies and actions to address prominent local risks.
RESIN City Assessment Report | Greater Manchester 163 State of adaptation and critical
infrastructure protection planning and
activity in GM
Critical to taking action to increase GM’s resilience to a changing climate is developing an
understanding of its current baseline situation. This is both in terms of the city’s understanding of how
the changing climate will affect it and how its plans, strategies, investments and efforts to address the
challenge of a changing climate are progressing. This needs to be seen in the context of projected
climate hazards and how these affect the particular social, economic or physical characteristics of GM.
In building this baseline, we need to understand more about:
Evidence: GM’s baseline evidence on climate related risk, particularly the ability to spatially
define the risk factors.
Policies and plans: The extent of coverage of climate change adaptation and CIP issues within
relevant plans, strategies and other relevant programmes. It is also important to understand
how well integrated these are.
Supporting delivery: The network of stakeholders/actors and organisations for supporting and
communicating of climate risk, adaptation and resilience issues.
Implementation: How much physical delivery of measures is occurring ‘on the ground’ to
increase GM’s climate resilience.
A more detailed standalone report analysing and presenting GM’s climate adaptation and CIP
research, policy and stakeholder landscape has been produced (Carter, Connelly, Ellis 2016).
However, an overarching picture on the current status of these areas is outlined below.
3.1 EVIDENCE: Existing climate change risk and vulnerability data
and assessments
GM, its constituent Municipalities and a wider group of stakeholders operating within and beyond its
boundaries, have contributed greatly to building understanding of the climate-related risk and
vulnerabilities that the city region faces from a changing climate. Studies have focused at
national/regional, GM and down to local scales. They have looked at particular climate hazards and
impacts, receptors as well as including those affecting from vulnerable groups. These are at range of
levels from national to local and cover from research focussed activities through to specific pieces of
work delivered to fulfil statutory and locally driven requirements. This evidence landscape is described
in more detail in the standalone GM research, policy and stakeholder commentary document (Carter,
Connelly, Ellis 2016). Key data and evidence sources related to understanding and assessing extreme
weather and climate risk in GM are summarised below.
National level risk information
The UK Climate Risk Assessment (CCRA) 2012 – Produced by the UK Government this
publication is a first of its kind for the UK, the CCRA sets out the main risk and opportunities for
the UK arising from climate change.
Progress in preparing for climate change 2015 – This is a three part report published by the
RESIN City Assessment Report | Greater Manchester 17Committee on Climate Change (an independent, statutory body established under the Climate
Change Act 2008 ) under sections 36 and 59 of the Climate Change Act. It covers both
progress towards meeting carbon budgets and progress on adaptation to climate change. It
includes the CCC’s first ever statutory assessment of the National Adaptation Programme.
Adapting to Climate Change: Advice for Flood and Coastal Erosion Risk Management
Authorities (Sept.2011) – Published by the Environment Agency, this package of information
includes river basin district specific guidance on increased fluvial flows, rainfall intensity and
other climate related risk for Lead Local Flood Authorities (LLFA’s) based on UKCP09 climate
change projections
ClimateJust (2014) – Developed by the Joseph Rowntree Foundation, this website and mapping
tool highlights the people and places that are likely to be most vulnerable to the impacts of
flooding and heat waves, producing evidence for local authorities to take action to deliver
socially just responses to climate change.
Regional level risk information
A Summary of Climate Change Risks for North West England (2012) – Produced by Climate
Change North West (now a part of Climate UK), informed by the UK CCRA and other local
information, this report further illustrates what climate change may mean for the region’s people,
businesses and other organisations, highlighting where there is a stronger case/need for local
action.
Economic Impacts of increased flood risk associated with climate change in Northwest England
(2009) – Commissioned by the North West Development Agency, this URS report assesses the
economic impacts of climate change on flooding in the North West of England compared to the
current situation, with a key focus on the business sector and a consideration of damage saving
costs flood defence works.
Climate Change Impacts on Key Sectors and Public Services in Northwest England (2009) –
Commissioned by the North West Development Agency, this ARUP’s report is based on climate
projections produced by the UK Met Office (UKCP09), and provides a risk assessment of these
against 18 key public and private sectors and also includes associate sector specific awareness
raising and briefing materials.
NW Flood Risk Management Plan (still to be published) – this jointly produced Environment
Agency and Lead Local Flood Authority plan sets out where and how to manage flood risk in the
North West so as to provide maximum benefit to people and the environment. Within this plan,
the impact of climate change on flood risk management activities is considered.
Climate Change and the Visitor Economy (2005) - Commissioned by Sustainability Northwest
and produced by the University of Manchester, this report looked at how climate change may
impact upon the visitor economy in the north-west England and how the interactions between
climate change, visitor behaviour and environmental capacity needed to be considered by policy
makers to ensure a climate proof visitor economy. The Manchester city centre was covered as a
case study.
Research focussed on GM
Adaptation Strategies for Climate Change in the Urban Environment (ASSCUE) (2003-2006) -
The ASCCUE Project furthered the understanding of the impacts of climate change in GM
RESIN City Assessment Report | Greater Manchester 18through three ‘exposure units’ of human comfort, urban greenspace and the built environment. It
used a risk based approach to go beyond impact assessments and provided enhanced
information to underpin the development of conurbation and neighbourhood scale adaptation
strategies. The risk assessment methodology (Lindley et al., 2006) used a set of urban
morphology units (representing different land use types) as its spatial framework.
Sustainable Cities: Options for Responding to Climate Change Impacts and Outcomes
(SCORCHIO) (2008 – 2011) - SCORCHIO developed tools to help planners, designers,
engineers and users to adapt urban areas to the changing climate, with a particular emphasis
on heat and human comfort. The project used projections from the UK Climate Impacts
Programme (UKCIP) to provide new and better predictions of changes to the climate at a finer
spatial scale (see Smith et al., 2011). SCORCHIO delivered a better understanding of the GM
urban heat island, at a unit of analysis suitable for decision makers.
Green and Blue Space Adaptation for Urban Areas and EcoTowns (GRaBS) (2008 – 2011) -
GRaBS improved stakeholder and community understanding and involvement in planning,
delivering and managing green infrastructure in new and existing urban mixed use
development, based on positive community involvement techniques. This included raising
awareness of existing good practice with regards to green infrastructure as a climate change
adaptation response (Kazmierczak and Carter, 2011).
ECOCITIES (2009 – 2012) - EcoCities provided a blueprint for developing a climate change
strategy for GM, as well as a GIS-based spatial portal that gathered together information on
climate projections, critical infrastructure locations, and social vulnerability (see Carter et al.
2015).
I-TREES - The i-trees project investigated and demonstrated the contribution of green cover to
climate change resilience and adaptation objectives. Trees, green walls and green roofs were
scientifically measured in order to demonstrate they can have on ground surface temperature,
capture of dust and fine sooty particles, and water retention.
GM level/cross authority studies/reports
GM Ecosystems Services Study (2014) – Produced by Red Rose Forest (using Natural England
funding), this study Maps GM’s priority Ecosystem Services (ESS), setting out pinch points and
issues which are critical and need to be addressed in order for those services to be maximised.
Some of the highest priority ESS are climate service related, particularly concerning heat and
flood management.
Evidencing and spatially prioritising CC in GM (2013) – Commissioned by the GMCA, this
University of Manchester study, considers the national level CCRA risk factors at a more local
scale in GM, evidencing, and where possible spatially prioritising, weather and climate change
risk to the delivery of the Greater Manchester Strategy (which drives growth and development in
GM).
Flooding of Transport and Infrastructure Networks and Assets Report (2014) – Commissioned
by the GM Civil Contingencies and Resilience Unit, this University of Manchester study
enhanced the understanding of flooding to transport infrastructure networks and assets in
Greater Manchester to strengthen responses to related risks.
GM Strategic Flood Risk Assessment (level 1 and level 2 district level reports (2010-11) –
produced by the ten GM districts, the GM wide Strategic Flood Risk Assessment (SFRA) and
the joint district detailed level two SFRAs are technical pieces of work which independently
RESIN City Assessment Report | Greater Manchester 19analysed of the risk posed by flooding from all sources in GM and its ten constituent districts
and provided evidence to inform future sustainable development.
Catchment Flood Management Plans (CFMPs) (2009) – These Environment Agency produced
plans cover all four of GM’s river catchments (Irwell, Upper Mersey, Mersey Estuary and
Douglas). They cover all forms of inland flooding, including a consideration of climate change,
and aim to enable the Environment Agency and its partners to plan and agree future flood risk
management activity.
Towards a Green Infrastructure Framework for Greater Manchester (Sept 2008) –
Commissioned by the AGMA, this report looks at how green infrastructure (GI) might be
embedded into the city regions spatial planning process. The goal is to enable and sustain
growth to provide GM with a “route-map” approach to GI planning, including its role in climate
resilience.
Local/Municipality level studies
Local Climate Impact Profiles (LCLIP) – These were produced by the 10 GM districts as part of
the central government’s National Indicator 188, which encouraged climate change adaptation
planning in local government. 9 out of 10 GM local authority districts had completed LCLIP’s by
2009/10. LCLIP’s are a simple process designed to help organisations, in this case local
authorities, to assess their exposure to damaging weather events.
Preliminary Flood Risk Assessments (required under 2009 Flood Risk Regulations) – Produced
at a GM district level they consider flooding from surface water runoff, groundwater and ordinary
watercourses and include consideration of climate change. PFRAs are used to identify areas
that are at risk of significant flooding. These areas are called flood risk areas. Lead local flood
authorities are responsible for and have prepared the PFRAs and identified the flood risk areas.
All 10 GM districts have produced these documents and they can be downloaded here.
Local Flood Risk Management Strategies (LFRMS) as required under the Floods and Water
Management Act 2010 – Produced by GM’s districts as Lead Local Flood Authorities, these
LRFMS must: assess local flood risk; set out objectives for managing local flooding; and list the
costs and benefits of measures proposed to meet these objectives, and how the measures will
be paid for. Building on evidence provided by PFRA’s, these must consider the implications of
climate change on local flood risks and delivery of flood risk management objectives/measures
locally.
3.2 POLICIES AND PLANS: Existing adaptation and critical
infrastructure protection plans and strategies
A number of plans and strategies, covering a range of scales and produced by a variety of
stakeholders (see below), address the issue of climate adaptation and critical infrastructure protection.
These range from higher level policy / strategy documents to more formal climate change adaptation
strategies. Depending on the plan or strategy and the driver behind it (i.e. whether they are statutory
or legislative), these documents contain differing levels of coverage of climate adaptation and
resilience issue(s) and subsequent approaches to managing them. This policy and legislative
landscape is described in more detail in the standalone GM research, policy and stakeholder
commentary document (Carter, Connelly, Ellis 2016). But the following summary provides a snapshot,
of our current understanding of coverage in GM:
RESIN City Assessment Report | Greater Manchester 20National/sector level Plans and Strategies
The National Adaptation Programme (NAP) 2013 – Produced by the UK Government, this is a
register of actions aligned to risks identified in the national Climate Change Risk Assessment.
The NAP is split into themes including Built environment; Infrastructure; Healthy and resilient
communities; Agriculture and forestry; Natural environment; Business and local government. It
looks most closely at the most urgent risk factors and sets out actions for a range of actors,
including local stakeholders or organisations with a role / remit within GM around increasing
local resilience to climate change.
The Heatwave Plan for England 2015 – Produced by Public Health England (an executive
agency of the Department of Health), the Heatwave plan for England aims to prepare for, alert
people to, and prevent, the major avoidable effects on health during periods of severe heat in
England. It recommends a series of steps to reduce the risks to health from prolonged exposure
to severe heat. These steps are targeted at the NHS, local authorities, social care, and other
public agencies; individuals, local communities and voluntary groups. Alongside the key
emergency planning guidance for heatwaves, it also recognises that a co-ordinated, multi-
agency and long-term approach is needed to protect people and infrastructure from the effects
of severe hot weather, for example through ‘greening the built environment’.
GM level plans and strategies (including emerging/currently developing)
The Greater Manchester Strategy – Stronger together (2013) – Produced by the Greater
Manchester Combined Authority (GMCA), this strategy sets out GM’s plans for reforming public
services and its drive for economic growth and prosperity. The vision is of a city region which is
self-reliant and self-sustaining whilst delivering growth, a good quality of life, low carbon
economy and a commitment to sustainable development alongside an outstanding natural
environment. Explicit in this is the need to adapt to a changing climate with clear statements
around the need to address the impacts of a changing climate and extreme weather as well as
commitments to implement recommendations EcoCities work on climate change adaptation and
more generally investing in green and blue infrastructure for the climate resilience services it
provides (p47).
GM Climate Change Strategy (2011) – This GMCA strategy aims to address the challenges and
opportunities presented by climate change. It covers both mitigation and increasing our
resilience to a changing climate. And through its strong objective (p. 6) to ‘be prepared for and
actively adapting to a rapidly changing climate‘, it creates a common framework to provide
direction and co-ordination for plans and programmes already in place at Greater Manchester
and at the district level, linking them to all the priorities in the overarching Greater Manchester
Strategy (see above).
GM Climate Change Implementation Plan (2012-15) - This plan was produced by the GMCA
(and its Low Carbon Hub (and is currently being refreshed autumn 2015). The current
published plan covers the period 2015-20 and outlines the key actions and commitments
needed between 2012 and 2015 to deliver GM’s Climate Change Strategy. These are not just
plans for public bodies, they are plans which every organisation, business and neighbourhood
in Greater Manchester can contribute to, and benefit from. Both the original (pp. 11; 18) and
refreshed implementation plan (p. 26) includes priorities and actions around climate resilience.
The emerging Greater Manchester Spatial Framework (GMSF) – produced by the GMCA. This
will be a joint statutory spatial plan of the Mayor and the 10 GM districts to manage the supply
of land for jobs and new homes across Greater Manchester. The GMSF has a central role in
RESIN City Assessment Report | Greater Manchester 21You can also read