Reported Crime Statistics in Toronto can be Misleading
←
→
Page content transcription
If your browser does not render page correctly, please read the page content below
Reported Crime Statistics in Toronto can be Misleading∗

                                                    Morgaine Westin

                                                     29 January 2021

                                                          Abstract
           Crime datasets are important tools for determining police funding and the allocation of police re-
       sources, however biases in the way crimes are reported may affect the reliability of this information.
       This report utilizes data on reported crimes in Toronto to: (1) assess crime trends in Toronto and the
       rates at which police successfully clear crimes, and (2), discuss ways in which the selective reporting of
       crime statistics can be misleading or misinterpreted. While the number of reported crimes in Toronto
       have been slowly increasing between the years 2014-2019, the number of crimes cleared by the police has
       remained stable, indicating a decrease in police performance as measured by clearance rates. However,
       problems including the under-reporting of certain types of crimes and decisions to count single criminal
       incidents consisting of multiple offenses as separate crime counts underlie the conclusions drawn from
       the data, making it difficult to esitmate the true extent of crime and police performance in Toronto.

1      Introduction
In light of publicized cases of police brutality and evidence of racial prejudice among police forces in North
America there has been a public call for governments to “defund the police”. This movement supports the
reallocation of police department funds towards other services which promote public safety such as social
services and community resources (Weichselbaum and Lewis 2020). While supporters range from seeking
a moderate amount of reductions to a complete abolition of police services, the movement has also been
criticized, with some people suggesting hastily cutting funds to the police can have consequences and might
even lead to increased crime rates (Jackman 2020). However, even before the movement to defund the police
grew in 2020 there have been policy concerns about police overfunding in Canada. According to a report
by The Fraser Institute, the number of police officers employed per 100,000 of the population in Canada
has been increasing while crime rates and officer workload1 have been decreasing (Di Matteo 2014). Despite
this, modern policing has evolved beyond just reactively dealing with crimes, meaning a number of other
complex factors contributing to police expenditures need to be considered when discussing funding.
Crime statistics are an important tool for budget planning and resource allocation for law enforcement fund-
ing. Data from crime reports are often used to calculate clearance rates, which measure the number of crimes
successfully solved by the police (Baughman 2020). Clearance rates are usually used as benchmarks to com-
pare performance among police forces and aid in decision making regarding funding allocations (McCormick
et al. 2013). However, whether clearance rates are an effective measure of police performance or not is
controversial since they can be measured differently and can easily be manipulated by officers (Baughman
2020). Statistics on the different types of crimes committed and the areas where crimes tend to be concen-
trated are also useful for resource planning. For example, proactive policing practices meant to stop crimes
before they occur can be implemented in certain areas with higher crime rates (Sullivan and O’Keeffe 2017),
and can be tailored to focus on preventing certain types of crimes which may be prevalent in an area, such
as drug offenses.
    ∗ Code   and data are available at: https://github.com/westinmo/Toronto-Crime-Statistics
    1 Workload   is measured as the number of criminal code incidents per officer.

                                                               1
Given the importance of crime statistics in characterizing crime rates and making decisions about police
funding, it is important to understand how crime related data is reported and how it may be interpreted.
For this report, I will use open-access data from the Toronto Police Services to analyze how crime patterns
in Toronto have changed over the years and how data in criminal reports are organized and presented. More
importantly, I will discuss issues of bias in how crimes are reported, the ways in which crime information
from the dataset can be misleading or misinterpreted, and the real world implications these issues have. The
dataset will be processed and analyzed in R (R Core Team 2020) primarily using the tidyverse (Wickham
et al. 2019) and dplyr (Wickham et al. 2021) packages. Figures and tables will be created with ggplot2
(Wickham 2016) and kableextra (Zhu 2020). The packages knitr (Xie 2021a), bookdown (Xie 2020), and
tinytex (Xie 2021b) are used to generate the R markdown report.
2 Data
2.1 Data Source
This report utilizes data on reported crimes in Toronto obtained from the Toronto Police Service Annual
Statistical Report (ASR) (Toronto Police Service 2020b). The ASR is an annual overview of police related
datasets covering a range of topics such as crime statistics, budget, traffic reports, and communications.
Since 2019, datasets from the ASR have been openly available to the public and can be accessed through the
Toronto Police Service Public Safety Data Portal or the City of Toronto Open Data Portal. The reported
crimes dataset analyzed in this report was obtained in csv format from the City of Toronto Open Data Portal
using the R package opendatatoronto (Gelfand 2020). The dataset was last updated on November 9th,
2020.
2.2 Methodology and Data Collection
The dataset contains information on all criminal offenses that were reported to the Toronto Police Service
(TPS) from the years 2014 to 2019. Crimes can be reported to the TPS through a variety of avenues.
Common criminal reporting practices include calls to emergency services (911), the Citizen Online Report
Entry (CORE) system which handles reports of non-emergency incidents through telephone or online form
(Toronto Police Service 2021b), and anonymous tips from Crime Stoppers (Toronto Crime Stoppers 2021).
The ASR does not specify where the reports in the dataset are collected from, and only states it includes
all reported criminal offenses, including those considered unfounded after investigation. It is also unclear
whether the data includes only formally filed police reports or if it also contains data from anonymous tips
and reports received via Crime Stoppers. Additionally, it is unknown if the data only includes criminal
offenses reported by citizens, or if it also includes crimes reported by the TPS themselves which may have
been discovered on-duty through proactive policing practices.
While this dataset contains information on all reported crimes in Toronto, it is not an accurate representation
of actual crime rates in the city. There are established biases in the way crimes are selectively reported to
the police, which are likely reflected in this dataset. This is sometimes referred to as the dark figure of crime,
the amount of crimes which go unreported to the police. (Skogan 1977). Self-reported criminal victimization
data from the 2004 GSS indicated about two-thirds of Canadians experienced a criminal incident but did
not report it to the police (Statistics Canada 2009b). The majority of incidents that go unreported are
crimes that are less serious in nature such as petty theft (Skogan 1977), however there are still many cases
in which serious offenses go unreported. Sexual assault is among one of the most under-reported criminal
offenses, with 2014 GSS data reporting approximately 83% of sexual assaults were not reported to the
police (Department of Justice 2017). A number of factors may influence why a victim of sexual assault
may choose not to report to the police such as their relationship with the perpetrator, fear of retaliation,
or fear of not being believed (Kelly and Stermac 2008). A large portion of hate crimes are also believed to
be unreported often due to strained relationships between marginalized groups and the police resulting in
a lack of confidence in law enforcement (Pezzella, Fetzer, and Keller 2019). The under-reporting of various
2crimes leads to biased data which does not fully reflect the full breadth of crime and victimization in the city.
The characteristics of people who choose to report crimes and their reasons for doing so may systematically
differ from those who do not report crimes, leading to possible confounds in the data. This in turn can lead
to inaccurate calculations of crime rates and clearance rates, and can result in the misallocation of police
resources.
If the reported crimes in the dataset include those discovered and reported by the police themselves, issues
pertaining to bias in policing must be considered when examining the data. Racial bias in policing and
the use of proactive policing strategies such as stop and search has been a well-documented concern in
the United States and Canada (Manski and Nagin 2017). Non-white individuals, particularly those who are
black or Hispanic, are significantly more likely to be stopped, questioned, and arrested than white individuals
(Lytle 2014). Black individuals in the city of Toronto receive charges for criminal and drug offences at a
rate three times their baseline population data (Toronto Star 2010). The practice of carding in Toronto,
which allowed police officers to arbitrarily stop and question individuals without any cause for criminal
investigation likely contributed to racial disparities seen in policing (Evers 2018). In 2017, the province of
Ontario implemented a policy to regulate carding after an independent review determined the practice was
not effective at managing crime and disproportionately impacted racialized groups in a negative manner
(Tulloch 2020). However the practice was not banned entirely, meaning potential effects of carding and
charges laid on racialized individuals as a result of stop and search practices and racial discrimination in the
police force may underlie the data analyzed in this report.
2.3 Data Characteristics
The Reported Crimes dataset contains aggregated data of all criminal offenses reported to the TPS between
the years 2014 and 2020 (Toronto Police Service 2020a). There were 2031 observations in the dataset and
8 attributes: index, object ID, reported year, category, subtype, count (number of crimes reported), and
count cleared (the number of criminal reports that were cleared). The first two attributes, index and object
ID, were identical numerical identifiers which were removed prior to analysis. An additional attribute to
estimate clearance rates was created during analysis by dividing the number of criminal reports counted as
cleared by the total number of crimes, multiplied by 100. The crime counts were aggregated by geographical
division, category, subtype and year. Finally, the criminal reports contained in the dataset include those
that the TPS deemed unfounded after further investigation, crimes which may have taken place outside the
city of Toronto, and crimes with no verified location. A sample view of the dataset is displayed below.
## # A tibble: 6 x 7
## ReportedYear GeoDivision Category Subtype Count_ CountCleared ClearRate
##
## 1 2014 D11 Controlled D~ Other 200 195 97.5
## 2 2014 D11 Crimes Again~ Auto The~ 119 42 35.3
## 3 2014 D11 Crimes Again~ Break & ~ 85 37 43.5
## 4 2014 D11 Crimes Again~ Break & ~ 58 18 31.0
## 5 2014 D11 Crimes Again~ Break & ~ 89 34 38.2
## 6 2014 D11 Crimes Again~ Break & ~ 23 7 30.4
2.3.1 Crime Counts and Clearance Rates
According to information provided by the TPS in the ASR glossary, a criminal offense is considered to
be cleared when a charge has been laid, recommended, or the perpetrator(s) have been identified but no
charges have been laid. However, it is unclear whether cleared cases in this dataset also include cases deemed
unfounded by the police. Figure 12 displays the total number of crimes reported and total number of crimes
that were cleared by year.
2 Data
were formatted for graphing using the melt package; Colour palette in Figure 1 is from the wesanderson package
(Ram and Wickham 2018)
3Reported Crimes are Gradually Increasing
200000
Number of Reports
150000
143280 144570
122572 129931 Reported Crimes
113277 117290
100000 Total Reported
Cleared
50000
59803 59465 59889 60780 59975 60064
0
2014 2015 2016 2017 2018 2019
Year
Figure 1: Total Number of Reported Crimes by Year
Note that the year refers to the year the crime was reported to the police, and does not necessarily indicate
the year the crime took place. Based on the figure, we can see a slight gradual increase in the number of
crimes reported to the TPS between the years 2014 and 2018, with the number of reports in 2019 being
similar to those from 2018. This does not necessarily mean that crime has been increasing in Toronto,
since a number of factors can contribute to observed increases in crime reports, such as population growth.
Similarly, the “true” number of crimes is unknown due to under-reporting.
Meanwhile, the number of crimes cleared by the police appears to have remained steady over the years despite
increases in reported crimes. Clearance rates have gradually decreased between 2014 and 2017 before sharply
decreasing between 2017 and 2018. The annual rates are listed as follows: 2014 (52.8%), 2015 (50.7%), 2016
(48.9%), 2017 (46.8%), 2018 (41.9%), and 2019 (41.5%). However this is just a rough estimate of the
clearance rate calculated based on the data provided in the dataset and should be interpreted with caution.
Many police forces use weighted clearance rates based on the severity of the crime to estimate performance
whereas clearance of more serious crimes such as homicide or assault are given greater weighting than less
serious crimes (McCormick et al. 2013). Further examination into clearance rates for different types of
crimes may provide better insights into why clearance rates appear to be decreasing. Notably, this dataset
does not include reported homicides, as there is a separate dataset in the ASR for homicide reports.
2.3.2 Category
The category variable contains information on the type of criminal offense reported to the police. The
dataset lists six main offense categories: crimes against property, crimes against the person, controlled drugs
and substances, criminal code traffic, other criminal code violations, and other federal violations. Incidents
categorized as multiple offense types were included multiple times in the dataset in each relevant category.
Figure 23 displays the distributions of reported crimes between 2014-2019 by category.
Across all six years, property crimes are consistently the most frequently reported crimes out of all the offense
types. Property crimes have also shown the largest increase in reports, particularly between the years 2015
and 2018. This could suggest that the increase in total crimes reported across the years observed might be
partially explained by the growing number of property crimes that have been reporting. After crimes against
property, crimes against the person and other criminal code violations were the most frequently reported
3 Colour palettes in Figures 2 and 3 are from the palettetown package (Lucas 2016)
4crimes, both showing a small but gradual increase over the years. The remaining three categories, controlled
drugs and substances, criminal code traffic, and other federal statute violations were the least frequently
reported crimes.
Property Crimes Are the Most Frequently Reported Category Offense
Number of Crimes Reported
Category
75000
Controlled Drugs and Substances Act
Crimes Against Property
50000 Crimes Against the Person
Criminal Code Traffic
25000 Other Criminal Code Violations
Other Federal Statute Violations
0
2014 2015 2016 2017 2018 2019
Year
Figure 2: Number of Crimes Reported in Toronto by Category and Year
Clearance rates by criminal offense category are displayed in Figure 3. Offense categories that were reported
less frequently such as controlled drugs and substances, criminal code traffic, other criminal code violations,
and other federal statute violations had the highest clearance rates (all above 80%). Clearance rates for
Crimes against the Person are in the moderate range (around 60%). Depending on the severity, many of
the cleared crimes in this category such as assault and attempted murder would be given higher weighting
if a weighted method was used to calculate clearance rates. Property crimes had the lowest clearance rates
which declined from 36.4% in 2014 to 25.4% in 2019. Given the disproportionately high number of property
crimes reported in this dataset compared to other categories, the decreasing clearance rates in this category
likely contribute to the overall trend of low and decreasing clearance rates among all the crimes discussed
earlier.
Clearance Rates Vary Among Offense Categories
100
Category
Clearance Rates (%)
80 Controlled Drugs and Substances Act
Crimes Against Property
Crimes Against the Person
60
Criminal Code Traffic
Other Criminal Code Violations
40 Other Federal Statute Violations
2014 2015 2016 2017 2018 2019
Year
Figure 3: Clearance Rates by Category and Year
52.3.3 Subtype
Reported crimes are further broken up into subtypes based on the six main category offenses. Table 14 lists
the number of crimes reported by year for each subtype. Again, crimes which involve multiple subtypes are
included multiple times in the dataset under each relevant subtype. This can lead to an inflated estimation
of the number of actual incidents which occur based on this data and impacts the reliability of the clearance
rates that were calculated. An estimated one half of sentenced offenders are sentenced for multiple crimes,
although it is unclear if this applies to the categorization of multiple offenses when crimes are reported prior
to sentencing (Roberts 2016). Statistics Canada recommends only reporting or counting the most serious
offense in incidents involving multiple offenses when calculating crime rates to avoid issues of over-counting
(Statistics Canada 2009a).
Table 1: Offense Subtypes of Crimes Reported to TPS
Subtype 2014 2015 2016 2017 2018 2019
Controlled Drugs and Substances Act
Other 4648 4678 4251 3678 2953 1706
Crimes Against Property
Auto Theft 3608 3517 3475 3714 4932 5443
Break & Enter-Apartment 1884 2002 1622 1835 2003 2454
Break & Enter-Commercial 1933 1950 1914 2140 2592 3343
Break & Enter-House 2950 2653 2508 2591 2523 2202
Break & Enter-Other 462 354 409 377 518 569
Fraud 6729 8007 9625 10164 11729 13377
Other 11884 12739 13645 14230 14622 14026
Theft Over $5000 1025 1061 1073 1206 1268 1405
Theft Under $5000 38214 37282 39522 43822 52803 52140
Crimes Against the Person
Assault 15140 15892 16563 17125 17833 18885
Attempt Murder 86 119 132 126 186 147
Other 4626 5487 4941 4862 4798 4031
Robbery-Financial 93 86 110 125 123 104
Robbery-Other 3275 3113 3341 3561 3192 3154
Sexual Violation 2092 2170 2205 2342 2764 2737
Criminal Code Traffic
Other 1936 1911 1975 1876 1683 1796
Other Criminal Code Violations
Other 11083 12271 13176 14135 14614 14972
Other Criminal Violations - Offensive Weapons 1199 1612 1734 1763 1896 1850
Other Federal Statute Violations
Other 410 386 351 259 248 229
Crimes against property is the category with the most offense subtypes, with theft under $5000 being the
most frequently reported criminal subtype across all the categories followed by assault. While the number
of sexual violation reports are on the lower end, the numbers in the dataset likely only represent a small
fraction of this type of crime due to historic under-reporting of sexual assault (Kelly and Stermac 2008).
It is also unclear if sexual violation includes all sex related crimes, since sexual assault is often categorized
under assault charges, or if cases of sexual assault are counted twice under assault and sexual violations.
Frequencies for other criminal subtypes are likely lower estimates of the actual number of cases due to under-
reporting, especially for smaller crimes. (Skogan 1977). Comparing reports from this dataset to anonymized
4 Table made with kableextra package (Zhu 2020)
6victimization data might give a better indication of the frequency of various types of criminal offenses which
occur in the city.
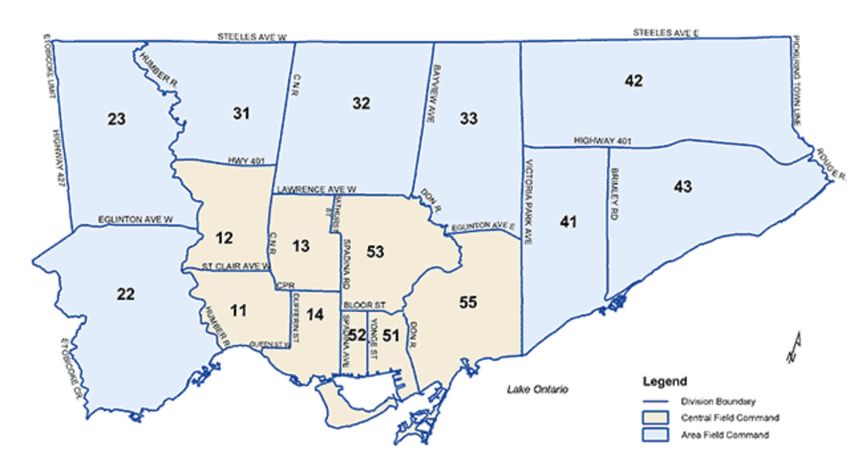
2.3.4 Geographical Division
The ‘GeoDivision’ variable in the dataset refers to the geographical division in which the reported crime
took place. The divisions correspond to the TPS divisions, pictured geographically in Figure 45 . Figure 5
displays the total number of crimes reported to the TPS by division6 and year.
Figure 4: Toronto Police Command and Divisional Boundaries
Reported Crimes are Higher in the Downtown Core
NSA
D54/D55
D53
D52 ReportedYear
Geographical Division
D51
D43 2014
D42
2015
D41
D33 2016
D32
2017
D31
D23 2018
D22
2019
D14
D13
D12
D11
0 20000 40000 60000
Number of Crimes Reported
Figure 5: Total Number of Crimes Reported in Toronto by Division and Year
5 Source: Toronto Police Service (Toronto Police Service 2021a)
6 Division 54 and 55 were officially consolidated into one division in 2018
7Reported crime rates appear to vary by area, with divisions 52, 51, and 55 displaying the most crimes
reported in the dataset. Noticeably, these divisions are adjacent to one another and roughly represent the
downtown core of the city of Toronto, also called the Central Field of Command. This is consistent with past
research which suggests crime is usually concentrated in certain geographical hotspots (Farrell 2015). The
top two divisions with the highest number of criminal reports (divisions 51 and 52) are significantly smaller
in terms of geographical space compared to the other divisions, however these areas are likely the most
densely populated since they are situated in the downtown core. Higher crime rates in downtown Toronto
are generally associated with the number of bars and nightclubs in the area, and the increased homeless
population (Council 2020). However, we should be careful when simply attributing neighbourhood crime
rates to particular locations and populations when there are a variety of complex underlying factors which
may impact why certain areas have higher crime rates than others. For example, a report on spatial analysis
of crime in Toronto identified a strong relationship between violent crime rates and access to socioeconomic
resources (Charron 2009). Crime statistics such as neighbourhood crime rates can be useful indicators of
crime patterns in the city, but they don’t adequately capture the complexities of why these crimes occur.
Carelessly labeling neighbourhoods as more dangerous without addressing the underlying factors which
may be contributing to the crime rates can have harmful implications for these communities, including
stigmatization by the public and increased police presence and profiling.
8References
Baughman, Shima Baradaran. 2020. “How Effective Are Police? The Problem of Clearance Rates and
Criminal Accountability.” Alabama Law Review, Forthcoming.
Charron, Mathieu. 2009. Neighbourhood Characteristics and the Distribution of Police-Reported Crime in
the City of Toronto. https://www.osac.gov/Country/Canada/Content/Detail/Report/6cffbda7-d425-46a0-
a7c9-18f832146206.
Council, Overseas Security Advisory. 2020. Canada 2020 Crime & Safety Report: Toronto. https://www.
osac.gov/Country/Canada/Content/Detail/Report/6cffbda7-d425-46a0-a7c9-18f832146206.
Department of Justice. 2017. JustFacts - Sexual Assault. https://www.justice.gc.ca/eng/rp-pr/jr/jf-pf/
2017/may02.html.
Di Matteo, Livio. 2014. Police and Crime Rates in Canada: A Comparison of Resources and Outcomes.
Fraser Institute.
Evers, Michael. 2018. “An Economic Analysis of Black-White Disparities in Toronto Police Service’s Carding
Practice.” PhD thesis, HEC Montréal.
Farrell, Graham. 2015. “Crime Concentration Theory.” Crime Prevention and Community Safety 17 (4):
233–48.
Gelfand, Sharla. 2020. Opendatatoronto: Access the City of Toronto Open Data Portal. https://CRAN.R-
project.org/package=opendatatoronto.
Jackman, Tom. 2020. Defunding or Disbanding the Police Is a Dangerous Idea If Done Hastily.
https://www.washingtonpost.com/crime-law/2020/06/18/guest-post-defunding-or-disbanding-police-is-
dangerous-idea-if-done-hastily/.
Kelly, Theresa C, and Lana Stermac. 2008. “Underreporting in Sexual Assault: A Review of Explanatory
Factors.” Baltic Journal of Psychology 9 (1/2): 30–45.
Lucas, Tim. 2016. Palettetown: Use Pokemon Inspired Colour Palettes. https://CRAN.R-project.org/
package=palettetown.
Lytle, Daniel J. 2014. “The Effects of Suspect Characteristics on Arrest: A Meta-Analysis.” Journal of
Criminal Justice 42 (6): 589–97.
Manski, Charles F, and Daniel S Nagin. 2017. “Assessing Benefits, Costs, and Disparate Racial Impacts of
Confrontational Proactive Policing.” Proceedings of the National Academy of Sciences 114 (35): 9308–13.
McCormick, Amanda V, Tara Haarhoff, Irwin M Cohen, Darryl Plecas, and Kevin Burk. 2013. Challenges
Associated with Interpreting and Using Police Clearance Rates. Centre for Public Safety; Criminal Justice
Research, University of the . . . .
Pezzella, Frank S, Matthew D Fetzer, and Tyler Keller. 2019. “The Dark Figure of Hate Crime Underre-
porting.” American Behavioral Scientist, 0002764218823844.
Ram, Karthik, and Hadley Wickham. 2018. Wesanderson: A Wes Anderson Palette Generator. https:
//CRAN.R-project.org/package=wesanderson.
R Core Team. 2020. R: A Language and Environment for Statistical Computing. Vienna, Austria: R
Foundation for Statistical Computing. https://www.R-project.org/.
Roberts, Julian. 2016. More Than One Crime? Sentencing for Multiple Offences. University of Oxford
- Faculty of Law. https://www.law.ox.ac.uk/centres-institutes/centre-criminology/blog/2016/01/more-one-
crime-sentencing-multiple-offences.
Skogan, Wesley G. 1977. “Dimensions of the Dark Figure of Unreported Crime.” Crime & Delinquency 23
(1): 41–50.
9Statistics Canada. 2009a. Improvements to Police-Reported Crime Data. https://www150.statcan.gc.ca/
n1/pub/85-004-x/2009001/part-partie3-eng.htm.
———. 2009b. Measuring Crime in Canada: Introducing the Crime Severity Index and Improvements to the
Uniform Crime Reporting Survey. https://www150.statcan.gc.ca/n1/pub/85-004-x/2009001/part-partie2-
eng.htm.
Sullivan, Christopher M, and Zachary P O’Keeffe. 2017. “Evidence That Curtailing Proactive Policing Can
Reduce Major Crime.” Nature Human Behaviour 1 (10): 730–37.
Toronto Crime Stoppers. 2021. Toronto Crime Stoppers. https://www.222tips.com/.
Toronto Police Service. 2020a. Police Annual Statistical Report - Reported Crimes. https://data.
torontopolice.on.ca/datasets/94229ca8628f43f591a74ec3a2a6d4b5_0.
———. 2020b. Toronto Police Service Public Safety Data Portal. https://data.torontopolice.on.ca/pages/
annualstatisticalreport.
———. 2021a. Command and Divisional Boundaries. http://www.torontopolice.on.ca/divisions/map.php.
———. 2021b. Primary Report Intake, Management and Entry Unit (Prime) Citizen Online Report Entry
(Core). https://www.torontopolice.on.ca/core/.
Toronto Star. 2010. Toronto Star Analysis of Toronto Police Service Data - 2010. https://www.thestar.
com/content/dam/thestar/static_images/advancedfindings2010.pdf.
Tulloch, Michael H. 2020. Report of the Independent Police Oversight Review. https://www.attorneygeneral.
jus.gov.on.ca/english/about/pubs/police_oversight_review/#_idParaDest-11.
Weichselbaum, Simone, and Nicole Lewis. 2020. “Support for Defunding the Police Department Is Growing.
Here’s Why It’s Not a Silver Bullet.” The Marshall Project.
Wickham, Hadley. 2016. Ggplot2: Elegant Graphics for Data Analysis. Springer-Verlag New York. https:
//ggplot2.tidyverse.org.
Wickham, Hadley, Mara Averick, Jennifer Bryan, Winston Chang, Lucy D’Agostino McGowan, Romain
François, Garrett Grolemund, et al. 2019. “Welcome to the tidyverse.” Journal of Open Source Software 4
(43): 1686. https://doi.org/10.21105/joss.01686.
Wickham, Hadley, Romain François, Lionel Henry, and Kirill Müller. 2021. Dplyr: A Grammar of Data
Manipulation. https://CRAN.R-project.org/package=dplyr.
Xie, Yihui. 2020. Bookdown: Authoring Books and Technical Documents with R Markdown. https://github.
com/rstudio/bookdown.
———. 2021a. Knitr: A General-Purpose Package for Dynamic Report Generation in R. https://yihui.org/
knitr/.
———. 2021b. Tinytex: Helper Functions to Install and Maintain Tex Live, and Compile Latex Documents.
https://github.com/yihui/tinytex.
Zhu, Hao. 2020. KableExtra: Construct Complex Table with ’Kable’ and Pipe Syntax. https://CRAN.R-
project.org/package=kableExtra.
10You can also read