Report to the General Assembly of Virginia - VRS Stress Test and Virginia Retirement System - Virginia ...
←
→
Page content transcription
If your browser does not render page correctly, please read the page content below
VRS Stress Test and
Sensitivity Analysis
Report to the General Assembly of Virginia

                                             Virginia Retirement System
TABLE OF CONTENTS

Contents
  Stress Test and Sensitivity Analysis Mandate _________________________________________________________ 1
  Executive Summary______________________________________________________________________________________ 2
  Future Risk Analysis _____________________________________________________________________________________ 4
  Findings and Conclusions ______________________________________________________________________________ 40
  Appendix ________________________________________________________________________________________________ 41
STRESS TEST AND SESITIVITY ANALYSIS MANDATE

   Section 51.1-124.30:1 of the Code of Virginia requires the Virginia Retirement System to
   formally adopt a policy to regularly report sensitivity and stress testing analyses for
   members of the General Assembly (Appendix A). The analyses shall include projections
   of benefit levels, pension costs, liabilities, and debt reduction under various economic
   and investment scenarios.

   Stress testing, also known as scenario testing, is an analysis or simulation designed to
   measure the effect on the plans of various projected, generally adverse, investment and
   actuarial events.

   Sensitivity testing examines the effect on the plan of different actuarial assumptions and
   methods.

   This report provides an analysis of the potential impact of various scenarios and
   hypothetical situations on VRS-administered retirement plans and supports
   transparency with regard to the future health of the retirement system.

   It should be noted that when VRS examines future potential outcomes for the plans,
   probabilities exist for both positive and negative scenarios. This report focuses primarily
   on the negative scenarios as they help to identify areas of risk and generally provide the
   most challenges to plan sponsors.

Page 1
EXECUTIVE SUMMARY

   The purpose of this report is to assist the VRS Board of Trustees, the Virginia General
   Assembly, the Governor, stakeholders, and the public to better understand and assess the
   risks inherent in the funding of the pension system. This year’s report investigates
   various possible risks faced by VRS and measures their potential impact on the defined
   benefit programs.

   Although market returns for fiscal year 2021 exceeded expectations, several risks remain
   along with opportunities to further strengthen the health of the plans, particularly the
   statewide retirement plans.

   Key results and findings of this report:

         •   While economic markets rebounded to provide strong returns for fiscal year
             2021, COVID-19 continues to create uncertainty in global markets and
             unpredictable impacts on future market returns.
         •   New valuation assumptions will be reflected in the June 30, 2021, rate-setting
             valuation including generational mortality assumptions that will help counter
             longevity risk by increasing contribution requirements to cover expected long-
             term costs. Although COVID-19 may affect longevity expectations, it is too early to
             have any relevant data related to those potential impacts.
         •   Significant resources must remain dedicated to addressing the amortization of the
             legacy unfunded liabilities.
         •   Analysis suggests that accelerating the payback of the legacy unfunded liabilities
             could provide significant long-term savings and better position the statewide
             plans to weather future volatility in investment returns, thereby serving to reduce
             investment risk. However, available resources to take such action are limited at
             this time due to the current economic climate, limitations on the use of certain
             resources and uncertainty regarding future revenue.
         •   As roughly two-thirds of benefits are funded by investment income, receiving
             100% of the Board-certified actuarially determined contributions not only avoids
             adding liabilities to the plans, but also ensures timely availability of assets to be
             invested and take advantage of compound interest. Of note, the Governor and
             General Assembly met and even accelerated the statutory requirement to fund
             100% of the Board-certified contribution rates.

Page 2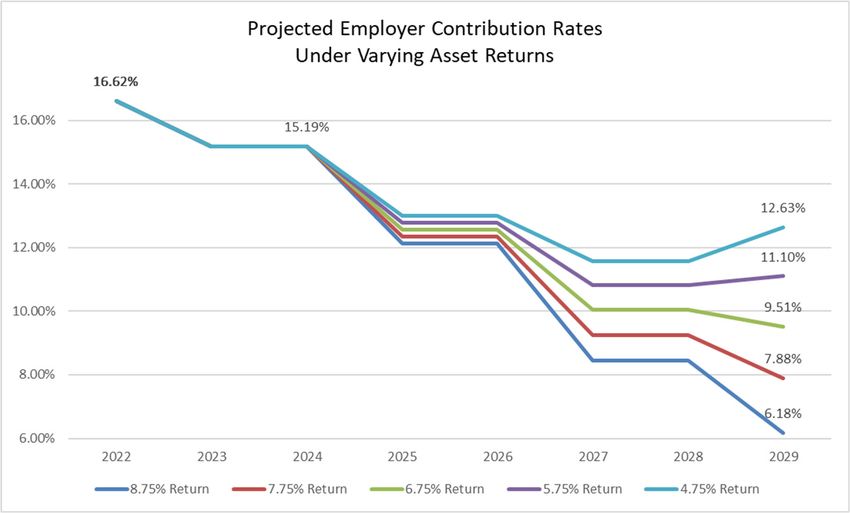
EXECUTIVE SUMMARY

         •   Pension reforms, specifically plan design changes over the past decade, have
             reduced the future costs of benefits. In addition, these reforms have reduced
             employers’ risk by introducing shared risk through the defined contribution
             component of the Hybrid Retirement Plan. Approximately 30% of a hybrid plan
             member’s benefit has no future investment or longevity risk for employers.

   This report is intended to assist policymakers and stakeholders in assessing the
   soundness of the System. To better understand the risks associated with funding the
   System, this report examines a range of potential outcomes, both economic and
   demographic, that could endanger the long-term funding of the System and prevent the
   System from reaching full funding. Again, this report focuses primarily on analyzing
   negative outcomes, since such outcomes would result in the greatest challenges for the
   plan sponsors and System.

   This report is based on the June 30, 2020, Annual Actuarial Valuation and reflects the
   changes to actuarial assumptions adopted by the VRS Board of Trustees in April 2021. In
   this report, the focus is on:

         •   The continued impacts of COVID-19 and resulting forward looking expectations
             after robust investment returns for fiscal year 2021.
         •   Risks to long-term funding, including investment volatility, contribution risk, and
             longevity risk.

Page 3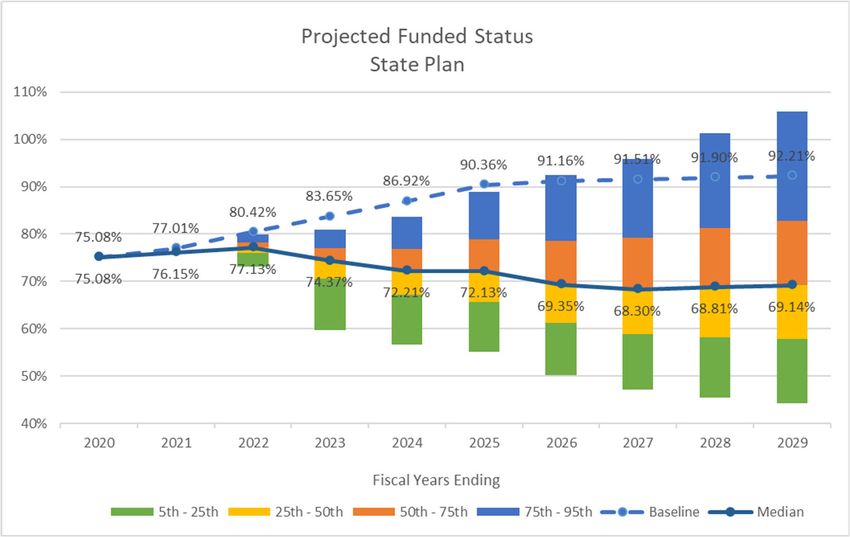
FUTURE RISK ANALYSIS

   Investment Rate of Return Assumption

   Pension plans are generally prefunded, meaning money is invested during a member’s
   career so that by the time the member retires adequate funds will exist to pay benefits
   throughout the member’s retirement. Investment earnings on plan contributions
   currently account for nearly two-thirds of pension funding. The discount rate – the rate
   used to determine the present value of a future benefit payments – influences the level of
   contributions required, assuming they will generate investment income throughout a
   member’s career and into retirement. VRS uses the long-term rate of return as the plan
   discount rate and these terms are used interchangeably in this report.

   The discount rate assumption is one of the most influential and sensitive assumptions
   used in determining the liability of plan benefits. Market conditions, including the
   continued low interest rate environment, have resulted in public pension funds
   reviewing their expected long-term rates of return with many plans lowering future
   expectations. One challenging facet of setting the investment return assumption that has
   emerged more recently is a divergence between expected returns over the near term, i.e.,
   the next five to 10 years, and over the longer term, i.e., 20 to 30 years. Following robust
   market returns in fiscal year 2021, future outperformance in the near term may be
   materially lower than both historic norms as well as projected returns over longer
   timeframes. Exhibit 1 shows public pension plan market return expectations have
   generally declined over time for various asset classes.

Page 4
FUTURE RISK ANALYSIS

                                           Exhibit 1

   The discount rate reflects expectations of what investment earnings the markets will
   deliver in the future, and it is calculated based on two components: expected price
   inflation and real rate of return. A change in either of those components over the long
   term would necessitate further evaluation of the discount rate.

   Fund long-term health requires careful management and decision making for the asset
   allocation needed to fund members’ pensions and Other Post-Employment Benefits
   (OPEBs), such as group life insurance and the health insurance credit, over the long term.
   The VRS Board of Trustees conducted an Asset Liability Study during 2019 to ensure
   responsible investment practices and strategies are being used in recommending and
   deploying investment allocations. As shown in Exhibit 2, using the plan’s 2.5% assumed
   rate of inflation and the 10-year forward looking capital market estimates and policy
   investment targets provided by the VRS investment staff, a statistical analysis of the

Page 5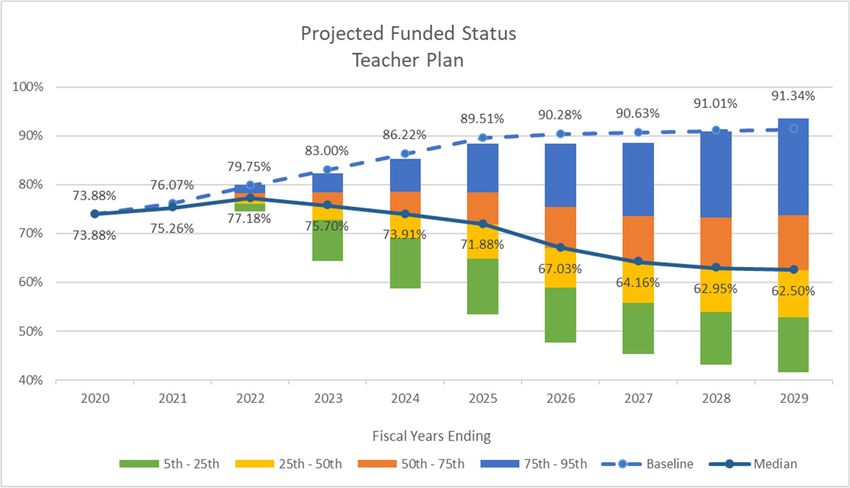
FUTURE RISK ANALYSIS

   reasonable range for the plan’s assumed investment rate of return provided an expected
   median nominal rate of return of 7.11%, with a reasonable range of 6.13% to 8.10%,
   representing the 25th and 75th percentiles, respectively. The nominal rate of return is the
   total rate of return earned on an investment before adjusting for any deductions and
   premiums, such as investment fees, trading costs, tax expenses, and inflation.

                                            Exhibit 2

   Long-term practice has been to set the investment rate of return expectation at the
   median assumed rate, but there are reasons to alter past practice. Due to the divergence
   between expected returns over the near term, i.e., the next five to 10 years, and over the
   longer term, i.e., 20 to 30 years, reflecting a blended discount rate to incorporate near-
   term uncertainty in the markets would require selecting a discount rate below the
   median expected long-term rate. As displayed in Exhibit 3, while the median return of
   7.11% is expected to be achieved 50% of the time, selecting a discount rate of 6.75%
   would move the assumption closer to the 40th percentile, providing approximately a
   60% chance of achieving the long-term rate of return over time.

Page 6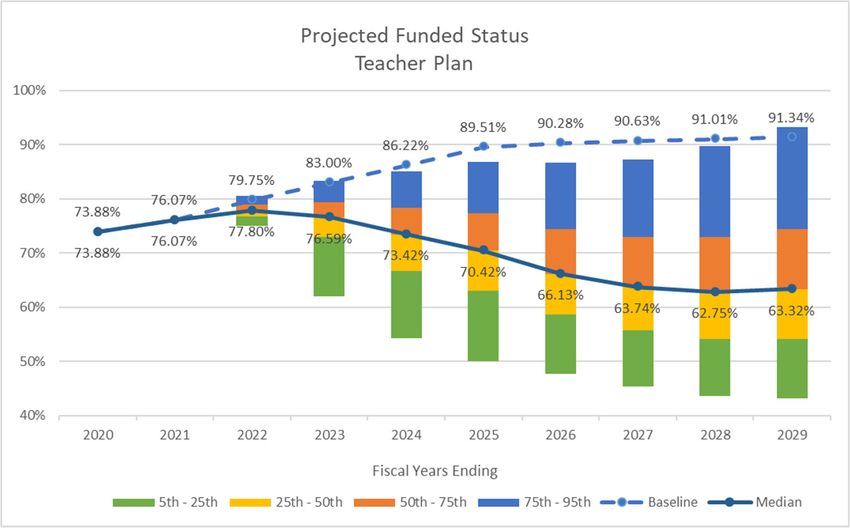
FUTURE RISK ANALYSIS

                                              Exhibit 3

   In effect, the downside tail risk (i.e., the chance of a loss occurring due to a rare event, as
   predicted by a probability distribution) is mitigated by selecting a rate at the 40th
   percentile rather than the median.

   Analysis of Discount Rate Sensitivity

   Analysis of discount rate sensitivity on employer contribution rates gives a sense of the
   long-term risk to the employer contribution rates and changes to the funded status. The
   analysis provides the impact on employer contribution rates assuming discount rates
   that are up to two percentage points above or below the current valuation discount rate.
   This analysis gives an indication of the potential required employer contribution rates if
   the discount rate ranged from 4.75% to 8.75% over the long term. Governmental
   Accounting Standards Board (GASB) Statement 67 currently requires sensitivity analysis
   of plus or minus 1% from the plan’s discount rate. Adding a wider range of plus or minus

Page 7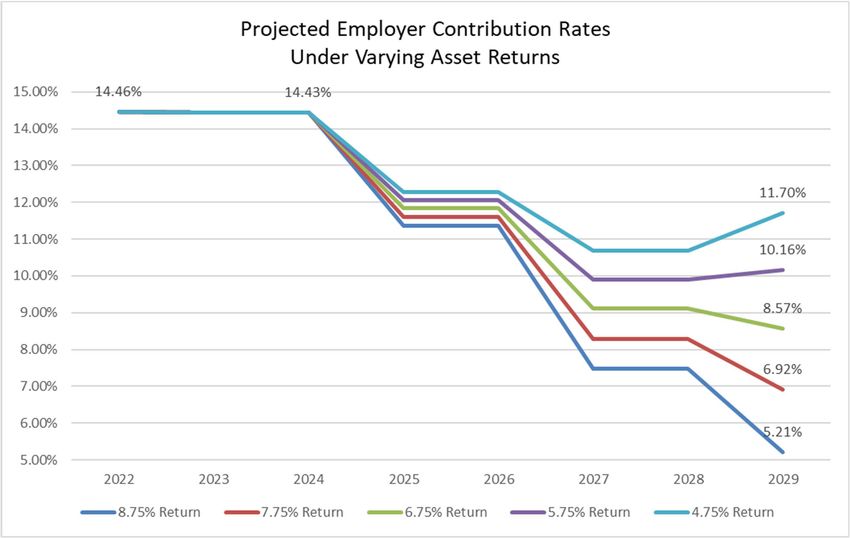
FUTURE RISK ANALYSIS

   2% around the plan discount rate resulted from discussions during deliberations of the
   Commission on Employee Retirement Security and Pension Reform.

   Exhibits 4 and 5 illustrate how various assumed annual rates of return would affect
   pension contribution rates for the State and Teacher plans had they been applied to the
   June 30, 2020, valuation results adjusted for assumptions changes adopted in April 2021.
   A lower assumed annual rate of return requires higher contribution rates from
   employers. A higher assumed annual rate of return requires lower employer
   contribution rates. Although the assumed rate of return dictates how contribution rates
   are calculated in the short term, the actual investment returns will determine what
   portion of pension costs must be covered by contributions in the long term.

                                               Exhibit 4 – State Plan

                                                                                                        ($Thousands)
                                                                            Current
   Discount Rate                              8.75%           7.75%          6.75%          5.75%           4.75%

   Total Normal Cost Rate                     6.58%          7.84%           9.55%          11.92%         15.23%
   Member Contribution Rate                   4.57%          4.57%           4.57%          4.57%           4.57%
   Employer Normal Cost Rate                  2.01%          3.27%           4.98%          7.35%          10.66%
   Administrative Expense Load                0.29%          0.29%           0.29%          0.29%           0.29%
   Total Employer Normal Cost Rate            2.30%          3.56%           5.27%          7.64%          10.95%

   Total Amortization Rate                    2.15%          5.63%           9.19%          12.85%         16.60%

   Defined Contribution Hybrid Plan           0.99%          0.99%           0.99%          0.99%           0.99%

   Total Employer Rate                        5.44%          10.18%         15.45%          21.48%         28.54%

   Change in Employer Rate                   (10.01)%        (5.27)%         0.00%          6.03%          13.09%
   Estimated Change in Annual Funding        (443,292)      (233,382)                      267,038        579,690

   Unfunded Liability                       1,951,855      4,163,206       6,791,187      9,927,861      13,682,196
   Funded Status                              90.8%          82.3%           74.0%          66.1%           58.6%

   Results based on June 30, 2020, actuarial valuation adjusted to include assumption changes adopted by the VRS Board
   of Trustees in April 2021 and represents employer contribution rates developed for informational purposes only.

Page 8
FUTURE RISK ANALYSIS
Exhibit 5 – Teacher Plan
($Thousands)
Current
Discount Rate 8.75% 7.75% 6.75% 5.75% 4.75%
Total Normal Cost Rate 6.68% 8.29% 10.45% 13.41% 17.47%
Member Contribution Rate 4.65% 4.65% 4.65% 4.65% 4.65%
Employer Normal Cost Rate 2.03% 3.64% 5.80% 8.76% 12.82%
Administrative Expense Load 0.27% 0.27% 0.27% 0.27% 0.27%
Total Employer Normal Cost Rate 2.30% 3.91% 6.07% 9.03% 13.09%
Total Amortization Rate 2.39% 6.20% 10.17% 14.35% 18.76%
Defined Contribution Hybrid Plan 0.74% 0.74% 0.74% 0.74% 0.74%
Total Employer Rate 5.43% 10.85% 16.98% 24.12% 32.59%
Change in Employer Rate (11.55)% (6.13)% 0.00% 7.14 % 15.61 %
Estimated Change in Annual Funding (981,579) (520,959) 606,794 1,326,619
Unfunded Liability 3,486,398 8,299,118 14,105,107 21,168,362 29,834,282
Funded Status 91.5% 81.9% 72.7% 64.0% 55.7%
Results based on June 30, 2020, actuarial valuation adjusted to include assumption changes adopted by the VRS Board
of Trustees in April 2021 and represents employer contribution rates developed for informational purposes only.
INVESTMENT RISK
Possible Future Outcomes
Investment returns will have a greater impact on the funding of the plans as the VRS
plans continue to mature. When investment returns are below expectations, the
unfunded actuarial accrued liability increases and additional contributions are needed,
which historically have been funded by employers. Greater maturity creates greater
sensitivity to gains and losses and bigger challenges related to underfunding. “Pension
plan maturity” does not have a precise definition. The most commonly cited measures
use various plan population metrics. However, measures that compare a plan’s size to its
financial resources are more directly related to risk and outcomes. Some typical
measures of pension plan maturity are:
Page 9FUTURE RISK ANALYSIS
Retirees to active members
Plan liability to revenue
Assets to payroll
Retiree liability to total plan liability
Liabilities to contributions
Using the plan assets to covered payroll metric, with covered payroll being the
cumulative creditable compensation used in developing members’ benefits, and assets
being the current market value of assets, the State plan had a ratio of 3.3 as of June 30,
1999, meaning a 10% investment loss would be equivalent to approximately 33% of
covered payroll at that time. While the loss would be amortized or collected through
employer contributions over a 20-year period, it would still represent a significant
increase in employer contribution rates. Following the 27.5% investment return in 2021,
that ratio is expected to be approximately 4.5, meaning a 10% investment loss would be
equivalent to approximately 45% of covered payroll. This metric helps to show that as
the plans continue to mature and assets continue to become a greater percentage of the
covered payroll, downside risk associated with negative returns poses a greater risk to
contribution volatility.
Within this report we will be projecting future outcomes under two sets of analyses,
deterministic or stochastic.
Deterministic analysis assumes full certainty about future outcomes, particularly with
future plan experience and assumptions including investment returns. The deterministic
approach is useful for gauging the general direction of change and associated
consequences and is useful when trying to assess best case or worst-case scenarios or
isolating the impacts of a single assumption such as lowering the plan discount rate.
Stochastic analysis reflects the realistic view that pension plan investment returns, like
the market itself, may be volatile and uncertain. Rather than using exact assumptions, the
model uses probability distributions to provide a range of possible results based on these
probabilities. The projections are intended to present general contribution rate trends
under varying economic scenarios and help to quantify the likelihood and magnitude of
possible future outcomes.
Exhibit 6 below is a deterministic projection that provides a range of expected employer
contribution rates under varying rates of return from 4.75% - 8.75% over the next eight
Page 10FUTURE RISK ANALYSIS
years. The projections incorporate the 2021 fiscal year investment return of 27.5%. Note,
that due to asset smoothing, only a portion of the investment gain will be recognized in
the 2021 valuation. Investment gains will continue to be recognized over the next four
years, which is why we see a downward trend in employer rates over the eight-year
period. If the fund earned 5.75% each year for the next five years, employer contribution
rates for the State plan would still decrease from 14.46% to 10.16% beginning in 2029.
Conversely, if the fund earned 7.75% each of the next five years, employer contribution
rates would decrease further from 14.46% to 6.92% beginning in 2029.
If all assumptions are met, employer contribution rates are inherently expected to trend
lower in the future due to blending in the lower cost hybrid plan as new members are
enrolled into the plan as well as recognizing the large investment gain from fiscal year
2021. This can be seen most clearly in the 6.75% return scenario in Exhibit 6 below,
which assumes no additional investment gains or losses over the projection period but
shows the downward trend in contribution rates.
Exhibit 6 - State Plan
Results based on June 30, 2020, actuarial valuation adjusted to incorporate new plan assumptions and the 27.5% fiscal
year 2021 fund return.
Page 11FUTURE RISK ANALYSIS
Exhibit 7 shows probabilistic or stochastic projections of future investment returns and
the impact on future contribution rates for the State plan. These stochastic projections
are based on VRS’s capital market outlook and target asset allocation. Capital market
outlooks are heavily influenced by the starting valuations, and after robust returns
following 2021, capital market outlooks have trended downward over the next 10 years
assuming further gains will be harder to come by in the near term. A longer-term outlook
over 20 years moderates investment returns and provides a median return of
approximately 6.75% based on the VRS target allocation. Under the “baseline” scenario,
there is a 50% probability that employer contribution rates will be between 2.65% and
12.99% by fiscal year 2029 with an expected employer rate of 8.57%.
The new capital market assumptions will be the “baseline” scenario used in the scenario
testing that follows later in the report.
Exhibit 7
Page 12FUTURE RISK ANALYSIS
Exhibit 8 provides similar deterministic analysis for the Teacher plan. As with the State
plan, the Teacher plan also trends downward due to incorporating the 2021 investment
return through asset smoothing. In addition, the Teacher plan also reflects a sizable
decrease in 2023 due to 10-year deferred contributions being paid off with an
accelerated payment in June 2021 offered by the Governor and approved by the General
Assembly.
Exhibit 8 – Teacher Plan
Results based on June 30, 2020, actuarial valuation adjusted to incorporate new plan assumptions and the 27.5% fiscal
year 2021 fund return.
Page 13FUTURE RISK ANALYSIS
Exhibit 9 shows the probabilistic or stochastic projections of future investment returns
and the impact on future contribution rates for the Teacher plan. There is a 50%
probability that by fiscal year 2029 employer rates will be between 3.72% and 13.89%,
with an expected contribution rate of 9.51%.
Exhibit 9
Scenario Testing (Unexpected or Unpredictable Economic Events)
Fiscal year 2021 saw a major rebound in markets following the disruption in fiscal year
2020 due to COVID-19. The stronger than expected rebound in global growth, along with
various other factors such as extraordinary monetary and fiscal stimulus, as well as a
jump in demand for goods and services as economies reopened have caused concern
over the potential for higher inflation in the near term. And while inflation is a chief
concern as the world begins to emerge from the pandemic, global scale questions still
remain surrounding the pace and availability of vaccinations, the possibility of additional
virus variants, and the uncertainty this may cause to financial markets.
Page 14FUTURE RISK ANALYSIS
The VRS investment team compiled three economic scenarios that provide a framing of
global economic outcomes that could occur over the next several years. The following
three illustrative scenarios are designed to show the potential magnitude of the impacts
on plan funding. There is no degree of certainty that any of these three scenarios will
correctly simulate what will actually occur over the next several years. Each scenario is
front-loaded, meaning that the impact is modeled to occur over the next several years.
Although merely illustrations, the scenarios help to highlight the vulnerability of the fund
to unexpected market shocks and the magnitude by which these scenarios can quickly
degrade funded status and accelerate employer contributions requirements.
Stagflation: Stagflation is characterized by slow economic recovery and relatively
high unemployment, or economic stagflation, which at the same time is
accompanied by rising inflation. The inflation modeled under this scenario will
fluctuate between 5.9% and 12.0% during the first six years, averaging 8.6%,
which is well above the 2.5% assumed rate of inflation.
o Although nominal returns are relatively high for equity, real returns reflect
much slower growth and are negative for years 1-5 in this scenario, implying
that this period of stagflation is front-loaded, then tapers off and reverts to the
baseline thereafter.
o Fixed income is hit hardest initially in years 1-4, but then stagnates slightly
below the baseline for the remainder of the scenario.
o Credit Strategies’ rate-sensitive exposure is adversely affected.
o Liabilities and benefit payments are also impacted in this scenario as inflation
exceeds the assumed 2.5% level during most years causing liability losses and
higher cash flow requirements due to cost of living increases applicable to
pension benefits.
Exhibit 10
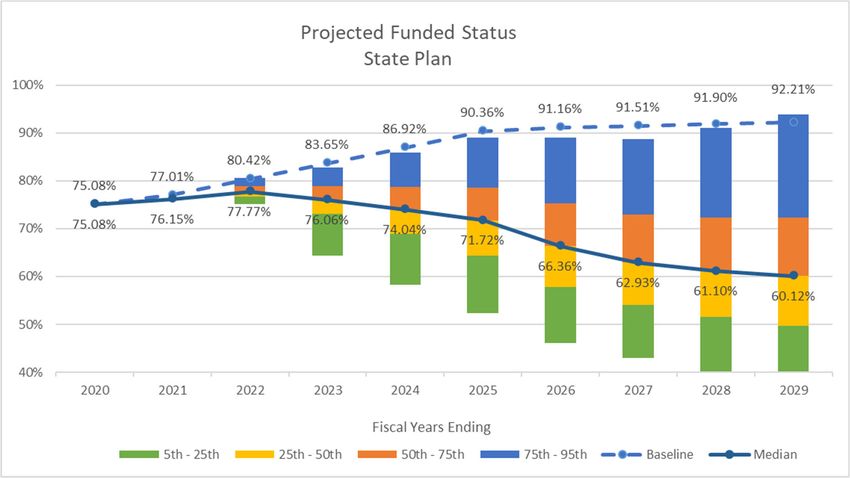
Page 15FUTURE RISK ANALYSIS The expected cumulative investment return from 2022–2027 would be 1.36% as compared to 6.75%, which is the assumed return over this period. Below are estimated impacts on funding measures over the next eight years for the State and Teacher plans under the stagflation economic scenario. Due to depressed returns as well as actuarial losses, the contribution rate would slowly increase over the eight-year period to just below 20% of covered payroll for the State plan and just over 20% for the Teacher plan. The funded status would also suffer in this scenario, dropping below 70% for both the State and Teacher plan in a relatively short period of time and adding approximately $3.0 billion in unfunded liability to the State and $6.0 billion to the Teacher plan over the first five years. Page 16
FUTURE RISK ANALYSIS

             Exhibit 11 – State Plan Impacts (Stagflation)

Page 17
FUTURE RISK ANALYSIS
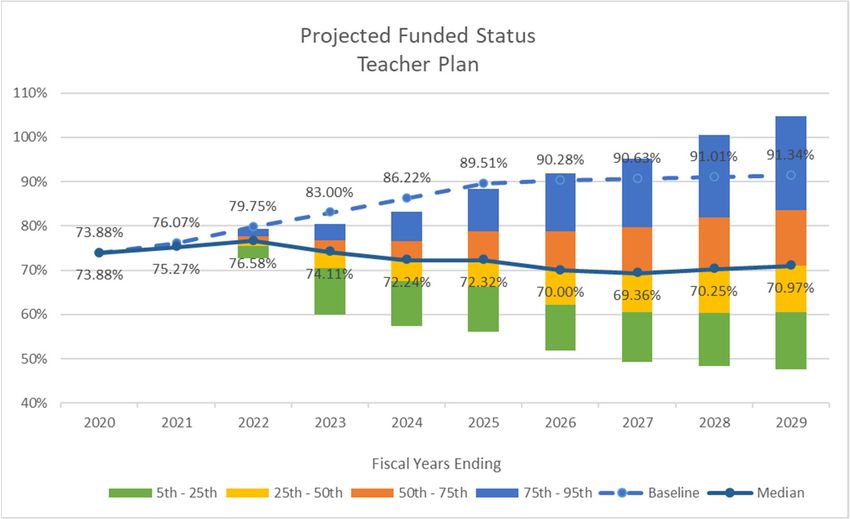
Exhibit 12 – Teacher Plan Impacts (Stagflation)
Page 18FUTURE RISK ANALYSIS
Inflation Surprise/Rate Hike: This scenario incorporates continued upward
trends in both wage and commodity inflation. The inflation modeled under this
scenario will fluctuate between 2.5% and 12.0% during the first six years
averaging 5.9%, which is well above the 2.5% assumed rate of inflation over the
first six years.
o Inflation spikes for years 1-2 and persists as the Federal Reserve finds
its policy tools to be ineffective over that time period.
o Period of inflation is followed by elevated interest rates that negatively
affect discounted cash flows.
o Inflation is under control after two years and then all asset classes
return to the baseline scenario.
o Liabilities and benefit payments are also impacted as inflation exceeds
the assumed 2.5% level during the earlier years of this scenario causing
liability losses due to cost of living increases applicable to pension
benefits.
Exhibit 13
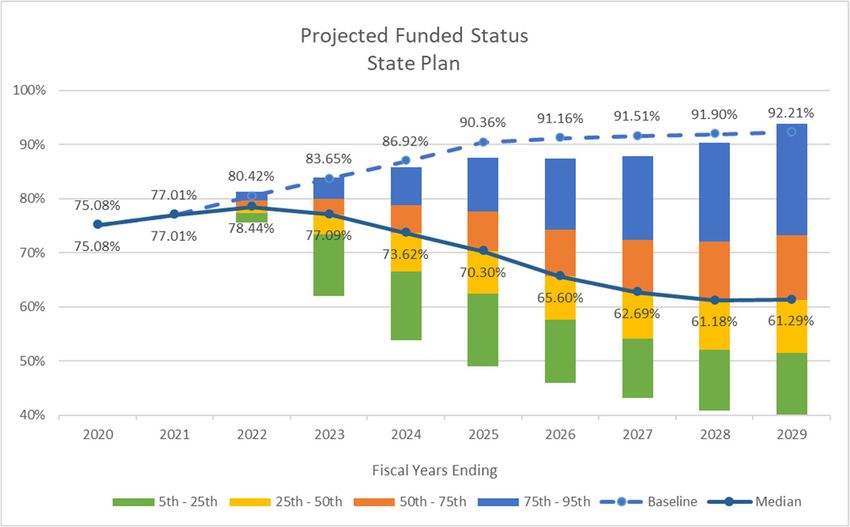
Page 19FUTURE RISK ANALYSIS The expected cumulative return from 2022–2027 would be 3.16% as compared to 6.75%, which is the assumed return over this period. Below are estimated impacts on funding measures over the next eight years for the State and Teacher plans under the Inflation Surprise/Rate Hike economic scenario. Due to depressed returns in the first two years as well as actuarial losses due to higher- than-expected inflation, the contribution rate would slowly increase over the eight-year period to just below 18% of covered payroll for the State plan and just over 18% for the Teacher plan. The funded status would also suffer in this scenario dropping into the low 70s for both the State and Teacher plan in a relatively short period of time adding approximately $2.0 billion in unfunded liability to the State and $4.0 billion to the Teacher plan over the first five years. Page 20
FUTURE RISK ANALYSIS

          Exhibit 14 – State Plan Impacts (Inflation Surprise/Rate Hike)

Page 21
FUTURE RISK ANALYSIS
Exhibit 15 – Teacher Plan Impacts (Inflation Surprise/Rate Hike)
Page 22FUTURE RISK ANALYSIS
Delta or Other COVID Variants: In this scenario COVID-19 becomes endemic,
forcing rolling shut-downs in various degrees of magnitude, depending on local
infection rates.
o The original vaccines are found to be increasingly ineffective against
variants.
o It takes 3-4 years to return to normal in a global economy that is
contracting over that period with a slow return to the baseline.
o Risk assets hit hardest in years 1-3.
Exhibit 16
The expected cumulative return from 2022–2027 would be 0.85% as compared to
6.75%, which is the assumed return over this period.
Page 23FUTURE RISK ANALYSIS
Below are estimated impacts on funding measures over the next eight years for the State
and Teacher plans assuming a Delta or Other COVID Variants economic scenario.
Due to depressed returns in the first three years, the contribution rate would slowly
increase over the eight-year period to just over 20% of covered payroll for the State plan
and just over 21% for the Teacher plan. The funded status would also suffer in this
scenario dropping into the low 60s for both the State and Teacher plan in a relatively
short period of time adding approximately $4.5 billion in unfunded liability to the State
and $8.0 billion to the Teacher plan over the first five years.
Exhibit 17 – State Plan Impacts (Delta or Other COVID Variants)
Page 24FUTURE RISK ANALYSIS
Exhibit 18 – Teacher Plan Impacts (Delta or Other COVID Variants)
Page 25FUTURE RISK ANALYSIS Cash Flow Projections Defined benefit pension plans are designed to provide employees with a guaranteed income stream upon retirement. Contributions in VRS plans are generally shared by employees and their employer and are a systematic way of prefunding the system’s costs. The benefit of prefunding is that investment returns on the prefunded plan assets reduce the employer’s long-term contributions. Retirement plans that have been in operation for a number of years generally have contributions coming into the plan and benefits being paid out. The net (non-investment) cash flow is the difference between the contributions and benefits and expenses of the fund. These cash flows will vary for each plan because all plans have different demographics and maturities. Mature plans often have negative cash flows over time, which is considered the normal cycle of pension plans. Negative cash flows do not necessarily imply a plan is in trouble. In fact, part of the benefit and efficiency of prefunding is so the investment returns can pay a significant portion of the benefit payments. Page 26
FUTURE RISK ANALYSIS

                                                      Exhibit 19

   Results based on June 30, 2020, actuarial valuation adjusted for new assumptions approved by the VRS Board of
   Trustees in the spring of 2021.

   Exhibit 19 above shows the projected contributions and investment returns needed by
   the State plan to avoid negative cash flows over the next 30 years. The blue portion of the
   chart represents the contributions that are expected to be made each year. The green
   portion of the chart represents the level of investment return that is needed, while the
   blue and green added together represent the expected benefit payments from the plan.

   The red line is the level of investment return needed (scale on left of the chart) to
   generate the investment return (green portion of chart) to keep the incoming cash flow
   (contributions plus investment return) equal to the plan’s expected benefit payments
   and expenses. Benefit payments in the State plan are expected to peak in 2037 before
   beginning to reduce as more members are covered by the Hybrid Retirement Plan. The
   overall employer cost of the hybrid plan is lower than Plan 1 or Plan 2, which means that
   as the population covered by the hybrid plan grows fewer employer contributions will go
   into the plan. Note that the drop off in contribution requirements in 2044 coincides with
   the payoff of the legacy unfunded liabilities. Fewer contribution dollars flowing into the

Page 27
FUTURE RISK ANALYSIS plan generally causes more reliance on investment returns to cover cash flow requirements in later years. The investment return needed over this period to avoid negative cash flow ranges from 3.35% to 6.63%, with an average return of approximately 5.33% to stay cash flow positive to the fund. Exhibit 20 below shows the projected contributions and investment returns needed by the Teacher plan to avoid negative cash flows over the next 30 years. Benefit payments in the Teacher plan are expected to peak in 2048 compared to 2037 for the State plan as turnover in this plan is less than in the State plan. Note that a similar drop off in contribution requirements in 2044 also coincides with the payoff of the legacy unfunded liabilities in the Teacher plan. Fewer contribution dollars flowing into the plan will require higher investment returns to cover cash flow requirements in later years. The investment return needed over this period to avoid negative cash flow ranges from 1.94% to 5.87%, with an average return of approximately 4.18% to stay cash flow positive. The average return needed for the Teacher plan is less than the State plan due to higher contribution requirements for the Teacher plan during much of the projection period, which offsets the need for additional investment return to cover plan costs during those years. Page 28
FUTURE RISK ANALYSIS

                                                      Exhibit 20

   Results based on June 30, 2020, actuarial valuation adjusted for new assumptions approved by the VRS Board of
   Trustees in spring 2021.

   During periods of continued volatility, assets in plans with less liquidity are likely to be
   sold at a loss and as a result may contribute to decreasing funded ratios. In the U.S., plans
   have an average of 1% of their target portfolios held in cash and short-term investments
   to pay ongoing expenses, such as benefit payments and administrative costs. A liquidity-
   to-assets ratio can be useful in determining the liquidity risk, if any, of a pension plan.

                                                Cash + Contributions - Benefit Payments & Expenses
     Liquidity to Assets Ratio =
                                                              Market Value of Assets
   A negative liquidity-to-assets ratio indicates the pension plan requires additional money
   to maintain operations and make all benefit payments. The further the ratio is below
   zero, the higher the percentage of assets that may have to be converted to cash. In a
   typical year, cash flows may be supplemented by realizing positive investment returns.

Page 29
FUTURE RISK ANALYSIS
Currently VRS is targeting 1.0% of the portfolio to be held in cash and short-term
investments to pay ongoing expenses. As of June 30, 2020, the liquidity to asset ratio for
all VRS pension plans in aggregate was -1.45%. This means that in addition to the cash
allocation of 1% of assets and member and employer contributions, an investment
return of approximately 1.45% is required to generate enough funds to pay benefits and
expenses without requiring further liquidation of investments.
Exhibit 21 below shows the expected liquidity ratio for all VRS plans in aggregate over
the next 30 years. Similar to the cash flow exhibits above, the liquidity ratios show
increased reliance on investment returns over the next 10 to 15 years if contributions
remain level and benefit payments continue to increase. Similar to what we see with the
cash flow projections in Exhibits 19 and 20 above, by 2034 more reliance on investment
returns will be required to keep the fund cash flow neutral due to an increasing number
of benefit payments being paid. This equates to a liquidity-to-asset ratio of -3.27% in
2034 before moderating as the asset base grows.
Exhibit 21
Page 30FUTURE RISK ANALYSIS Contribution Risk Following the Global Financial Crisis and subsequent economic fallout, there was renewed focus by rating and oversight agencies on financial reporting and funding of employer benefit plans. Except for in limited cases, political subdivision plans are required by statute to contribute the full Board-certified actuarially determined contribution rate. This has historically kept the political subdivision plans much better funded than the statewide plans. The State committed to fully funding the actuarial required contributions for statewide plans and demonstrated that commitment by achieving full funding of contributions earlier than required in the transition plan codified in § 51.1-145 of the Code of Virginia, which was part of the pension reform efforts in 2012. This cultural shift in full funding of actuarial required rates along with the additional focus provided by rating and oversight committees has helped improve funding levels for benefit plans since the last recession. Even with the positive changes that have been made it is necessary, given the current economic environment, to discuss contribution risk. Contribution risk is the possibility that actual future contributions deviate from what was expected. This type of risk is typically linked to investment performance, assumption changes, or changes in plan design that unexpectedly impact future contribution rates. The COVID-19 crisis, which has had variable impact on state and local economies, has highlighted another facet of contribution risk – the risk that the funding source is disrupted or impacted, causing the possibility of underfunded rates, which would lead to higher future costs for the plans. While economic shocks are able to be smoothed into the employer contribution rates to manage volatility, budget impacts that may persist due to the pandemic, may continue for several years. Although the Commonwealth’s current revenue picture is positive, the reduced revenue that the State and local employers could face due to the pandemic could potentially continue to be a contributing factor to the risk of underfunding. Longevity Risk Longevity risk is a term used to describe the instance in which life expectancies are longer than what was assumed. In defined benefit plans, longevity risk is the risk that members live for longer than is currently expected. This can result in pensions being paid for longer than expected, thus costing plans more money. Page 31
FUTURE RISK ANALYSIS

   Longevity risk is likely to be one of the most significant risks for most plans and has
   become increasingly important in assessing the overall risk profile as discount rates have
   fallen and liabilities have increased.

   Mortality assumptions used for the valuation of pension benefits can have a large impact
   on the calculation of pension liabilities, so the selection of appropriate mortality tables is
   important.

   There are two basic types of mortality tables − static mortality tables and generational
   mortality tables. Static or “period” tables contain probabilities of death for each age,
   typically separately for men and women. These tables are relatively easy to construct
   and for actuaries to work with. The downside with this approach is that, as life
   expectancy continues to improve, these tables can quickly become out of date and may
   need to be updated on a regular basis. Historically, VRS has used static mortality tables
   with a margin approach that essentially adjusted expected mortality down by 10% to
   12% to anticipate mortality improvement. This approach was predominantly used
   among public pension plans until recent years.

   Generational tables are more sophisticated and include assumptions with regard to
   current and expected future rates of improvements in mortality. Such tables are more
   difficult to construct, but technology can assist in the production of these more complex
   models. The use of generational mortality tables has become more prevalent in recent
   years in developing pension liabilities. In addition, since mortality improvements are
   built into the tables, future adjustments may not need to be made as frequently as would
   be necessary with a static mortality table.

   Following the 2021 quadrennial experience study, the VRS Board of Trustees moved
   from a static table based on Society of Actuaries RP-2014 mortality table adjusted for
   margin and based on a head-count weighted basis to a Society of Actuaries public sector
   mortality table PUB-2010 using a generational mortality approach and a benefits-
   weighted basis. The benefits-weighted basis weights the age at death of retirees with
   larger benefits more than the age at death of retirees with smaller benefits. For the VRS
   population this effectively created longer life expectancies than when using a head-count
   weighted basis.

Page 32
FUTURE RISK ANALYSIS

   Incorporating generational mortality into VRS assumptions increased total liabilities of
   all pension plans approximately 2.8%, or $2.9 billion. Below is a breakdown by plan of
   impacts to actuarial accrued liability related to the change in mortality tables:

                                                     Exhibit 22

                                         Entry Age Accrued Liability ( $'s Billions)

                                                                Switch to Pub2010
                                            2020 Valuation                          Percentage
                                                                 Mortality Table                    Dollar Increase in
       Plan                                 RP‐2014 Static                          Increase in
                                                                with Modifed MP‐                    Accrued Liability
                                            Mortality Table                       Acrrued Liability
                                                                  2020 Amt Wtd

   State                                        $25.75                 $26.40          2.51%              $0.65
   Teachers                                     $50.84                 $51.80          1.90%              $0.96
   SPORS                                        $1.21                   $1.25          3.90%              $0.05
   VaLORS                                       $2.26                   $2.33          3.14%              $0.07
   JRS                                          $0.68                   $0.75          10.18%             $0.07
   Political Subdivisions in Aggregate          $25.31                 $26.46          4.55%              $1.15
   Total Pension Liabilities                   $106.04                $108.99          2.78%              $2.95

   The exhibit below highlights the assumed increase in life expectancy associated with the
   new mortality tables adopted by the VRS Board of Trustees in April 2021.

                                                     Exhibit 23

Page 33
FUTURE RISK ANALYSIS
LIFE EXPECTANCY
STATE
MALE FEMALE
Current Generational Current Generational
Mortality Mortality Mortality Mortality
Age Table Table Table Table
55 83.06 85.07 85.96 87.08
65 84.91 86.06 87.15 87.76
75 87.53 88.04 89.08 89.24
LIFE EXPECTANCY
TEACHERS
MALE FEMALE
Current Generational Current Generational
Mortality Mortality Mortality Mortality
Age Table Table Table Table
55 84.95 86.26 87.87 88.99
65 86.20 86.77 88.70 89.41
75 88.10 88.32 90.19 90.44
HAZARDOUS DUTY
MALE FEMALE
Current Generational Current Generational
Mortality Mortality Mortality Mortality
Age Table Table Table Table
55 82.34 84.13 83.61 83.65
65 84.13 84.92 85.10 84.64
75 86.66 87.03 87.60 86.86
JRS
MALE FEMALE
Current Generational Current Generational
Mortality Mortality Mortality Mortality
Age Table Table Table Table
55 83.06 87.34 85.96 90.16
65 84.91 88.18 87.15 90.67
75 87.53 89.83 89.08 91.77
Page 34FUTURE RISK ANALYSIS
In addition to reflecting increases in life expectancy for current members, the new tables
also incorporate additional mortality improvements for future generations. The tables
below show the life expectancy of members who attain age 55, 65, and 75 in 2021 as
compared to projected life expectancy for members who will attain age 55, 65, or 75 in
the year 2041.
Exhibit 24
LIFE EXPECTANCY
STATE
MALE FEMALE
Generational Generational Generational Generational
Mortality Mortality Mortality Mortality
Age Table 2021 Table 2041 Table 2021 Table 2041
55 85.07 86.37 87.08 88.26
65 86.06 87.16 87.76 88.76
75 88.04 88.83 89.24 90.01
LIFE EXPECTANCY
TEACHERS
MALE FEMALE
Generational Generational Generational Generational
Mortality Mortality Mortality Mortality
Age Table 2021 Table 2041 Table 2021 Table 2041
55 86.26 87.41 88.99 90.04
65 86.77 87.79 89.41 90.33
75 88.32 89.08 90.44 91.18
HAZARDOUS DUTY
MALE FEMALE
Generational Generational Generational Generational
Mortality Mortality Mortality Mortality
Age Table 2021 Table 2041 Table 2021 Table 2041
55 84.13 85.41 83.65 84.99
65 84.92 86.02 84.64 85.76
75 87.03 87.81 86.86 87.67
JRS
MALE FEMALE
Generational Generational Generational Generational
Mortality Mortality Mortality Mortality
Age Table 2021 Table 2041 Table 2021 Table 2041
55 87.34 88.58 90.16 91.24
65 88.18 89.24 90.67 91.62
75 89.83 90.62 91.77 92.53
Page 35FUTURE RISK ANALYSIS While the new generational mortality tables do not totally alleviate longevity risk, they help reduce the exposure by anticipating longer lifetimes and incorporating additional funding to potentially pay benefits for longer periods of time. Potential Strategies to Enhance Funding VRS continues to support strategies to lower the legacy unfunded liabilities of the plans. While these various techniques could save employers money on future contributions, increasing contributions during a fiscal crisis, even in order to ultimately save money, might not be a practicable or realistic approach. Nevertheless, when revenues and fiscal conditions allow, these alternatives may serve to reduce future employer expenditures and are worth discussing here. A decade of bull markets has shown that investment returns alone will not get rid of the legacy unfunded liabilities, which were in part the result of a failure to fund the certified contribution rates. Recent financial crises such as the Global Financial Crisis and impacts of the pandemic in 2020 have shown that plans with greater unfunded liabilities will continue to be more vulnerable to market downturns. This suggests that a dedicated effort to pay down unfunded liabilities on a more accelerated basis may help to cushion any potential uncertainty that could occur with future market downturns. Shorten Period for Amortization of Legacy Unfunded Liability Although the current funding policy puts the plans on a path to full funding by 2044, it is important to understand how the legacy unfunded liability is being amortized and how it is expected to change over time. As discussed above, to keep plan costs level over time, unfunded liabilities are generally amortized using a “level percentage of payroll” method. This method assumes that payroll will increase over time due to both inflation and merit increases, so it aims to collect roughly the same percentage of payroll each year, which should inherently collect larger dollars in later years as payrolls increase. “Back-loaded” funding methods are commonly used to fund public sector plans; though some plans opt to use revenue growth rather than growth of payroll as the basis for the growth rate. The alternative would be to amortize unfunded liabilities as a “level dollar” amount, which would collect the same cash contribution each year similar to a home mortgage. This approach generally causes “front-loading” of contributions by paying a higher percentage of Page 36
FUTURE RISK ANALYSIS

   contributions as a percent of payroll early in the amortization period and a smaller
   percentage toward the end of the amortization period.

   In 2013 when VRS updated its funding policy, one of the changes was to move from open
   to closed amortization periods in order to pay down unfunded liabilities. It was decided
   that all future gains and losses would be amortized over 20-year closed periods. This
   method would avoid “negative amortization” and also pay down losses more closely
   related to the working lifetime of members rather than pushing costs beyond their
   working career. Negative amortization occurs when the amortization payment is set too
   low to cover the interest payment on the outstanding balance, which results in an
   increase in the principal balance of the loss.

   The legacy unfunded liability established as of 2013 was amortized over a 30-year closed
   period. This was done in large part to moderate employer rates, which at the time were
   not being fully funded by the Governor and General Assembly. Using a shorter
   amortization period would have increased rates even more steeply than the move to the
   closed amortization period. One issue with amortizing unfunded liabilities over longer
   periods of time—such as 30 years—is that during the first nine or 10 years, the interest
   payments on the unfunded liability will be in excess of the amortization payment, which
   creates “negative amortization.” This means that the outstanding balance actually
   increases during the first eight or nine years of amortization as payments go toward
   interest rather than principal.

   As of June 30, 2020, the State plan legacy unfunded liability has 23 years of the original
   30 years remaining to be paid, with an outstanding balance of $7.5 billion. Under the
   current amortization schedule, $7.7 billion of interest will be paid over the next 23 years
   on the $7.5 billion outstanding balance. To illustrate, as shown in Exhibit 25, adjusting
   the remaining period for the legacy unfunded liability down to 20 years beginning with
   the 2021 valuation would avoid any additional negative amortization and save the State
   approximately $915 million in interest payments. The shorter amortization period would
   increase employer rates by approximately 0.73% of covered payroll each year of the
   remaining amortization period.

Page 37
FUTURE RISK ANALYSIS

                                                          Exhibit 25

   Results based on June 30, 2020, actuarial valuation.

   Note that any impacts that result in flat or even declining workforce/payroll in the public
   sector, similar to what was seen after the Global Financial Crisis in 2008-2009 would
   likely result in increases in amortization payments as a percentage of payroll due to
   payments to the unfunded liability being less than expected.

   Maintain Current Contribution Rates

   Maintaining current contribution levels following years in which the plan experiences
   actuarial gains could help create a cushion against future actuarial losses while
   improving the plan funded status. For example, when rates are expected to decrease due
   to investment gains realized in FY 2021, maintaining the existing contribution rates
   would serve to bolster the plans and reduce negative amortization payments. This
   strategy has been implemented by the VRS Board of Trustees for political subdivision
   plans for both pension and OPEB plans. It allows for alternative funding requirements
   that can be applied in situations to either improve or strengthen funding levels of
   political subdivision plans that are “at-risk” or poorly funded as determined by the plan
   actuary.

Page 38
FUTURE RISK ANALYSIS Limitations on Benefit Enhancements Another strategy adopted by the VRS Board of Trustees is to require political subdivision plans to meet specific funding measures in order to make modifications or enhancements to benefits. Plans are required to be at least 75% funded both before and after any plan changes, which could require the employer to make lump sum payments at the time of a plan change in order to maintain the plan funding level. This prevents employers from adding large liabilities to their plans that they may not be able to pay for in future years. Legislatively mandated benefit expansions, however, must be provided by all employers despite the employer’s funded status. In addition, some benefit enhancements can create immediate liabilities. As benefits enhancements are considered, focus should not only be placed on the contribution rates required to fund the benefits, but also the unfunded liabilities generated. Page 39
FINDINGS & CONCLUSIONS
While economic markets rebounded to provide strong returns for fiscal year 2021, COVID-19
continues to create uncertainty in global markets and unpredictable impacts to future market
returns.
Changes to assumptions recommended following the 2021 quadrennial experience study,
including changing to a generational mortality approach on a benefits-weighted basis, will
offset some of the investment gains, but will better position the plan to address longevity risk
associated with members living longer in retirement.
As plans mature and assets continue to grow, downside investment risk will have a bigger
impact on plan funded status and employer contribution rates.
Opportunities exist to proactively address some of these concerns and to better position the
retirement plans to provide the financial stability for current and future members of VRS.
Accelerating payback of the legacy unfunded liability has the potential to save billions in future
employer contributions while enhancing the funded status of the retirement plans. This could
be achieved by:
Reducing amortization periods for remaining legacy unfunded payments.
Maintaining current employer contribution rates when positive experience would
otherwise allow for a reduction in employer rates.
Adjusting methodology used to amortize unfunded liabilities.
Avoiding the expansion of benefits across pension and OPEBs while plans remain
underfunded.
Next Steps
Due to the continued uncertainty surrounding the COVID-19 recovery and the
corresponding impacts on the economy at large, analysis of future impacts on the VRS
fund will continue as new information becomes available.
VRS will continue to monitor the health of the plans and is committed to providing
robust analysis for consideration by the VRS Board of Trustees and other stakeholders.
Page 40APPENDIX
§ 51.1-124.30:1. Adoption of stress testing and reporting policies.
The Virginia Retirement System (VRS) shall adopt a formal policy to:
1. Develop and regularly report sensitivity and stress test analyses. Such analyses and
reporting shall include projections of benefit levels, pension costs, liabilities, and debt
reduction under various economic and investment scenarios;
2. Improve investment transparency and reporting policy by (i) providing a clear and
detailed online statement of investment policy; (ii) including one-year, three-year, five-
year, and 10-year investment performance data in quarterly investment reports; (iii)
including 20-year and 25-year investment performance data in annual investment
reports; (iv) reporting net investment returns on a quarterly basis; and (v) reporting
gross investment returns and returns by asset class on an annual basis; and
3. Regularly report investment performance and expenses such as external manager fees,
carried interest fees, and investment department expenses for all asset classes, including
private equity, public equity, fixed income, credit strategies, real assets, strategic
opportunities, and other investments.
2017, c. 639.
Page 41You can also read