RENEWABLE ENERGY PLAN - l Q - Durham County
←
→
Page content transcription
If your browser does not render page correctly, please read the page content below
DURHAM
COUNTY

               RENEWABLE
[l[Q
.   .
* • 1881 • *
               ENERGY PLAN

                 2022----
TABLE OF CONTENTS
EXECUTIVE SUMMARY                                                                            2-6

BASELINE & ENERGY FORECAST                                                                 8-10

FRAMING THE GAP ANALYSIS                                                                      10
STRATEGIES & CONSIDERATIONS                                                                    11
SUMMARY OF SCENARIOS                                                                      12-16

SUMMARY OF INDIVIDUAL STRATEGIES FOR                                                    17-22
IMPLEMENTATION
IMPLEMENTATION TIMELINE & BUDGET                                                        23-27

SUMMARY                                                                                       28

APPENDIX A: STRATEGY DESCRIPTIONS                                                       29-40
METHODOLOGY                                                                              41-48
ASSUMPTIONS                                                                              45-48

                                     PREPARED BY:
                                         Optony
               EcoShift Consulting, a division of Blue Strike Environmental

                                                                              table of contents | 1
EXECUTIVE SUMMARY
• Reduce building electricity consumption with energy efficiency, on-site generation, and renewable thermal
alternatives
• Explore renewable options such as solar to replace all electricity that is fossil or nuclear powered
• Focus on building electrification, which may include replacing all building thermal energy sources with heat pump
water heaters, solar-source heat pumps, or renewable fuels
• Replace fossil fueled vehicles with electric or renewable diesel options
• Select, design, and implement actions with conscious focus on equity impacts
BACKGROUND
Energy policy is set at the state level in North Carolina and utilities are regulated through the NC Utilities Commission. This
leaves local communities with limited choices regarding how they procure energy sources. North Carolina has been a
leader in renewable energy for over a decade, beginning with the passage of the southeast’s first law to require utilities to
provide renewable energy through the Renewable Energy and Efficiency Portfolio Standard (REPS). Under this law,
investor-owned utilities in North Carolina are required to meet at least 12.5% of their energy production through
renewable energy resources and energy efficiency measures.
Recent state laws such as Competitive Energy Solutions for NC (2017) and Energy Solutions for North Carolina (2021)
require electric utilities to increase the amount of renewable energy they generate and purchase, thus increasing the
percentage of renewable energy available to customers through the grid. In addition, Governor Cooper has signed
several Executive Orders (EO80, EO218, and EO 246) that create aggressive clean energy and greenhouse gas reduction
goals for North Carolina that will in turn affect the energy mix and emissions at the local level.
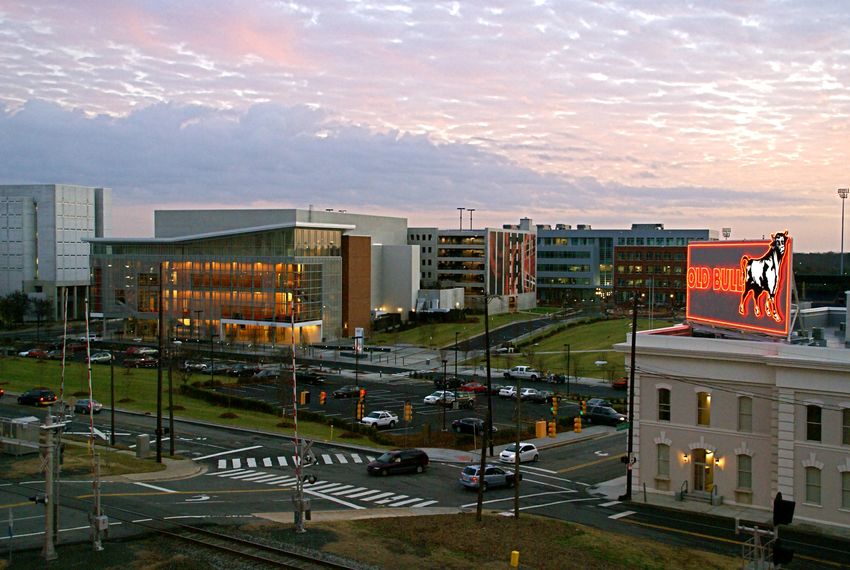
Durham County has had a commitment to high performance buildings for more than 15 years, and has to date built or
renovated over a dozen buildings to LEED standards. The County adopted a High Performance Building policy in 2008
and entered into a Utility Performance Contract in 2012 that resulted in significant energy and water savings in seven
buildings over 15 years.
The County’s Environmental Affairs Board (EAB) wrote the definition for what energy is considered renewable as it relates
to the County’s goals, One point of consideration is how to account for nuclear energy which makes up 25%1 of the
electricity provided to Durham County through the electrical grid. Nuclear Energy is a source of carbon-free electricity but
is not considered clean or renewable.
1
Duke Energy Carolinas 2020 Integrated Resource Plan
executive summary | 2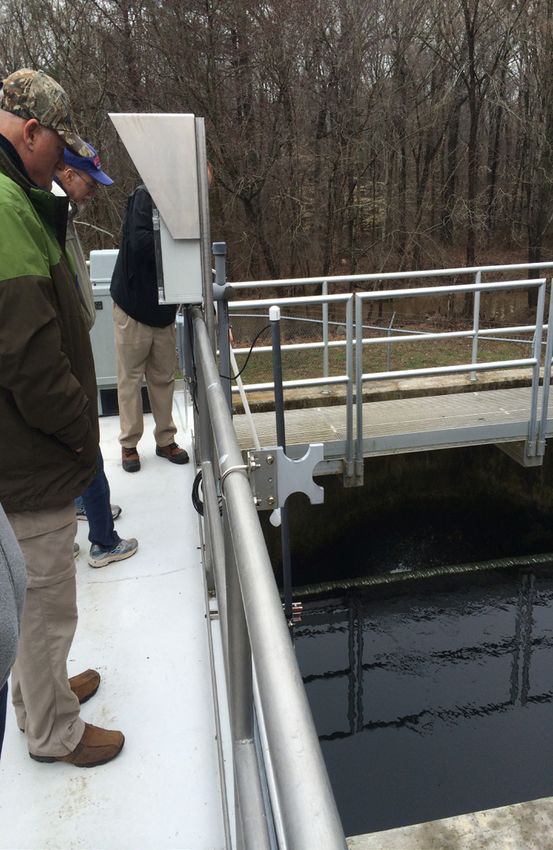
definition of renewable energy
 Clean, renewable energy is defined as energy derived from ongoing natural processes that rapidly replenish and is
 sustainably collected from natural resources such as solar, wind and geothermal. Other approaches may be included after
 being evaluated for sustainability and environmental justice implications. Energy Efficiency will continue to be an important
 part of our approach by minimizing the amount of energy used overall.

 It is important to note that one potential strategy discussed in the REP, renewable diesel used in the County fleet, does not
 directly align with the definition presented above. This solution would need to be evaluated further by County staff and
 the EAB with respect to sustainability, carbon intensity and environmental justice considerations.

 EQUITY
 Durham County is committed to transitioning to clean, renewable energy in a just and equitable manner. This means
 that all actions, projects, and policies need to be developed, analyzed, and implemented in ways that shift the negative
 effects away from communities that have traditionally been overburdened and positive effects towards those that have
 traditionally been left out of the economic and environmental benefits. Because this plan is focused on county operations
 and county facilities, most of the impacts will be contained on Durham County property. However, staff must still work
 with the community to answer key questions including what impacts there will be, who will be affected, who benefits,
 how can negative impacts be minimized and positive impacts maximized for affected neighbors and communities.

 As applicable, throughout the implementation process, the County will frame vendor solicitations with equity as a core
 value. Equity can play a role in ensuring that projects are sized to fit the capabilities of certified small businesses who might
 not be able to bid on larger projects. Equity can also play a role in designing projects to have a workforce development
 element. Throughout the planning process, the County will look for ways to build public private partnerships that can
 scale the value of the projects being implemented. In addition, the County will adhere to its equitable engagement
 commitment to ensure that people who are most affected by decisions are part of the planning process.

 benefits & outcomes

  ALIGN WITH LOCAL             contribute to             PROMOTE LOCAL            ENHANCE DISASTER           REACH STATE GOALS
CLIMATE ACTION PLAN           global climate                ECONOMIC                 RESILIENCY
                                  action                  DEVELOPMENT
Align with the priorities   Decrease greenhouse       Produce green jobs in       Continue operation          Share best practices
outlined in the updated        gas emissions by          the solar, energy         of critical facilities    with local and regional
 Durham Local Climate       transitioning to 100%      efficiency industries,     and services during               networks.
  Action Plan and the         renewable energy.        and electric vehicle             disasters.
  2017 Strategic Plan.                                        sectors.

 RECOMMENDED STRATEGIES
 The appropriateness of each proposed strategy, including SMART recommendations highlighting specific, measurable,
 achievable, relevant, and timely goals will be considered for implementation. These specific measurements allow the
 County to follow a concrete time frame for strategy completion driven by the feasibility and costs of each action within
 Durham County. The County utilized EcoShift’s Climate and Energy Scenario Analysis (CESA) tool to test and create various
 pathways to 80% and 100% renewable energy.

                                                                                                            executive summary | 3
POLICY ALIGNMENT

    energy efficiency rooftop solar &                         fleet                 building                   fill the gap
                      large scale solar                                          electrification
                                                       Right-size the fleet
    Target energy          Invest in on-site solar                              Switch natural gas         Advocate for
    efficiency projects    projects                    Transition to Electric   boilers and hot water      increased grid
    to reduce 20% of                                   Vehicles                 to heat pumps at           renewables through
    energy usage           Participate in Duke                                  large facilities           policy change and
                           Energy’s Green              Reduce VMT                                          utility engagement
                           Source Advantage                                     Plan new facilities to
                           program                     Purchase renewable       reduce natural gas         Purchase minimal
                                                       diesel (when             use                        amount of
                           Sell All (when              available)                                          renewable energy
                           available)                                                                      credits

                                                     STATEWIDE ENGAGEMENT
The recommended strategies are combined into scenarios that align growth, phasing, and infrastructure investment over
various time horizons. These scenarios can be adjusted as market trends change to account for budgetary uncertainty
and Duke Energy’s unpredictable future renewable energy portfolio. Three primary scenarios were developed: a
Phased Investment scenario based on the County’s typical boiler, HVAC, and fleet vehicle replacement schedule; an
Accelerated Investment scenario that doubles the pace of investment; and a High Impact Solar Investment that includes
a number of additional off-site solar project ideas that will help propel the County to 100% renewable energy. For a
complete breakdown of each scenario, refer to Appendix A.

                            POSITIVE                               NEUTRAL                               NEGATIVE
    scenario name             key characteristics                       considerations                              IMPACT
                              1 Heat Pump project/year                  Follows County’s standard HVAC and 47% GHG
                                                                        fleet replacement schedules           reductions by
                              2 Rooftop Solar projects/year                                                   20302
                                                                        Additional cost considerations (price
                              Fleet Replacement schedule                premiums)                             53% renewable
                                                                                                              energy by
                              Renewable Diesel fleet conversion         Takes longer to reach goals           2030, and 72%
                                                                                                              by 2050
                                                                        Benefits of improvements accrue
                                                                        more slowly

                                                                        Higher investment required closer to
                                                                        goal target date

2
    Compared to 2020 GHG levels

                                                                                                            executive summary | 4
2 Heat Pump projects/year               Higher investment each year relative      61% GHG
                                                                     to the Phased approach                    reductions by
                             4 Rooftop Solar projects/year                                                     2030
                                                                     Additional cost considerations (price
                             Accelerated Replacement                 premiums)                                 61% renewable
                             schedule (doubles the pace of fleet                                               energy by
                             replacement)                            Might retire some vehicles before         2030, and 72%
                                                                     useful life is realized                   by 2050
                             Renewable Diesel fleet conversion

                             Identical to Accelerated Investment, Regulatory considerations                    100% GHG
                             but also including off-site solar                                                 reductions
                             projects to meet County goals            Community considerations regarding       through 2030
                                                                      solar installations at the stadium
                             Note: CESA modeling for this                                                      100%
                             scenario uses 5 solar projects           Ability to attract solar developers to   renewable
                             developed through Duke Energy’s
                                                                      County sites                             energy by
                             Sell-All tariff (4 at the County stadium
                                                                                                               2050
                             and 1 at the landfill). However, given
                             significant policy and market            Ensuring additionality for RECs
                             uncertainty and concerns over            sourced from off-site renewables
                             project viability, the REP describes
                             four other off-site solar development Financial risk for County inherent
                             strategies that could be used by the in exploring new programs and
                             County (See Phase 3 and Appendix contracting arrangements
                             A) to fill the same need for renewable
                             electricity

Figure A: Key characteristics within each Scenario

CONTINUOUS IMPROVEMENT needed
The development of this REP is an important first step on the County’s path to 100% renewable energy. Increasing from
2% to 100% renewable energy will require commitment from the County, strong local and regional partnerships, and
engagement with a wide variety of stakeholders.

Monitoring the progress of the REP will also be important to its success. To that end, the County has developed tools to
track progress towards its goals. The County will provide regular updates on the progress of this Plan and encourages the
community to stay involved as critical stakeholders.

Forces outside of the County’s direct control like emerging technologies, market forces, and state and federal policies will
continue to change over time, affecting the County’s progress towards its goals. It is expected that many of the projects
outlined in this report that are less feasible today will become more feasible over the next 10-20 years. Of the projects that
are feasible today, it is expected that the economics of many of them will improve. For example, the costs of solar panels
and battery storage are expected to continue to decline. Other technologies like offshore wind and renewable fuels are
also expected to mature over the next 10-20 years.

While market and policy solutions are certain to arise to address some barriers the County is facing, challenges outside
of the County’s direct control may persist through 2050 including the use of natural gas in Duke Energy’s electricity
generation mix and the presence of non-renewable energy in regional imports on the electricity grid. Considering
current projections for the renewable content of grid electricity in North Carolina and current limitations to
on-site renewable development opportunities, the County does not reach its renewable energy goals without

                                                                                                       executive summary | 5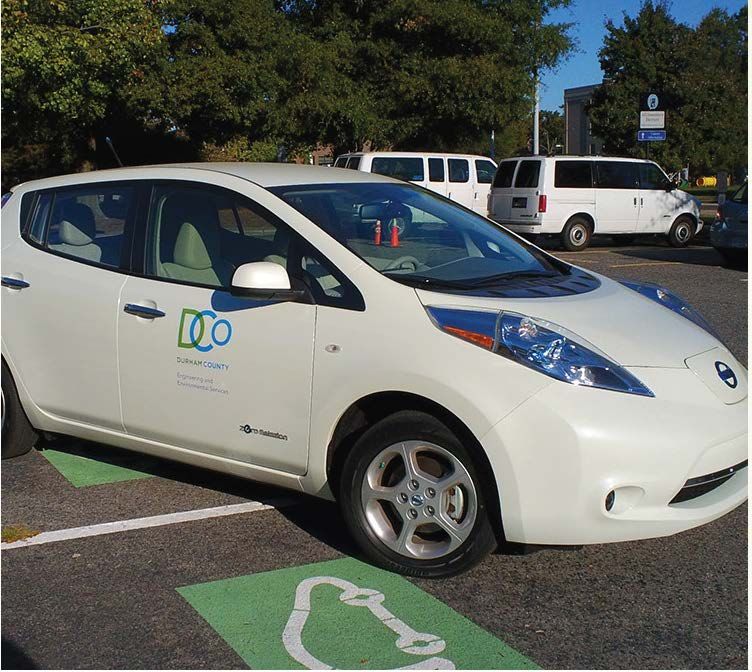
significant off-site renewable energy development. Additionally, while the County owns significant land to support
said development, all potentially viable avenues for that development have significant challenges and risks associated with
them (described further in Appendix A). Because of this, it is possible the County will need to consider the purchase of
carbon offsets or retirement of RECs. The purchase of RECs should be weighed carefully against other solutions, as well as
the source and quality of the RECs, within the larger context of the County’s goals.

As this REP demonstrates, there are a number of options the County can pursue on its journey to 100% renewable energy,
but each has unique challenges and risks. As the forces outlined above unfold and evolve, it will be important to revisit the
assumptions in this REP. As such, this should be viewed as a living document that will change over time in response to
changes in market and policy conditions. Consider this REP as a guidebook as the County launches towards a bold new
future fueled by clean, renewable energy.

overall funding needed
Outlined in this report is a thorough breakdown of all costs associated with individual projects and the Net Present
Value (NPV) associated with each scenario. Although the NPV is positive for many projects, the cumulative scenario-
level NPV represents a cost to the County. Depending on the pathway the County takes, investment costs will range
from $2,500,000 - $4,500,000 per year through 2030, with larger investments for large-scale building systems
required between 2030-2040. Cost savings from those investments will yield between $230,000-$1,600,000 per
year, mostly from decreased vehicle fuel use and increased energy efficiency in County buildings. The County will
need to update cost estimates every two years to account for changes in markets, incentives, inflation,
interest rates, salaries, and other factors.
The investments in many projects will become more costly the longer they are delayed. It will require a commitment from
the County to invest up front to realize the GHG reduction benefits that these projects will bring long term. The more
investment the County makes up front, the less GHG reductions will need to be invested in over time. Therefore, the
County has an opportunity to lead by example and take the necessary steps to use 100% clean energy in all its operations
by 2050.

Implementing the REP will also necessitate hiring more staff and providing additional training for existing staff. Managing
the projects requires a dedicated staff person. The additional workload and new technical expertise needed for the new
systems will likely also require new maintenance staff and training for existing staff.

                                                                                                  benefits      summary | 64
                                                                                                           and outcomes
                                                                                                     executive
DURHAM COUNTY
                         RENEWABLE ENERGY
                              PLAN

BASELINE & ENERGY FORECAST
An energy baseline represents the amount of energy (electricity, natural gas, gasoline and diesel) in a baseline year (in this
case 2019), and an energy forecast provides a projection of the amount and sources of energy the County would most
likely consume through 2050. The baseline and forecast serve as reference points for reduction targets and inform the
strategy and action selection process. Figure B outlines an energy forecast considering the County continues to rely solely
on the current mix of energy sources. This is referred to as a business-as-usual (BAU) scenario.

The current BAU includes all County owned buildings, fleet vehicles, and energy use at the wastewater treatment facility.
Durham County has taken this data and forecasted future energy and fuel use using assumptions based on long-term
averages, projections of renewable energy available on the grid, and the County’s planned capital investments. Durham
County also calculated escalation rates for energy and fuel pricing, degradation factors of critical buildings systems, and
other relevant factors. Future baseline updates can demonstrate progress toward the adopted strategies and assess
the effectiveness of County actions. Figure B also shows how, even as projected energy use remains flat, the County’s
greenhouse gas emissions reduce slightly over time as the grid’s renewable energy content improves. The increase in
energy use and emissions in 2020-2024 represents new load growth as the County adds a small number of new buildings.

British thermal units (Btu) are units of energy equivalent to the amount of heat required to increase the temperature of
one pound of water by one degree. By measuring energy use in Btu, it is possible to combine energy from energy, natural
gas, and vehicle use into one common metric. kBtu is equivalent to 1,000 Btu.

                                                                                                                   phase 1 | 8
Figure B: BAU Energy Use and Emissions (2020-2050)

Figure C shows what the County’s renewable energy percentage would be in a BAU scenario. The blue bars along the
bottom of the graph represent the projected increase in renewable energy available on the grid. If the County does
nothing, the County’s renewable energy (RE) % would be approximately 8% in 2030 and 18% in 2050. The grid RE
percentage was based on projections in Duke Energy’s 2020 Climate Report. This forecast has the utility providing 14%
RE by 2030 and 36% by 2050. Additional projections of RE available from the grid were modeled based on reports
provided by Duke Energy and Duke University, and ranged from 7%-19% in 2030 to 10%-45% in 2050. Ultimately the RE
% representing the middle path was
chosen.

The transition to renewable energy
is a major strategy to meet Durham
County’s climate mitigation goals. In
2007, Durham was the first community
in North Carolina to develop a
Greenhouse Gas Emissions Reduction
Plan, committing to reduce GHG
emissions 50% by 2030 from the
2005 baseline year in government
operations. (It should be noted that,
given the poor quality of data sets
available from 2005 - 2008, the
County uses 2009 as its baseline year.)
As of 2020, Durham County is 15%
toward its goal as shown in Figure D
below. In order to reach the goal in the     Figure C: Renewable Energy Percentage under a BAU approach (2020-2050)
next 9 years, Durham County will need
to reduce approximately 940 MTCO2
annually. Switching to renewable resources and increasing energy efficiency are necessary to achieve the remaining
emissions reductions and have been factored into the REP planning process. Under a BAU scenario, the County’s GHG
emissions would be 17,474 in 2030, 20% short of its goal.

                                                                                                            phase 1 | 9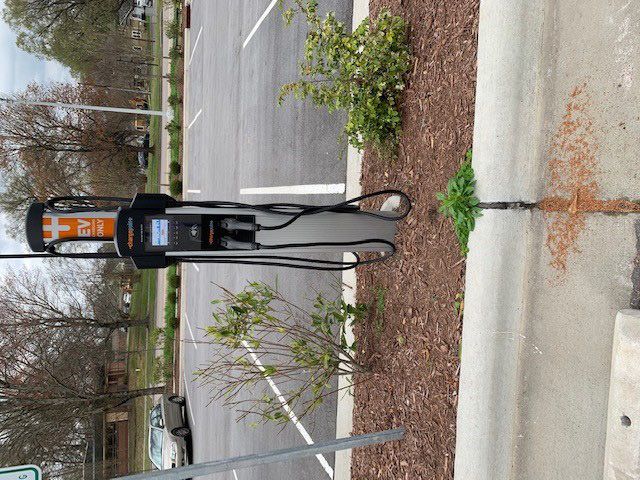
Figure D: Progress toward 100% renewable and 50% GHG
                                                                                  reductions by 2030 from the 2009 baseline

FRAMING THE GAP ANALYSIS
As part of this process, the County reviewed current policies and programs and produced a comprehensive, annotated
list of high-impact strategies that could be analyzed and prioritized based on feasibility, financial considerations, health
benefits, and equity. In addition, many opportunities and barriers were considered as part of this process.

One key consideration that could accelerate the implementation of the REP is the timing of Duke Energy’s Renewable
Energy and Efficiency standard compliance. Under this law, investor-owned utilities in North Carolina are required to
meet up to 12.5% of their energy needs through renewable energy resources or energy efficiency measures by 2020
and 36% by 2050. According to Duke Energy’s 2019 Sustainability Report, the utility provided 6.45% renewable energy,
generated by solar, wind, and hydroelectric sources. This same report forecasts 90% fossil and nuclear electricity sources
by 2030 which are not considered renewable. The primary gap analysis took into consideration the difference between
current renewable energy provided by Duke Energy and the amount of renewable electricity generation needed to meet
the County’s goal. Recently, Duke Energy set goals for its entire company to be carbon neutral by 2050, which is more
aggressive than the law requires. It should be noted that the County’s ability to achieve 100% renewable energy by 2050
is heavily influenced by Duke Energy’s decisions about increasing renewable energy as part of its generation mix.

other renewable energy actions in North carolina
In 2018, North Carolina’s Governor Roy Cooper signed Executive Order No. 80 calling for a 40 percent reduction in
statewide greenhouse gas emissions and at least 80,000 zero-emission vehicles by 2025. As part of this commitment,
the state set a course to transition away from fossil fuel usage to a more clean and renewable energy economy. As a result
of Executive Order 80, the state created a Clean Energy Plan and NC Energy Regulatory Process Report that include
many policy options for transforming the electricity sector to encourage more renewables, energy efficiency, and cost
effectiveness. The impact of these reports depends on the legislature and Public Utilities Commission’s willingness to
adopt laws, regulations, policies, and budgets to enable this transition

key findings:
•   Buildings represent the largest component of County energy and emissions
•   Powering buildings on clean electricity is one of the most cost-effective ways to reduce emissions
•   Adopting clean vehicle technology will have a major impact on reducing transportation emissions
•   Regulatory and market barriers will need to be addressed
•   Without further action, Durham County will not meet internal renewable energy or greenhouse gas reduction goals
    and is not aligned with statewide goals or scientific consensus on avoiding the worst impacts of climate change.

                                                                                                                  phase 2 | 10
STRATEGIES & CONSIDERATIONS
APPROACH POLICY STRATEGIES CONSIDERATIONS
Policy Green building Adopt requirements for EV charging installations Are there ways to promote
policy Durham County as a leader in the
Target net zero emissions in all facilities state?
Fleet purchasing
policy Eliminate natural gas use in all facilities What other local governments
are adopting similar policies?
Disaster planning Right size the fleet so vehicles are used more efficiently
policy and therefore replaced more frequently, allowing for Durham County has committed
faster adoption of electric vehicles to reducing greenhouse gas
emissions in operations 50% by
Transition to electric or hybrid vehicles 2030
Consider renewable diesel as an option for vehicles that
do not have an electric alternative such as ambulances
and other heavy equipment
Focus on energy resiliency
Operations Resolution to Install rooftop solar How many projects can the
commit to 100% County implement each year
renewable energy Improve Building Energy Management Systems given the allocation of staff and
funding?
Increase energy efficiency in buildings and waste water
treatment What are the trade-offs to
investing more money upfront
versus phasing projects over a
longer period of time?
What role do renewable energy
credits play in helping the County
reach its goal and what type of
credits should be considered?
Utility Renewable Energy Work with Duke Energy and other stakeholders to What can the County do to
Infrastructure & Efficiency increase renewable energy generation in the grid mix encourage more renewable
Renewable Portfolio energy in the generation mix?
Standard
Financial & Adopt new Create an internal Green Revolving Fund How can the County align the
Funding approaches to budget to the plan?
financing Participate in Duke Energy’s Green Source Advantage
program
Consider Pilot Projects
Consider Bulk Procurement Strategies
Align Capital Improvement Plan budget
Access third party financing
Build Public Private Partnerships
strategies & considerations | 11SUMMARY OF SCENARIOS
The Phased scenario includes 2 rooftop solar investments each year and the Accelerated scenario includes 4 per year.
Projects with roof or HVAC replacements already planned for those buildings are scheduled for the year of replacement.
Refer again to Figure A. In each scenario, it is assumed that Duke Energy will provide 14% renewable energy to the County
by 2030 and 36% by 2050. In the event that this does not occur, Durham County can adjust scenarios to compensate for
the lower percentage.
The primary difference between scenarios is when investment occurs, how long the benefits accrue, how
much staff time is needed to implement measures beyond current levels, and the rate of return on investments.
Implementing projects earlier in the process reduces overall greenhouse gas emissions, accelerates return on
investment for projects with savings, and accrues other benefits like improved air quality sooner, but requires
more staff time and funding earlier in the process.
PHASED INVESTMENT
The Phased Investment represents the timeline if the County were to follow its existing replacement schedule for boilers
and fleet vehicles, as well as two rounds of bulk solar procurement, one in 2023 and one in 2025. See the Bulk Solar
section below for more information on bulk solar procurement. This scenario also includes participation in Duke’s
Green Source Advantage (GSA) program starting in 2023.
Figure E: Renewable Energy Percentage under the Phased Investment Approach (2020-2050)
Outlined in Figure E, the Phased Investment scenario would help the County reach 53% renewable energy by 2030, and
72% renewable energy by 2050. This would leave the County 47% short of its 2030 goal and 29% short of its 2050 goal,
meaning the County would need to make up the remaining difference by purchasing RECs.
Under this scenario, by 2030 approximately 40% of the County’s energy would come through the Green Source
Advantage program, 32% would come from natural gas, 20% from grid-purchased electricity, and a small percentage from
on-site solar and gasoline purchases.
phase 3 | 12As outlined in Figure F, the Phased
Investment scenario would help the
County greatly reduce its greenhouse
gas emissions. Under this scenario, the
County’s GHG levels would be reduced
66% from 2009 levels by 2030. In
this scenario, the majority of emission
reductions would come from renewable
energy projects, followed by fleet
projects and building electrification
projects. Costs through 2030 would be
an estimated $1 million to $3 million per
year and $90,000 to $70 million per year
through 2044. After that, there is a
projected savings of approximately $1
million per year until 2050.Cummulative
GHG reductions would be 77,310
MTCO2e by 2030 and 335,016
MTCO2e through 2050.
Figure F: Scenario GHG emissions under a Phased Approach
ACCELERATED INVESTMENT
The Accelerated Investment scenario essentially doubles the pace of investment, with two heat pump projects per year
being implemented, an accelerated fleet replacement schedule, and similar to the Phased Investment scenario, two
rounds of bulk solar procurements in 2023 and 2025.
As Figure G below shows, the Accelerated scenario would help the County reach 61% renewable energy by 2030 and,
similar to the Phased scenario, 72% renewable energy by 2050. As in the Phased scenario, the County would be left to
make up the remaining 2030 and 2050 renewable energy gaps through the purchase of RECs. Both the Phased and
Accelerated scenarios are also highly influenced by the renewable content of electricity purchased from the grid, meaning
advocacy by local and regional stakeholders will play a critical role in helping the County reach its goals.
Under this scenario, gasoline and diesel are phased out more quickly. Natural gas also makes up a small portion of the
County’s energy use in this scenario (20% compared to 32% for Phased Investment) due to the more rapid
implementation of heat pump projects.
Figure G: Renewable Energy Percentage under the Accelerated Investment Approach (2020-2050)
PHASE 3 | 13Similar to the Phased Investment scenario,
the Accelerated Investment scenario
achieves deep reductions in greenhouse
gasses emitted by County operations as
outlined in Figure H. Under this scenario,
the County’s GHG levels would be
reduced 77% from 2009 levels by 2030.
As in the Phased scenario, the majority of
emission reductions come from renewable
energy projects, followed by fleet projects
and building electrification projects.
Investments would range from $1.7 million
to $4.8 million per year through 2030 and
$2.4 to $7 million through 2050 with
several years of net savings projected for
the later years. Cummulative GHG
reductions would be 88,488 MTCO2e
through 2030 and 349,290 MTC02e
through 2050.
Figure H: Scenario GHG emissions under an Accelerated Investment approach
By pushing up the timeline of building, (2020-2050)
renewable energy, and fleet investments,
the County can get about 16% closer to its
2030 target. One of the advantages of the
Accelerated scenario over the Phased
scenario is that it leaves less uncertainty in
terms of technological, policy, and market
factors and places more of the County’s
renewable energy percentage in its own
hands. The total GHG reduction is larger
(14,274 MTCO2e are reduced in the
Accelerated scenario compared to the
Phased scenario) because starting projects
earlier allows for reductions to accumulate
over more time.
The Figure I below shows the extra gains
that can be made through accelerated
investment, as well as the point around
2038 when the scenarios converge as all
projects have been implemented.
Figure I: Renewable energy percentages under Phased and Accelerated Investment
scenarios (only the upper line is displayed in places where scenarios overlap)
PHASE 3 | 14HIGH IMPACT SOLAR INVESTMENT
The High Impact Solar Investment
scenario is the same as the Accelerated
scenario, but includes one of four
optional approaches (in addition
to GSA) to catalyze off-site solar
development in support of the County’s
goals. The potential approaches
include, executing a Virtual Power
Purchase Agreement (VPPA), launching
a procurement effort for local RECs,
developing County land with solar
projects via the Sell-All tariff or
participating in a Community Solar
program. All of these approaches
face significant challenges to viability,
making it necessary for the County to Figure J: Renewable energy percentages under Phased Investment, Accelerated
Investment, and High Impact Solar Investment scenarios (only the upper line is
monitor statewide policy and market
displayed in places where scenarios overlap)
developments to determine the best
pathway in the mid-term. A VPPA is a financial contract enabling the County to directly support and receive RECs from a
solar project outside of North Carolina. Procurement of local RECs refers to a novel program launched by the County in
which the County buys RECs from commercial solar projects within its borders. Sell-All solar projects entail development
of a large-scale solar project by an outside developer who sells the energy but passes the environmental credits (RECs)
onto the County, thereby increasing the County’s renewable energy percentage. Potential Sell-All projects include 3,500
kW of solar at the County Stadium parking lots, and up to 15,091 kW at the County landfill. Finally, Community Solar entails
participating in the NC Shared Solar program, or equivalent, run by Duke Energy. For a more detailed description of
potential off-site solar development approaches, barriers and challenges, see the following section (Phase 3, Part 2).
Figure J shows that, with the addition of one of the off-site solar projects described above, the County can meet or exceed
its 80% by 2030 and 100% by 2050 goals. However, there are currently regulatory barriers impacting this approach,
including caps on system size and contract length.
In this scenario, if the County develops the entire potential at the County landfill, the County, starting in 2030, would be
generating more RECs than are required to offset non-renewable electricity from the grid.
Investments would range from $1.7 to $5 million through 2030 and $1 to $8 million through 2050. Cumulative GHG
emissions would be 97,672 MTCO2e through 2030 and 534,519 MTCO2e through 2050.
Tracking Renewable Energy
Renewable Energy Credits (RECs) are used throughout the country to track the environmental attributes of renewable
energy. RECs are most commonly related to renewable electricity, although their application may be expanding to
include biogas. Generally, one REC is created for each megawatt hour (MWh) of renewable electricity that is generated.
Depending on the organization of a given renewable energy project, the ownership of those RECs will transfer to the
project owner or to the entity buying the electricity. Once created, RECs are tracked through various regional databases.
In North Carolina, RECs are registered and tracked through the North Carolina Renewable Energy Tracking System (NC-
RETS).
After RECs are registered, they can then be sold to a new owner or “retired” by a certain entity to prove compliance with a
renewable energy goal or policy. Increasingly, RECs have been used by organizations beyond utilities (private companies,
local governments) as a means to track progress towards and back-up claims of achieving renewable energy goals . In
cases where non-renewable energy is not being directly replaced by energy from a renewable source, Durham County
can use RECs to track the amount of renewable energy generated off-site, determine if it is sufficient to offset remaining
non-renewable energy and, if it owns those RECs, retire them each year to back-up any claims made by the County that
they are using a certain percentage of renewable energy.
PHASE 3 | 15It is important to acknowledge that not all RECs are created equally. To understand this, it is necessary to understand the
concept of additionality. In the context of renewable energy, additionality describes a situation where an organization’s
investment led to new renewable generation being added to the grid. When considering compliance with a renewable
energy goal, RECs created from a project that has additionality are preferred because additionality means that those
RECs are associated with new renewable electricity. Technically, an organization could purchase RECs generated from an
existing renewable energy project located anywhere in the country and claim compliance with a renewable energy goal.
However, since those RECs came from a project lacking additionality the impact of achieving that renewable energy goal
on reducing carbon emissions can be called into question. When approaching the role of RECs in meeting its renewable
energy goals, Durham County prioritized strategies that would create additional RECs and sought to avoid relying on the
purchase of existing RECs.
SUMMARY OF INDIVIDUAL STRATEGIES FOR IMPLEMENTATION
Specific details for each strategy allows the County to follow a concrete time frame for strategy completion driven by the
feasibility and costs of each action within Durham County. Strategies are designed to align with other County planning
documents such as the Local Government Operations Climate Action Plan and the Strategic Plan.
Within each scenario, strategies were first ranked based on Net Present Value and the highest percentage of energy
content that can be transitioned away from fossil fuels. A secondary review assigned social and environmental co-benefits
to each strategy; the most prominent co-benefits are outlined in Figure K.
As the market shifts away from fossil fuels toward 100% renewable energy, it is empowering local jurisdictions to create
actionable steps that will lead to cleaner air and a more resilient future. This shift also accelerates new technology and
holds utilities accountable for complying with state renewable portfolio standards. By transitioning to renewables, Durham
County has more control over its emissions and can use this REP process to ignite interest and influence behavior change
throughout the region.
SYMBOL
CO-BENEFIT High potential to Equity High potential to High potential to
save money create jobs improve public
health
EXAMPLE Energy Efficiency Vendor Workforce Clean Air
Public Private Solicitations Development
Partnerships
Figure K: Co-Benefits
The County has identified three objectives that will help the County reach its renewable energy goal: (1) improve building
performance, (2) increase renewable energy generation and (3) increase vehicle fleet efficiency. A careful analysis was
conducted and challenges and strategies were considered in order to frame each objective. An objective is defined as an
end result or target that provides a broad framework for the County to work within. From these objectives, strategies are
then defined as specific actions that will lead to greenhouse gas emissions reductions and renewable energy adoption.
PHASE 3 | 16OBJECTIVE 1: IMPROVE BUILDING PERFORMANCE
Reducing total energy use is a key tenant of Durham County’s ability to reach its renewable energy goals. Because the
majority of the County’s energy use occurs in buildings (electric and natural gas), improving the performance of those
buildings through energy efficiency and building electrification is an important objective required to achieve the County’s
goal. It is easier to create renewable electricity than renewable natural gas, therefore, building electrification has the dual
impact of reducing energy use and enabling the transition of energy end uses such as heat and hot water to renewable
sources.
While the REP does not include an assessment of energy efficiency projects, the County plans to continue identifying and
implementing energy efficiency improvements in existing buildings, specifically targeting a long-term reduction in energy
use of 20%. Efficiency improvements are a proven and cost-effective method to capture financial benefits and reduce the
overall energy load needing to be replaced with renewables. The County has a long history of successful energy efficiency
projects. Using its existing processes, the County has identified multiple LED lighting retrofits that, when implemented,
will likely result in the County achieving the 20% target, enabling any additional opportunities identified to exceed the
goal. The County plans to continue its process of systematic review of existing buildings to identify any remaining energy
efficiency projects and future opportunities that may arise. See specific strategy descriptions in Appendix A.
STRATEGY STRATEGY ACTION BENEFITS METRIC TIMELINE LEAD ACTOR
No.
1A Reduce overall Complete LED lighting Decrease in Short term General Services
energy use by 20% upgrades for 50% of EUI per square
by 2040 through County building square foot Sustainability
continuous energy footage by 2025 and all Office
efficiency upgrades facilities by 2030.
to lighting and Utilities Division
building systems. Create and implement
(This would be ad- a Strategic Energy
ditional to the 61% Action Plan to guide
expected savings in increased energy effi-
energy by installing ciency upgrades.
heat pumps.)
Integrate new energy
efficient equipment and
reduction measures
for the wastewater
treatment and collec-
tion system to reduce
energy use 10% below
2009 values.
1B Build all new Update High EUI per square Short term Project
buildings and Performance Building foot Management
retrofits to higher Policy to include Division
standards renewable generation,
higher efficiency, and
electrification
1C Develop a Green Identify the department Annual dollars Short term Budget
Revolving Fund that would manage the saved
budget Finance
Establish accounting
principles
PHASE 3 | 171D Continue server Pilot new Building % increase in Short term Information and
virtualization where Energy Management energy reduc- Technology
feasible (BEMS) software tion Services
1E Target net zero Install heat pumps in % of renewable Mid Term Information and
emissions in all 26 County owned energy Technology
facilities buildings compared with Services
overall County
Follow the useage Engineering and
implementation Environmental
schedule outlined in Services
the CESA tool
Eliminate all natural
gas as buildings
are retrofitted or
constructed each year
1F Consider Solar Research IRS’s Energy- % of renewable Long Term Information and
thermal heat pumps Efficient Commercial energy Technology
in County owned Buildings Tax compared with Services
buildings as they Deduction and other overall County
become cost- incentives useage
effective
strategic impact METRICS
Percentage Contribution To 100% Renewable Electricity By 2050 Phased Investment: 11%
Accelerated Investment: 11%
High Impact Solar Investment: 22%
Cost Effectiveness of Policy in Dollars Spent per therm reduced Phased Investment: 0.47 therms/$
Accelerated Investment: 0.45 therms/$
High Impact Solar Investment: 0.45 therms/$
Emissions Reduction Potential through 2050 (MtCO2e) Phased Investment: 12,791
Accelerated Investment: 16,452
High Impact Solar Investment: 16,452
PHASE 3 | 18OBJECTIVE 2: INCREASE RENEWABLE ENERGY GENERATION
Within the REP planning process, Durham County explored multiple avenues to increase renewable electricity
generation. Given the County’s priority of directly offsetting use of non-renewable energy, the first avenue assessed was
the feasibility of installing on-site, net-metered solar photovoltaic (PV) systems. However, there are multiple physical and
policy constraints that limit the realistic developable potential of on-site solar. Theoretically, about 35,500 MWh of solar
generation would be needed to meet the County’s projected electrical usage in 2050 with 100% renewable energy
generated on-site. The results of this analysis indicate that, even in a scenario where the maximum viable potential of
5.6 MW (7,500 MWh annually) of on-site, behind-the-meter solar is developed, renewable generation beyond County
facilities will be needed to meet the County’s goal. Due to these constraints, the analysis also explored development
pathways for off-site renewable energy projects, specifically several options for utility-scale and commercial solar projects
from which Durham County could receive credit for the renewable electricity generated. See specific strategy
descriptions in Appendix A.
STRATEGY STRATEGY ACTION BENEFITS METRIC TIMELINE LEAD ACTOR
No.
2A Participate in Duke Release a RFP for Percentage of Short Term Sustainability
Energy’s Green Services, select a renewable energy Office
Source Advantage project, sign compared with
program agreements overall County
usage
Approve budget
Number of local
jobs
2B Install On-Site roof- Complete detail Percentage of Mid Term Sustainability
top and carport solar assessment of all renewable energy Office
projects on 32 County sites iden- compared with
County-owned tified in this plan in overall County General
facilities order to finalize site usage Services
designs and group
sites by feasibility. Number of local
jobs
Pursue a bulk pur-
chasing agreement
for all County solar
projects and release
RFP for Phase 1
procurement of most
feasible sites
Approve chosen
vendor and budget
Repeat process as
needed for future
Phases
PHASE 3 | 192C Pursue most feasible Review updates Percentage of Mid-to-long Engineering &
off-site solar develop- to North Carolina renewable energy term Environmental
ment pathway (see renewable energy compared with Services
Appendix A) depend- policies and markets, overall County
ing on policy and as well as County usage
market changes resources, to deter-
mine best pathway Number of local
jobs
Conduct community
outreach
Conduct industry out-
reach (RFI) to deter-
mine vendor interest
and likelihood of
identifying a private
partner, depending
on chosen pathway
Proceed with chosen
pathway
2D Pursue floating Percentage of Short term Engineering &
Conduct
solar PV at the renewable Environmental
assessment
Triangle Waste energy Services
Water Treatment Issue RFP compared with
Plant overall County
Select vendor usage
Install system
strategic impact metrics
Percentage Contribution To 100% Renewable Electricity By 2050 Phased Investment: 38%
Accelerated Investment: 38%
High Impact Solar Investment: 64%
Cost Effectiveness of Policy in Dollars Spent per kWh produced Phased Investment: 4,940 kWh/$
Accelerated Investment: 4,940 kWh/$
High Impact Solar Investment: 8,473 kWh/$
Emissions Reduction Potential through 2050 (MtCO2e) Phased Investment: 257,029
Aggressive Investment: 261,401
High Impact Solar Investment: 446,639
PHASE 3 | 20OBJECTIVE 3: INCREASE VEHICLE FLEET EFFICIENCY & FUEL SWITCHING
Durham County has the opportunity to reduce its gasoline and diesel consumption and reduce GHG emissions by
investing in electric or hybrid vehicles. Currently, the fleet makes up 23.6% of the County’s overall energy mix by using
over 400,000 gallons of fuel annually. The analysis of transitioning the County’s fleet to renewable energy covered three
main strategies; (1) streamlining fleet management and operations, (2) fleet electrification and (3) switching to renewable
diesel.
To support all of these strategies, it is important to synchronize the management of the County fleet so that fleet purchases
can be completed in a manner that meets staff and operational needs while being cost-effective and transitioning to a
fully decarbonized fleet. Synchronizing fleet management by improving the breadth and depth of vehicle data collected
provides the opportunity for the County to fully consider important vehicle purchasing factors such as the total cost of
ownership for an alternative fuel vehicle, whether to buy or lease and whether the vehicle in question even needs to be
replaced or whether it can be retired. See specific strategy descriptions in Appendix A.
STRATEGY STRATEGY ACTION BENEFITS METRIC TIMELINE LEAD ACTOR
No.
3A Right size and right Implement a motor pool Annual VMT per vehicle Mid Term General
type the fleet Services
Integrate telemetrics Parking spaces occupied
and idle-reduction by fleet vehicles
technology into fleet
Money saved
3B Transition the fleet Set reduction goals for MTCO2e/year reduced Mid Term General
to electric and each County depart- Services
hybrid vehicles ment Number of hybrid and
electric vehicles pur- Sustainability
Replace between 1-44 chased per year Office
fleet passenger vehicles Percent of fleet that is
(non-sheriff) with hybrid hybrid and EV
or electric vehicles per Increased MPG
year through 2036 Increased fuel savings
Savings in fleet mainte-
Implement energy effi- nance
cient vehicle purchasing
policy
Follow the replacement
scheduled outlined in
the CESA tool
3C Increase the num- Align charging infra- Total # of County-owned Mid term Sustainability
ber of EV charging structure with vehicle EV charging stations Office
stations by be- parking areas
tween 8-55 ports
each year Follow the replacement
scheduled outlined in
the CESA tool
PHASE 3 | 213D Transition to renew- Research sources of Percentage of diesel fuel Mid Term General
able diesel for all renewable diesel purchased that is renew- Services
diesel fleet vehicles able diesel fuel
Work with other NC
fleets and the Clean Emissions reductions
Cities Coalitions to
increase supply in NC
strategic impact metrics
Percentage Contribution To 100% Renewable Electricity By 2050 Phased Investment: 20%
Accelerated Investment: 20%
High Impact Solar Investment: 20%
Cost Effectiveness of Policy in Dollars Spent per gallon reduced Phased Investment: Approx. $3.90/gallon
(combined gasoline and diesel gallons) Accelerated Investment: Approx. $2.82/
gallon
Emissions Reduction Potential through 2050 (MtCO2e) Phased Investment: Approx. 65,197
Accelerated Investment: Approx. 71,437
High Impact Solar Investment: 71,437
PHASE 3 | 22IMPLEMENTATION TIMELINE AND BUDGET
In order to meet the County’s renewable energy goals and balance County resources, REP strategies will be implemented
through a phased approach. This timeline maps proposed strategy design and implementation periods through 2050,
in a manner consistent with achieving the goals set forth by Durham County’s Board of Commissioners. As Figure M
demonstrates, the County will need to periodically reassess its progress beginning in 2025. Areas the County will
reassess include off-site solar development options (GSA participation, Sell-All, Community Solar, Virtual Power Purchase
Agreement and Local REC Purchase Program) the feasibility of renewable generation projects, the renewable percentage
available from grid-purchased electricity, availability of EV models and renewable diesel, and technology and market
maturities.
Figure M: REP Timeline
Target Metrics
While the County’s renewable energy targets may seem far away, it will require sustained effort to achieve them. Interim
target metrics can make it easier to stay on course, and can allow for course corrections over time. Target metrics can also
provide transparency and improve monitoring of the REP. To support the County’s path to 80% renewable energy by 2030
and 100% by 2050, the following interim targets are recommended.
PHASE 4 | 23Table C: Targets matrix
The County will update these metrics as the technologies included in this plan, like solar PV panels and electric vehicles,
improve, and as emerging technologies like biofuels become more feasible. As these metrics are updated, the County will
report out on progress to key stakeholders and the larger community.
Funding
In order to fund building electrification projects, Durham County’s first recourse should be to target projects through their
existing capital improvement budget. Heat pump systems could be bundled with projects in other buildings or even in
the same building, and can be done in phases (see Vancouver example, page 17) to spread out the capital required. The
County or its contractors should take advantage of Duke Energy’s Smart $aver Business rebates for heat pumps and the
IRS’s Energy-Efficient Commercial Buildings Tax Deduction and other incentives to the greatest extent possible.
The County could establish a Green Revolving Fund (GRF), which is an internal fund that provides financing to implement
energy efficiency and renewable energy projects that generate cost savings. These savings are tracked and used to
replenish the fund for the next round of investments, thus establishing a sustainable funding cycle while cutting operating
costs and reducing environmental impact. Another use of these funds would be to cover expected increases in operating
budget resulting in participating in the GSA program.
For on-site solar projects, a bulk procurement process is recommended to align all 32 solar projects under a small number
of contracts. Given the variation in site feasibility, the County would likely complete multiple phases of bulk procurement.
Generally, this approach would provide economies of scale savings across the portfolio of projects and enable a larger
number of sites to be developed by pairing projects that have quicker paybacks with projects that have slower paybacks
in order to create a cost-effective portfolio of sites. All 32 on-site solar projects identified in this REP will be located on
County owned facilities, providing the County direct control over financing. It is also recommended that the County look
for other public agencies to partner with, such as the City of Durham and Durham Public Schools, to further reduce costs
by including additional sites where on-site solar projects are cost-effective . This collaborative procurement model proved
successful in Buncombe County, NC, offering them the equivalent to a 0% interest loan and a reduced price per kW.
Financial Calculations
Financial calculations are performed within CESA by accounting for a number of costs and cost savings. A summary of cost
and savings considerations for each strategy area is listed below.
Building Projects:
• Costs of installing heat pumps
• Financing payments (if any)
PHASE 4 | 24• Costs from additional electricity use
• Cost savings from avoided natural gas purchases
Renewable Energy Projects:
• Costs of installing solar panels
• Financing payments (if any)
• O&M costs
• Cost savings from avoided grid electricity purchases
Fleet Projects:
• Marginal costs of EV purchases (as compared to fossil fuel alternatives)
• Costs of electric vehicle charging infrastructure
• Costs from additional electricity use from EV charging
• Additional (marginal) cost of renewable diesel fuel
• Cost savings from avoided gasoline and diesel purchases
• Operation & Maintenance (O&M) savings
While marginal costs were used to calculate Net Present Value (NPV) for fleet projects, this calculation was not possible
for heat pump projects. Therefore, when factoring costs of HVAC equipment into the County’s decision-making process,
the actual financial considerations may be more Table D: Financial results
favorable than presented here. Rooftop solar
projects have no marginal cost considerations because they are not replacing another type of equipment.
Net Present Value (NPV) is the value in present-day dollars of a series of cash flows over a period of time, and is a common
metric to evaluate different investments. By using NPV to evaluate different options, the County can determine the most
cost-effective pathway to achieving its renewable energy targets.
Budget
Table D displays the NPV for the two core scenarios and three supplementary scenarios. The NPVs are further broken
down by strategy area (Buildings, Renewable Energy, and Fleet). Some takeaways from this analysis are that (1) the NPV
and the County’s progress towards its RE goals are heavily influenced by the timing of investments, (2) fleet projects are
generally revenue-positive, and (3) many on-site solar projects are cost-effective. As explained in the Financial Calculations
section, costs for fleet projects are calculated using the marginal cost of electric vehicles compared to fossil fuel vehicles,
whereas renewable energy projects and heat pump projects were calculated using base implementation costs.
Table D: Financial results
Near-term Actions Budget
In order to align with the County’s ongoing budget process, the Near-Term Actions Budgets presented in Figures N-P
outline the additional budget needs required to complete REP implementation through 2050. Under this scenario, it’s
assumed that capital purchases fall between July-Dec of 2022 to align with the County’s fiscal year schedule. Note that
these implementation costs do not include ongoing personnel costs to perform routine operations and maintenance
activities.
It should also be noted that this investment would replace at least one planned HVAC project the County would already
do, meaning the marginal cost to the County would be less than presented here. The fiscal year 2024 budget request of
approximately $3.4 million for the Accelerated Investment scenario represents approximately 6% of the FY 2023-24
capital budget. The following charts display annual implementation costs, as well as renewable energy percentages and
PHASE 4 | 25greenhouse gas emissions for each of the three scenarios. The left-hand axes represent the value of yearly investments,
and the right-hand axes represent percentages for both renewable energy used by the County and greenhouse gases
as a percentage of baseline emissions.
Figure N represents the costs and
benefits associated with the Phased
Investment scenario. Under this
scenario, the County would reach
54% renewable energy in 2030 and
72% in 2050, leaving the County to
make up the difference Greenhouse
gas levels would achieve a 70%
reduction from baseline levels by
2030. The years with the largest
capital investments would be 2038
($6.7 million), 2041 ($6.7 million),
and 2042 ($7.4 million). For all
scenarios, the largest capital outlays
are associated with large-scale
heat pump projects. Although not
known at this time, the marginal
cost of heat pumps compared to
standard HVAC system replacement Figure N: Phased Investment
should be taken into consideration in capital budgeting decisions. scenario results
Figure O represents the costs and benefits associated with the Accelerated Investment
scenario. Under this scenario, the County would reach 62% renewable energy in 2030
and 72% in 2050, again leaving the County to make up the difference through purchasing
RECs. Greenhouse gas levels would achieve a 76% reduction from baseline levels by
2030. The years with the largest
capital investments would be 2030
($9.7 million), 2041 ($6.7 million),
and 2042 ($7.4 million).
Figure P represents the costs and
benefits associated with the High
Impact Solar Investment scenario.
Under this scenario, the County
would reach 100% renewable
energy in 2030 and remain
at 100% in 2050. The County
would eliminate all greenhouse
gas emissions (either directly or
through retirement of RECs) by
2030. As with the Accelerated
Investment scenario, the years with
Figure O: Accelerated Investment scenario results
PHASE 4 | 26the largest capital investments
would be 2030 ($9.7 million),
2041 ($6.7 million), and 2042
($7.4 million).
Figure P: Aggressive + Sell-All scenario results
phase 4 | 27You can also read