REMOTE SENSING CONCEPTS AND APPLICATIONS - RAJESH BAHADUR THAPA, PHD REMOTE SENSING & GEOINFORMATION SPECIALIST ...
←
→
Page content transcription
If your browser does not render page correctly, please read the page content below
Remote Sensing
Rajesh Bahadur Thapa, PhD                            Concepts and
                                                      Applications
Remote Sensing & Geoinformation Specialist
Rajesh.Thapa@icimod.org
https://www.icimod.org/team/rajesh-bahadur-thapa/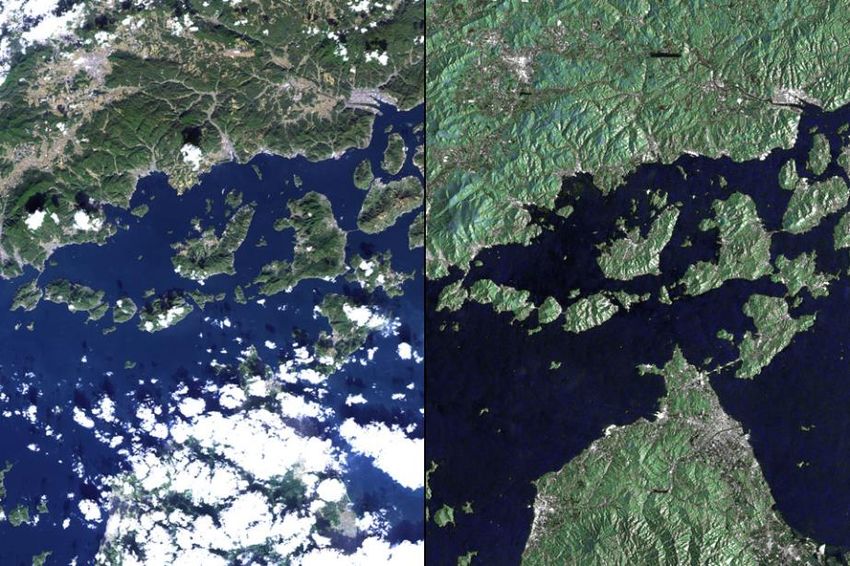
BIO Presenter
    Dr. Thapa works at ICIMOD and leads the Group on Land Use Land
    Cover Change and Ecosystem Services, Geospatial Solutions and the
    Capacity Development Programme of SERVIR-HKH (NASA-USAID)
    Initiative, MENRIS Regional Programme. His researches focus on
    monitoring and assessment of terrestrial environments including forest,
    agriculture, urban, and disaster thematic areas. He empowers people to
    use emerging Earth observation and geospatial technologies for
    making evidence-based decisions to protect the pulse of the planet.

    He is an active member of Group on Earth Observations (GEO)
    Capacity Development Working Group and has 25+ years of work
    experience across various Asian countries including Japan, Thailand,
    and the HKH region. Prior to joining ICIMOD, he served at the Japan
    Aerospace Exploration Agency (JAXA). He was also a visiting professor
    at the University of Tsukuba, Japan. He holds a PhD in                      Dr. Rajesh B. Thapa
    Geoenvironmental Science, MSc in Remote Sensing and GIS, and                      ICIMOD
    Master Degree in Geography. Recently, SERVIR Global recognized his
                                                                              Email: rajesh.thapa@icimod.org
    remarkable contributions and unwavering commitment to capacity
    development for connecting space to village mission and awarded
    prestigious SERVIR Award of Excellence 2019.
    https://www.icimod.org/team/rajesh-bahadur-thapa/

2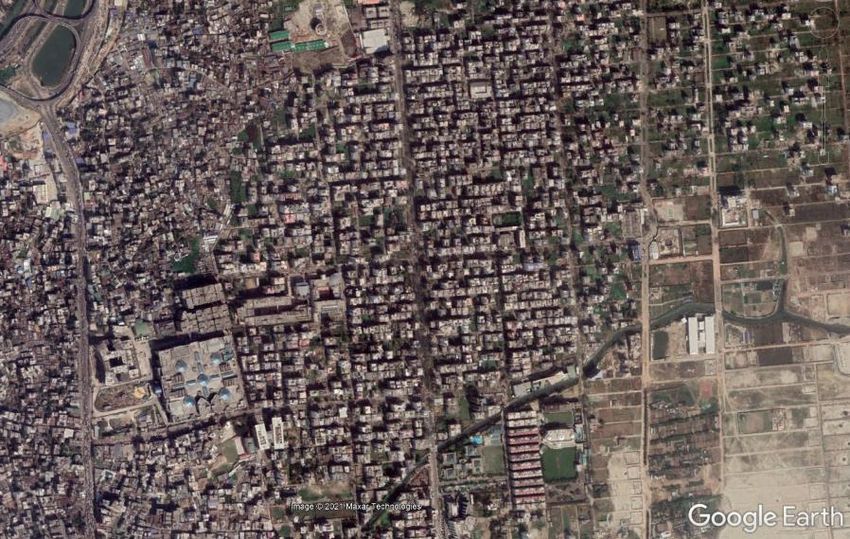
Remote
    Sensing
    Concepts

3
Remote Sensing Concepts   • Remote sensing is the science for
                                collecting and interpreting
                                information on targets (objects or
                                areas) without being in physical
                                contact with them.
                              • It employs electromagnetic energy
                                in the form of radio waves, light,
                                and heat as a means of detecting
                                and measuring target
                                characteristics.
                              • Remote sensing gathers information
                                about the Earth from a distance,
     ©2017 RBT
                                usually from aircraft or satellites
4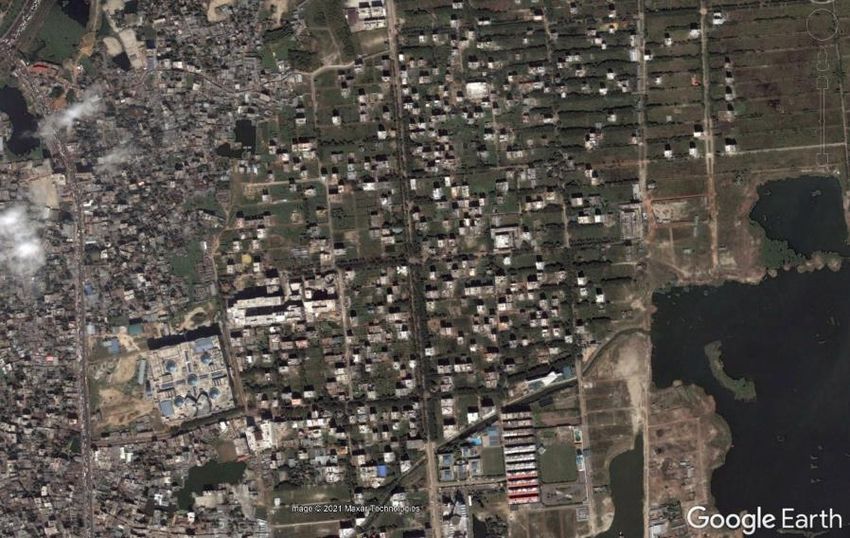
Remote Sensing Platforms

       Ground-based            Aerial-based   Satellite-based

5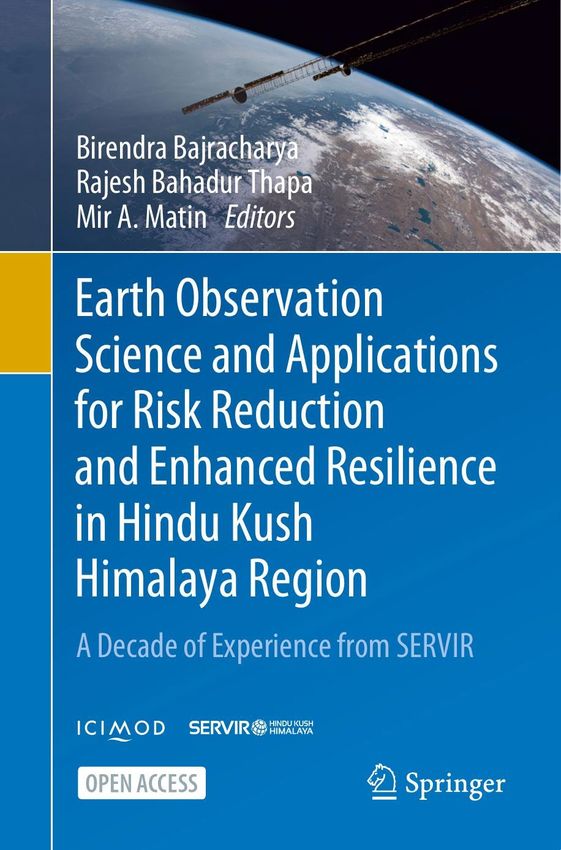
Components of Remote Sensing
    • Energy source: Sun, irradiance from earth’s materials which is used in
       passive remote sensing; RADAR, irradiance from artificially-generated
       energy sources, which is used in active remote sensing)
    • Platforms: The vehicle which carries a sensor, i.e., balloon, aircraft,
       space shuttle, satellite, international space station, etc.
    • Sensors: Device that receives electromagnetic radiation and converts it
       into a signal that can be recorded and displayed as either numerical
       data or an image (camera, scanner, radar, etc.).
    • Processing: Handling remotely sensed signal data, i.e., photographic,
       digital, etc.
    • Institutionalization: Organization for executing at all stages of
       remote-sensing technology to connect space to village.

6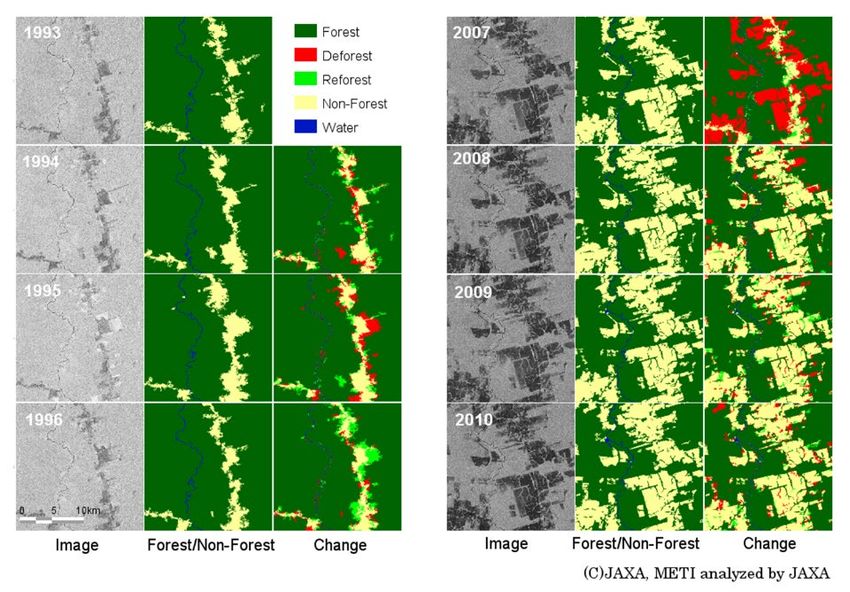
Remote Sensing Work-flow

                               A. Energy source
                               B. Radiation and the
                                  atmosphere
                               C. Interaction with the
                                  target
                               D. Recording of energy
                                  by the sensor
                               E. Transmission,
                                  reception, and
                                  processing
                               F. Interpretation and
                                  analysis
                               G. Applications

7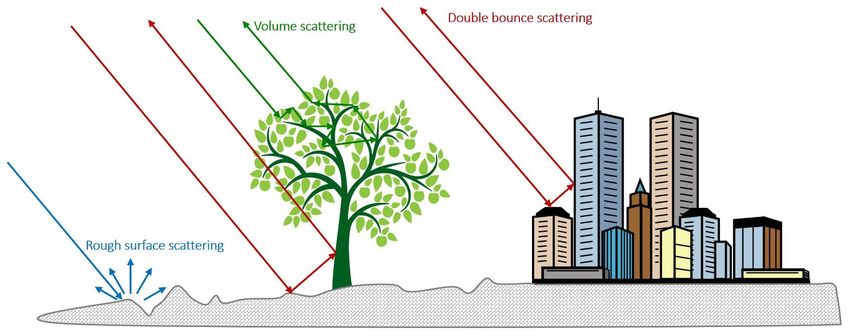
Basics of RS System:
    PASSIVE/ACTIVE
    Passive satellite/sensors (OPTICAL):
    Sentinel-2, ALOS AVNIR-2, PRISM;
    Landsat Series; AVHRR, Spot, MODIS,
    IKONOS, Quickbird, Worldview, etc.

    Active satellite/sensors (RADAR):
    Sentinel-1, ALOS PALSAR, ALOS-2,
    RADARSAT, TanDEM-X, TerraSAR-X, etc.

    There are also some airborne sensor, such as
    PiSAR, PiSAR-L2, LiDAR, etc. Recently UAVs
    based small sensors are also getting popular

    Satellite: 300~36000 km; Airborne: ~12 km

8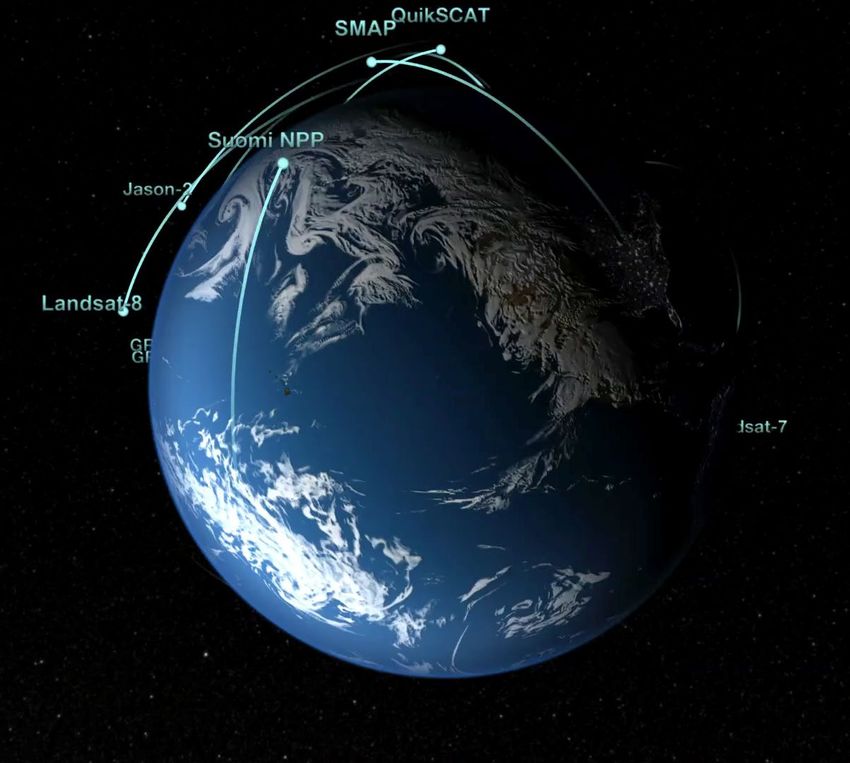
Optical vs                  ALOS AVNIR-2: optical, passive   ALOS PALSAR: radar, active

 Radar: same
 satellite, time
 & location
 but different
 sensors

JAXA –Advanced Land
Observing Satellite (ALOS)

 9
Optical vs Radar: Optical
     Optical remote sensing makes use of visible, near infrared and short-wave infrared sensors to form images of the
     earth's surface by detecting the solar radiation reflected from targets on the ground. Different materials reflect
     and absorb differently at different wavelengths. Thus, the targets can be differentiated by their spectral
     reflectance signatures in the remotely sensed images. Optical systems are nadir looking!

     • Panchromatic imaging system: this is a single channel detector sensitive to radiation within a broad
       wavelength range. If the wavelength range coincide with the visible range, then the resulting image resembles
       a "black-and-white" photograph taken from space.

     • Multispectral imaging system: this is a multichannel detector. Each channel is sensitive to radiation within a
       narrow wavelength band. The resulting image is a multilayer image which contains both the brightness and
       spectral (colour) information of the targets being observed.

     • Hyperspectral imaging systems: This acquires images in about a hundred or more contiguous spectral bands.
       The precise spectral information contained in a hyperspectral image enables better characterisation and
       identification of targets.

10
Optical vs Radar: Radar
Radio detection and ranging (radar) refers to a technique as well as an instrument.
The radar instrument emits electromagnetic pulses in the radio and microwave regime and detects the
reflections of these pulses from objects in its line of sight.
The radar technique uses the two-way travel time of the pulse to determine the range to the detected
object and its backscatter intensity to infer physical quantities such as size or surface roughness.
Unlike optical, radar systems consists of all-weather and all-day capabilities allowing regular mapping
of areas affected by heavy cloud cover, persistent rain, or extended darkness.
Radar systems are side looking! The signals interact differently with the surface than most other
sensing systems, providing interesting new information about the observed environment.
11Electromagnetic Radiation
ER consists of Electrical field (E)
Energy from any sources comes in the form of electromagnetic and Magnetic field (M), travel
radiation at the speed of light (C).
Wavelength and Frequency.
The wavelength is the length
of one wave cycle, which can
be measured as the distance
(in m, cm, mm, and nm)
between successive wave
crests.
Frequency refers to the
number of cycles of a wave
passing a fixed point per unit
of time. Frequency is normally
measured in hertz (Hz),
equivalent to one cycle per
second, and various multiples
of hertz. These two are
inversely related to each
other. The shorter the
12 wavelength, the higher the
frequency and vice-verse.Electromagnetic Spectrum
From very short Gamma rays to very long radio waves
Passive - optical Active - microwave
Gamma X-rays Ultraviolet Visible Infrared Microwave Radio-wave
10-14 10-12 10-8 10-6 10-4 10-2 1 l in meter
400 500 600 700 l in nanometer
©2017 Gauri
Blue (400 – 500), Green (500 – 600) and Red (600 – 700) bands
13Spectral Properties of
Objects
©2008 Ko Ko Lwin
TM B1: High reflectance in water TM B4: High reflectance in vegetation TM B7: High reflectance in bare soil
14Types of Remote Sensing Images
Polar orbit (sun-
synchronous), earth
resources satellites,
Landsat, SPOT, ALOS,
IKONOS, QuickBird, etc.
Geostationary orbit, directly
over equator at very high
altitudes and revolves in the
same direction that the earth
rotates (west to east), used in
metrological, communication
and broadcasting applications
(e.g., GEOS, Meteosat, EDUSAT,
GALAXY-27, KALPANA-1, etc.).
15Types of Information from Remote Sensing…
Field sensor, UAV,
Airplane,
Satellite …
Satellite Sensors:
Optical,
RADAR, MWR,
LiDAR etc.
16Nadir vs Oblique Viewing
Swath Width or
Field of View
17Nadir vs Oblique Viewing
Nadir Low Oblique High Oblique
18Characteristics of Remotely Sensed Imagery
Remote sensing systems differ in the level of detail or resolution they can capture, and
data are available at a variety of resolutions, we will cover four types of satellite resolution:
1) Spectral Resolution – refers to the degree to which a satellite sensor can distinguish or
resolve features of the electromagnetic spectrum
2) Radiometric Resolution – refers to the number of quantized bits that are used for
recording the reflected electromagnetic energy.
3) Spatial Resolution – refers to the number of pixels utilized in construction of a digital
image. Images having higher spatial resolution are composed of a greater number of
pixels than those of lower resolution.
4) Temporal Resolution – refers to the frequency of a measurement with respect to time.
Often there is a trade-off between temporal and spatial resolution.
19Spectral Resolution 20
Radiometric Resolution
                                         The radiometric resolution of
                                         image data in remote sensing
                                         stands for the ability of the
                                         sensor to distinguish different
                                         grey-scale values. It is measured
                                         in bit. The more bit an image has,
                                         the more grey-scale values can
                                         be stored, and, thus, more
                                         differences in the reflection on
                                         the land surfaces can be spotted.

                                         A bit is a binary number that is 0

                              © GESAAF
                                         or 1. For computer processing,
                                         the byte unit (1 byte = 8bits;
                                         covers integer value between 0-
21                                       255; or 256 grey levels)
Spatial Resolution
Landsat 8, 2017
Kabul Airport
30m
World View – 2, 2009
0.5 m
©2017 Gauri
22Spatial Resolution
Satellite Resolution Satellite Resolution
GeoEye 0.41m ALOS 2.5m~100m
Worldview 1, 2 0.46m ALOS 2 3m~100m
Pleiades-1A 0.5m Sentinel 1 5m~100m
Quickbird 0.61m Sentinel 2 10m~60m
Ikonos 0.82m ASTER 15m
SPOT 5, 6 1.5 – 5 m LANDSAT 15m~60m
Rapid Eye 5m MODIS 250~1000m
PC: Thapa 25.12.2018
Faisal Masjid, Google Earth Imagery, 18.06.2019
23Temporal Resolution
The temporal resolution specifies the revisiting frequency of a satellite sensor for
a specific location. High temporal resolution: < 24hours – 3days
Medium temporal resolution: 4-16 days
Low temporal resolution: > 16 days
2000
2007
Settlement bubbles in Manohara (Thapa et al. 2008. City Profile: Kathmandu)
24Temporal
Resolution -
Forest change in
Para, Amazon
(Radar Data:
JERS-1,
ALOS/PALSAR)
Forest monitoring!
Can any one
articulate, what did
you see in 2007?
25Spectral Bands Commonly Used in Remote Sensing
Spectral bands (µm) Applications
Blue (0.45 – 0.52) analysis of water characteristics, water depth, and the detection of subsurface features
Green (0.52 – 0.60) water quality studies measuring sediment and chlorophyll concentration
Red (0.63 – 0.69) discriminating vegetation types, assessing plant condition, delineating soil and geologic
boundaries, and identifying cultural features
Panchromatic (0.50 – digitally combined with two or three of the multispectral bands to produce color images with
0.90) spatial detail of the panchromatic image and the spectral detail of the multispectral bands
Near Infrared (0.7 – 1.0) useful for vegetation mapping, crop condition monitoring, biomass estimation, and soil moisture
assessment
Shortwave Infrared (1.0 – useful for analyzing moisture levels in soil and for monitoring plant vigor and crop condition,
3.0) distinguishing clouds from snow and ice
Medium wave (3.0 - 8) useful to measure the temperature of features such as industrial sites, pipelines carrying heated
and Long Wave Infrared materials, geothermal sites, and thermal pollution, also useful for the analysis of vegetation
(8 – 14) stress, soil moisture, and geology
Microwave region (radar) useful for mapping of vegetation structure and biomass, flooding, geological sites, etc.
26Spectrum of Microwave Region
Passive - optical Active - microwave
Gamma X-rays Ultraviolet Visible Infrared Microwave Radio-wave
10-14 10-12 10-8 10-6 10-4 10-2 1 l in meter
Frequency in GHz
Wavelength in meter
©2017 Gauri
The microwave region of the spectrum is quite large, relative to the visible and infrared, and there are several wavelength ranges
from 0.1cm to 100cm (300GHz to 0.3GHz in frequency) with unique code band. Microwaves with longer wavelengths than Ka-band
(7.5mm) are generally used as radar. Currently, X-band, C-band, and L-band are in operation in Earth observation satellites, i.e.,
TerraSAR-X, Sentinel-1, ALOS-2, respectively
27Spectrum of Microwave Region
Source: The SAR Handbook
2019
28Advantages of Microwave Signals
This figure provides a conceptual
overview of the influence of sensor
wavelength λ on signal penetration
into a variety of surface types. The
radar signals penetrate deeper as
sensor wavelength increases. This
is related to the dependence of the
dielectric constant εr on the
incident wavelength, allowing for
higher penetration at L-band than
at C- or X-band.
29Effects of Different Bands in Surface Penetration 30
Effects of Different Bands in Surface Penetration

31
Observation Geometry of Imaging Radars
                                                                 Side-looking geometry

                  height

                                                                 The figure is a schematic diagram of a
                                                                 radar observation geometry where a
                                                                 platform is moving along a straight path
          Nadir                                                  at altitude H. Unlike most optical
                                                                 imaging systems, which point their
                                                                 sensors towards nadir, the antenna of
                                                                 imaging radar is pointed away from
                                                                 nadir by a look angle.

                           Adapted from: Lee and Pottier, 2009

32
Synthetic Aperture Radar (SAR)
A radar antenna (indicated by a gray
rectangle) of reasonably short length is
moving at a velocity V along its flight
path from the right to the left. While
moving, it is constantly transmitting
short radar pulses and is receiving
echoes returned from objects on the
ground. Each radar pulse illuminates an
instantaneous footprint of size S on the
Earth surface.
SAR is an active sensor transmitting a microwave
signal towards a target and receive a reflection
(F. Meyer, The SAR Handbook)
called backscatter
33How Imaging Radar Works? Azimuth
Identify the
Range
directions for
Azimuth and
Range
Tips:
Imaging radars are
side-looking!
34SAR Image Processing Flow
Range Range Range
Azimuth
Azimuth
Azimuth
SAR image is
constructed from the
many pulses reflected
by each single target
and received by the
antenna and registered
at all position along the
flight path. Then image
processing algorithm
SAR Image performs range and
azimuth compressions
Raw Data After Range Compression After Azimuth Compression to create 2-D SAR
image
©EORC
Power
Power
Power
Rang Rang Rang
e e e
35Radar Polarizations
HH HV VH VV
Adapted from ESA
Most radars are designed to transmit microwave radiation either horizontally
polarized (H) or vertically polarized (V)
36Polarizations and Applications
HH is sensitive to
flooded forest, logged
with trunks remaining,
mangrove degradation
while HV is sensitive
to forest/non-forest
contrast, vegetation
structure, and
biomass.
HH polarization (left) and HV
37 polarization (right). Image source: ALOS
PALSARPolarizations and Applications
HH 2007 (28 June 2007) HH 2008 (15 Aug 2008) R: 2007 GB: 2008 WWF, 2006, 2007
Depending on the
Forest
None
transmitting and
Forest receiving
Deforested
polarizations, the
radiation interacts
with object and get
HV 2007 (28 June 2007) HV 2008 (15 Aug 2008) R: 2007 GB: 2008 backscatters
differently. Both
Forest change easily wavelength and
identifiable in HV than in
HH polarization! polarization affect
how a radar images
the surface
17 km Change detection - impact of polarization
38Scattering Mechanisms
• Three main scattering mechanisms dominate:
– Surface scattering: Water, bare soils, roads – scattering strongly dependent on
surface roughness and sensor wavelength
– Double-bounce scattering: Buildings, tree trunks, light poles – little wavelength dependence
– Volume Scattering: Vegetation; dry soils with high penetration – strongly dependent
on sensor wavelength and dielectric properties of medium • At Radar wavelength,
scattering is very
physical and can be
described as a series of
bounces on scattering
interfaces
39Distortions
Source: The SAR Handbook
2019
40Distortions – Geometric
Main geometric distortions on SAR images with their dependence on acquisition
geometry.
Source: The SAR Handbook
2019
(Chapter 2. F. Meyer)
41Distortions – Geometric Azimuth
Foreshortening occurs when the radar beam
reaches the base of a tall feature tilted away
from the radar before it reaches the top. Small Shadow
incidence angle produces large influence from
this distortion. The foreshortened slopes
range
appear as bright features on the image.
Layover occurs when the radar beam reaches
the top of a tall feature before it reaches the
base. This effect on a radar image looks similar
to that due to the foreshortening. Small Foreshortening
Layover
incidence angle also produces large influence
from this distortion.
data © ESA
Shadow occurs when the radar beam is not ERS-1
able to illuminate the ground surface behind
tall features or slopes. Large incidence angle
produces large shadowed area.
42Distortions
Source: The SAR Handbook
2019
43Distortions
Source: The SAR Handbook
2019
44Distortions – Radiometric Speckle reduction
Original SAR Image Speckle Filtered
SAR data © AeroSensing GmbH
Bayesian Algorithm
45Distortions – Radiometric
• Noise caused “Speckle” which
is an inherent property of all
coherent imaging systems
• Technically, it looks noise but
it is not, it is an interference
pattern
(The SAR Handbook, Chapter 2. F. Meyer)
46Remote Sensing Applications
There are so many applications of remote sensing…
• Urban monitoring
• Water resources monitoring
• Weather and climate services
• Agriculture and food security
• Land use land cover, and ecosystem
• Disaster monitoring, emergency response, and management
• Topographic mapping
• Forest monitoring
• Measuring motion of the Earth's surface to understand earthquakes and volcanoes
and support emergency management efforts.
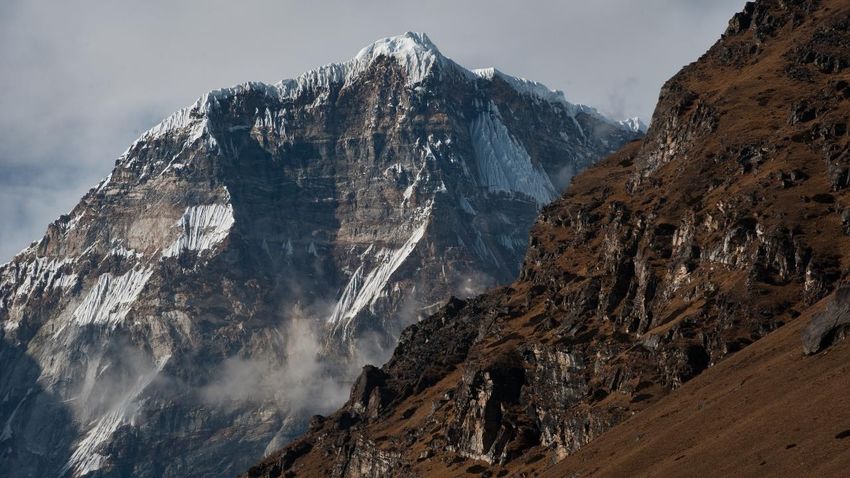
• Studying the movements and changing size of glaciers and icecaps to explain long-
term climate variability.
• Assessing geology, geophysical structure, and terrain for the likelihood of finding
oil, gas or other natural resources.
• Monitoring of oil spills, etc.
48Urban Monitoring (Sector G13, Islamabad)
2007.09.07 2008.05.05
8 Months
49 Google Earth ImageryUrban Monitoring (Sector G13, Islamabad)
2014.09.01 2020.04.22
6 Years 6 Years
50 Google Earth ImageryUrban Monitoring (Jamuna Future Park, Dhaka)
2001.03.21
51Urban Monitoring (Jamuna Future Park, Dhaka)
2008.06.11
7 Years
52Urban Monitoring (Jamuna Future Park, Dhaka)
2017.02.05
9 Years
53Urban Monitoring (Kathmandu – Boudha area)
CORONA Satellite
Imagery, 05.02.1967
54Urban Monitoring (Kathmandu – Boudha area)
24 Years
SPIN-2 Satellite
Imagery, 05.02.1991
55Urban Monitoring (Kathmandu – Boudha area)
19 Years
GeoEye Satellite
Imagery, 23.01.2010
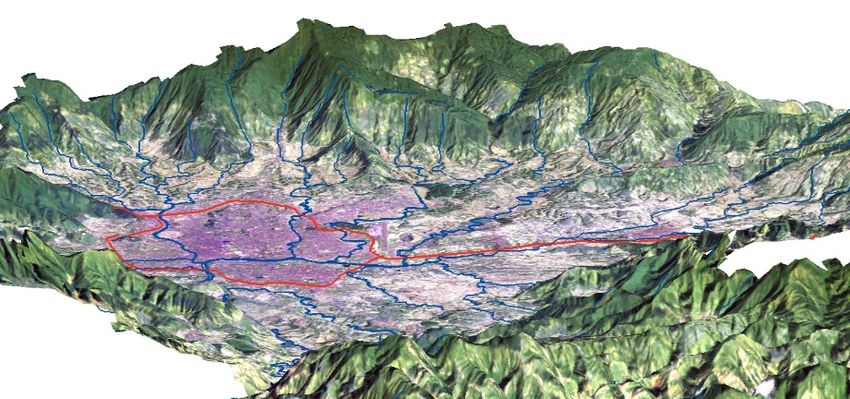
56Kathmandu - Land use/cover mapping, change monitoring, & modeling
Thapa et al. (2009),
Remote Sensing;
Thapa (2012), SPIE
Proceedings;
Thapa et al. (2012),
Landscape and Urban
Planning
57There are many applications …our recent book on applications…
SAR Handbook: Comprehensive Methodologies
for Forest Monitoring and Biomass Estimation
Editors: Africa F. Anderson, Kelsey E. Herndon, Rajesh B. Thapa, Emil Cherrington
▷ Freely-available eBook, interactive pdfs, and training
modules; result of a 2-year joint collaboration between
NASA SERVIR & SilvaCarbon
▷ Applied content, hands-on trainings to get started using
Synthetic Aperture Radar (SAR) for forest monitoring,
biomass estimation, mangrove extent, time-series analysis
▷ Authored by world-renowned SAR experts from the NISAR
Science Team, US Forest Service, academia
▷ Reviewed and tested by the SERVIR-Global network
▷ Downloadable open-source scripts and sample datasets Selected pages from Chp 6:
for a variety of forestry applications; useful for beginners Radar Remote Sensing of Mangrove
Forests (by Dr. Marc Simard, Sr.
to experts Scientist & mangrove specialist,
NASA Jet Propulsion Laboratory)
Download the SAR Handbook here: https://bit.ly/2UHZtaw
SAR Handbook training modules and more: https://bit.ly/2GeKvAN
For more information, visit the SERVIR website @ SERVIRglobal.net
58Many applications …our book, our region
https://lib.icimod.org/record/35312
Major highlights
• This open access book is a consolidation of lessons learnt and experiences
gathered in 19 chapters from its decade long efforts on applications of Earth
observation science and geospatial information technologies to address
regional and local needs in the Hindu Kush Himalayan region
• The book highlights SERVIR’s approaches to innovative applications in –
agriculture and food security; land cover and land use change, and
ecosystems; water resources and hydro-climatic disasters; and weather and
climate services.
• It offers a collection of multi-disciplinary topics with practically tested
applications in the region
• The book is a complete package of knowledge and learnings on project cycle
including service area planning, stakeholder consultation, user engagement,
capacity building, monitoring and evaluation, gender integration, and
communications.
eBook ISBN: 978-3-030-73569-2
DOI: 10.1007/978-3-030-73569-2
59Thank you
You can also read