Relationship between physical activity and cognitive functioning among older Indian adults - Nature
←
→
Page content transcription
If your browser does not render page correctly, please read the page content below
www.nature.com/scientificreports
OPEN Relationship between physical
activity and cognitive functioning
among older Indian adults
Manish Kumar , Shobhit Srivastava & T. Muhammad *
In a culturally different and low-resource setting, where lifestyle habits, including dietary pattern
and physical activities differ from those in high-income countries, the association between physical
activity and cognition is expected to differ. We aimed to investigate the association between physical
activity and cognitive functioning after controlling for potential confounders among older adults
in India. Furthermore, gender differences in this relationship were analyzed. Using a national-level
data from the Longitudinal Ageing Study in India (2017–2018), this paper employed propensity score
matching (PSM) approach to examine the association between physical activities and cognitive
functioning among Indian older adults. Cognitive impairment was measured through five broad
domains (memory, orientation, arithmetic function, executive function, and object naming). We
limit our sample to older adults aged 60 + years, and our final dataset contains 31,464 participants
(men = 16,366, and women = 15,098). The results indicated that older adults who engaged in frequent
physical activity have greater cognitive functioning than older adults without physical activity after
adjusting for various individual, health, lifestyle, and household factors. This association holds true
for both older men and older women. The results from the PSM revealed that the cognitive function
score was increased by 0.98 and 1.32 points for the frequently physically active older men and women
population, respectively. The results demonstrate the possible beneficial effects of frequent physical
activity on cognitive functioning among older adults. Thus, regular physical activity can be considered
as an effective lifestyle factor to promote healthy cognitive aging.
Cognitive functioning usually refers to different mental abilities, including thinking, learning, language, reason-
ing, attention and concentration, and visuospatial f unctioning1. Several theoretical and empirical studies have
reported that cognitive functioning declines with age and the older population is prone to cognition-related
issues (i.e., cognitive impairment)2,3. With the rapid increase in the aging population, the increase in age-related
cognitive decline and dementia, including Alzheimer’s disease, has become a crucial health burden4. Worldwide,
nearly 47 million people living with dementia in 20155, and this figure is expected to increase to 132 million by
20506, and most of these demented people are expected to live in the Asian countries7. Notably, India, where
dementia is an emerging health issue, has nearly 5.3 million people living with dementia which is expected to
triple by 20508. Due to higher proportion of older population who suffers from poor mental health and cognitive
decline, India will face tremendous public health and socioeconomic c hallenges9. Moreover, cognitive disabilities
do not only affect the individual but also poses a major physical, emotional, and economic burden on the family,
health care providers, and s ociety10,11.
Pharmaceutical therapies related to dementia treatment are still under-developed. In the absence of a cure,
there is an urgent need to identify effective modifiable lifestyle-based strategies and protective factors for reducing
the potential risk of dementia. For example, Fratiglioni et al. identified three modifiable lifestyle factors that sig-
nificantly slow the cognitive decline and prevent dementia: cognitive leisure activity, socially integrated network,
and regular physical activity12. Multiple systematic reviews have reported that out of these lifestyle factors; regular
physical activity has the most protective effect against age-related cognitive d ecline13–16. A meta-analysis of 15
cohort studies based on individuals without dementia with a follow-up period of 1–12 years reported an inverse
association between physical activity and cognitive decline17. Moreover, several experimental and cross-sectional
studies reported that physical activity is associated with better cognitive f unctioning18–20. Physical activity exerts
importance in other areas of physical health; in particular, regular participation in physical activities could reduce
International Institute for Population Sciences, Mumbai, Maharashtra, India 400088. *email: muhammad.iips@
gmail.com
Scientific Reports | (2022) 12:2725 | https://doi.org/10.1038/s41598-022-06725-3 1
Vol.:(0123456789)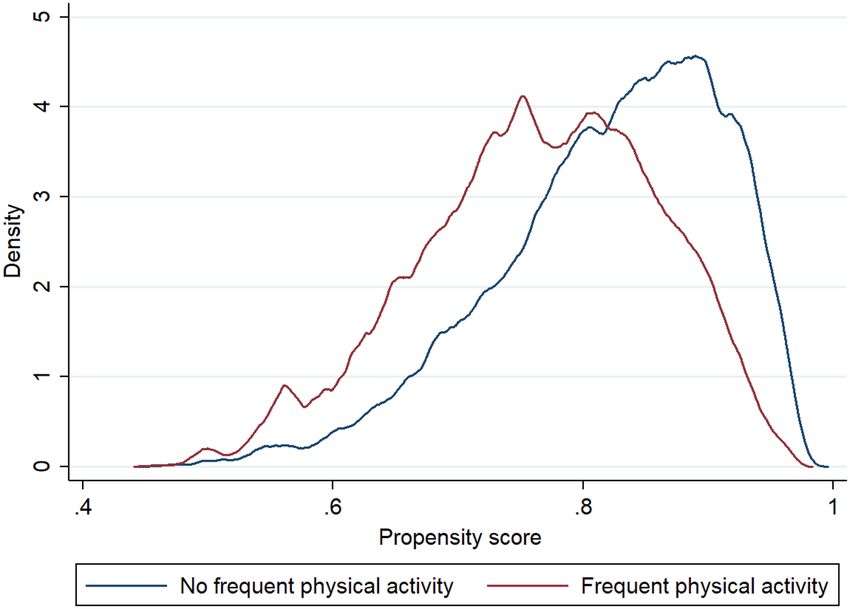
www.nature.com/scientificreports/
Individual factors
• Age
• Education
• Marital status
• Living arrangement
• Working status
• Social participation
• Obesity/overweight
• Alcohol consumption Cognitive functioning
• Tobacco consumption Physical activity • Memory
• Vigorous • Orientation
activities • Arithmetic function
Health-related factors • Executive function
• Depression • Object naming
• Self-rated health
• Difficulty in ADL
• Difficulty in IADL
• Multimorbidity
Household factors
• MPCE quintile
• Religion
• Caste
• Place of residence
• Region
Figure 1. Conceptual framework for cognitive functioning.
the risk of various chronic diseases, including stroke, coronary heart d isease21,22, depression23, and d
iabetes24,
which are well-recognized high-risk factors for cognitive impairment.
Despite well-established protective effects of physical activity against cognitive dysfunction, the existing
literature has shown inconsistent results25–27. The biological mechanism for the relationship between physical
activities and cognition is still unclear. However, there were some theoretical concepts on how physical activity
affects cognition, including modification of structural changes in the brain due to e xercises28,29, and hippocampal
neurogenesis and synaptic plasticity initiated due to physical activity, which stimulates the improvement in the
cognitive health30.
Notably, most of the studies examining the association between physical activity and cognitive functioning
have been conducted in western countries31,32; there is a scarcity of scientific knowledge regarding the health ben-
efits of physical activities on cognitive function in Indian older adults. In a culturally different and low-resource
setting, where lifestyle habits, including dietary pattern and physical activities differ from those in high-income
countries, the association between physical activity and cognition is expected to differ. One recent systematic
review conducted in India identified 19 peer-reviewed articles investigating the association of physical activity
with at least one mental health outcome, including depression, anxiety, psychosis, stress, self-esteem, and cogni-
tive functioning33. A recent study based in the state of Odisha in India aimed to examine the determinants of
the various mental health disorders, including anxiety, depression, and cognitive disorders, found that physical
activity was inversely associated with these d isorders34. In India, multiple sub-national-level studies generally
lack coherent definitions of cognitive functioning and physical a ctivities34. By investigating the role of physi-
cal activity in cognition, the present study will help policymakers generate a comprehensive policy framework
focused on reducing the risk of development of cognitive impairment, in light of physical activities, at the national
level. However, there is a lack of national-level studies dedicated to determine the association between physical
activity and cognition.
By filling this knowledge gap, we aimed to investigate the association between physical activity and cognitive
functioning after controlling for potential confounders among older adults aged 60 years and over using the
propensity score matching (PSM) based on the data from a large national-level Longitudinal Ageing Study in
India (LASI). In addition, considering the potential effect that gender differences pose on both cognition and
physical activity, gender differences in this relationship were analyzed. Based on the abovementioned background,
we developed a conceptual framework has been summarised in Fig. 1.
Methods
Data. The present study is based on the first wave of the Longitudinal Aging Study in India (LASI) conducted
during 2017–201835. LASI is a national representative longitudinal survey of middle-and older-aged Indians
(i.e., aged 45 years or older) and their spouses who reside in the same households, irrespective of age. The LASI
provides rich information on demographics, morbidity, health behavior factors, and physical health of the aging
population in India35. The LASI survey adopted a multistage stratified area probability cluster sampling design.
It is a nationally representative survey of 72,250 adults aged 45 and above across all states and union territories
of India. LASI is envisioned to be conducted every two years for the next 25 y ears35.
Scientific Reports | (2022) 12:2725 | https://doi.org/10.1038/s41598-022-06725-3 2
Vol:.(1234567890)www.nature.com/scientificreports/
The LASI survey is conceptually comparable to the United States Health and Retirement Study (HRS) and
other HRS-type surveys in various countries, including China (China Health and Retirement Longitudinal
Survey) and England (English Longitudinal Study of Ageing)35. Along with its uniqueness of comparability with
studies in other countries, LASI also considered features unique to India, including its institutional and cultural
characteristics. LASI is conducted through a partnership of the International Institute of Population Sciences
(IIPS), Harvard University, and the RAND C orporation35. The Indian Council of Medical Research (ICMR)
extended the necessary guidance and ethical approval for conducting the LASI. All the participants were provided
with information brochures explaining the purpose of the survey, ways of protecting their privacy, and the safety
of the health assessments. As per the ethics protocol, the consent forms were administered to each participant.
The LASI survey protocol utilizes state-of-the-art technology in sample management interviewing, Com-
puter-Assisted Personal Interviews (CAPI), and data processing. This protocol helps in releasing data faster
and ensures data quality through built-in checks in CAPI and real-time data monitoring with an automated
data quality control protocol. During the pilot survey conducted in 2010, LASI developed an automated quality
control protocol, building on the Sample Management Software (SMS) and CAPI technologies associated with
RAND’s information system, MMIC™ (Multimode Interviewing Capability). CAPI directly records the responses
of survey participants. This method requires field teams to be outfitted with laptop computers pre-loaded with
survey questions asked of respondents in a face-to-face interview. The field teams directly store the data into a
laptop computer, which minimizes the data recording and entry errors. The full-scale use of this protocol allows
the monitoring of fieldwork progress and checks the quality of collected information by examining data (e.g.,
for internal inconsistencies and missingness) at the level of interviewers and state fieldwork agencies. Since we
are interested in exploring the physical activity-cognitive health association among older individuals, we restrict
our attention to the subsample respondents aged 60 years or above. The present study dataset contains 31,464
respondents, 16,366 women, and 15,098 men.
Variable description. Outcome variable. Cognitive impairment was measured through five broad do-
mains (memory, orientation, arithmetic function, executive function, and object naming)35. Memory was meas-
ured using immediate word recall, delayed word recall; orientation was measured using time and place measure,
arithmetic function was measured through backward counting, serial seven, and computation method; execu-
tive function was measured through paper folding and pentagon drawing method, and object naming was lastly
done to measure the cognitive impairment among older adults. A composite score of 0–43 was computed using
the domain-wise measure35.
Treatment variable. Frequent vigorous physical activity status was coded as yes (every day) and no (more
than once a week, once a week, one to three times in a month and never). The question through which physical
activity was assessed was “How often do you take part in sports or vigorous activities, such as running or jogging,
swimming, going to a health centre or gym, cycling, or digging with a spade or shovel, heavy lifting, chopping,
farm work, fast bicycling, cycling with loads”?35. The vigorous physical activity questions were used among older
adults in previous studies in India and other countries36–38.
Explanatory variables. Aged was coded as young old (60–69 years), old-old (70–79 years) and oldest
old (80 + years). Educational status was coded as no education/primary not completed, primary, secondary and
higher. Marital status was coded as currently married, widowed and others. Others included divorced/separated/
never married. Living arrangement was coded as living alone, living with spouse, living with children and oth-
ers. Working status was coded as never worked, currently working, currently not working and retired. Social
participation was coded as no and yes. Respondents were said to be socially engaged if they participate in the
following activities. Eat out of house (Restaurant/Hotel); Go to park/beach for relaxing/entertainment; Play
cards or indoor games; Play out door games/sports/exercise/jog/yoga; Visit relatives/friends; Attend cultural
performances/shows/Cinema; Attend religious functions /events such as bhajan/satsang/prayer; Attend politi-
cal/community/organization group meetings; Read books/newspapers/magazines; Watch television/listen radio
and use a computer for e-mail/net surfing etc. If the respondent was involved in any of the above activity, then
the respondent was defined to be socially engaged. Obesity/overweight were coded as no and yes. The respond-
ents with body mass index (BMI) more than 25 was coded as obese/overweight. Alcohol and tobacco consump-
tion was coded as no and yes.
The probable major depression among the older adults with symptoms of dysphoria, calculated using the
CIDI-SF (Short Form Composite International Diagnostic Interview) score of 3 or m ore39. This scale estimates
a probable psychiatric diagnosis of major depression and has been validated in field settings and widely used
in population-based health surveys. The lowest 10th percentile is used as a proxy measure of severe depression
among older adults35,40,41. Self-rated health was coded as good which includes excellent, very good, and good
whereas poor includes fair and poor. Difficulty in ADL (Activities of Daily Living) was coded as no and yes.
Activities of Daily Living (ADL) is a term used to refer to normal daily self-care activities (such as movement in
bed, changing position from sitting to standing, feeding, bathing, dressing, grooming, personal hygiene, etc.).
The ability or inability to perform ADLs is used to assess a person’s functional state, particularly for persons with
impairments and those who are o lder42. If the respondent reported any difficulty in above ADLs, then difficulty
in ADL was coded as yes otherwise no. Difficulty in IADL (Instrumental Activities of Daily Living) was coded as
no and yes. Instrumental activities of daily living that are not necessarily related to the fundamental functioning
of a person, but they let an individual live independently in a community. These tasks are necessary for inde-
pendent functioning in the community. Respondents were asked if they were experiencing any difficulties that
were expected to last longer than three months, such as preparing a hot meal, shopping for groceries, making
Scientific Reports | (2022) 12:2725 | https://doi.org/10.1038/s41598-022-06725-3 3
Vol.:(0123456789)www.nature.com/scientificreports/
a phone call, taking medications, doing housework or gardening, managing money (such as paying bills and
laces43. If the respondent
keeping track of expenses), and trying to navigate or finding an address in unfamiliar p
reported any difficulty in above IADL’s then difficulty in IADL was coded as yes otherwise no. Morbidity status
was categorized as 0 “no morbidity”, 1 “any one morbid condition” and 2+ “co-morbidity”44.
Using household consumption data, the monthly per-capita consumption expenditure (MPCE) quintile
was determined. The sample households were canvassed using sets of 11 and 29 questions on food and non-
food expenses, respectively. Food spending was gathered over a seven-day reference period, whereas non-food
expenditure was collected over 30-day and 365-day reference periods. The 30-day reference period has been
used to standardise food and non-food expenses. The monthly per capita consumption expenditure (MPCE)
is calculated and used to summarise consumption35. The variable was then divided into five quintiles i.e., from
poorest to richest. Religion was coded as Hindu, Muslim, Christian, and Others. Caste was recoded as Scheduled
Tribe, Scheduled Caste, Other Backward Class, and others. The Scheduled Caste includes a group of the popula-
tion that is socially segregated and financially/economically by their low status as per Hindu caste hierarchy.
The Scheduled Tribes (STs) and Scheduled Castes (SCs) are among the most disadvantaged and discriminated
socio-economic groups in India. The OBC refers to persons who have been classified as "educationally, economi-
cally, and socially backward." The OBCs are considered lower castes in the old caste system, although they are
not untouchables. The “other” caste category is identified as having higher social status. Place of residence was
coded as rural and urban. The regions of India were coded as North, Central, East, Northeast, West, and South.
Statistical analysis. In the present study, we used propensity score matching (PSM) to assess the treatment
effects of physical activity on cognitive functioning. PSM is a statistical technique that minimizes selection bias,
mimics the experimental design with balanced baseline characteristics, and helps evaluate the treatment effects
for observation/cross-sectional data. It creates a comparison group that can address the counterfactual (defined
as what would be the outcome if the treatment did not occur). In PSM, various observed predictors are used
to create a propensity score that indicates each person’s probability to be included in the treatment group. This
score is then used to create a matched sample of treatment and control participants45. The propensity score is a
balancing score of the observed predictors, indicating that the covariates’ distribution is similar for the treatment
and comparison groups46. The individuals who were frequently physically active were assigned to the treatment
group and matched with the control group using a one-to-one matching method. The calculated propensity
scores were based on various individual and household-level characteristics, including age, educational status,
working status, marital status, living arrangement, social participation, overweight/obese, alcohol and tobacco
consumption, self-rated health, depression, difficulties in ADL and IADL, multi-morbidity, MPCE quintile, reli-
gion, caste, residence, and region.
We further calculated Average Treatment Effect on the Treated (ATT) that is defined as the average increase
in the cognitive functioning of those who were frequently physically active, as compared to those who were not
frequently physically active and had similar background characteristics (by matching)47. The Average Treatment
Effect on the Untreated (ATU) was calculated as the average increase in the cognitive functioning of those who
were not frequently physically active compared to those who were frequently physically active and had similar
background characteristics (by matching). For propensity score matching (PSM) analysis, we used the "psmatch2"
command in Stata (version 14.1)48. In addition, the model adequacy of PSM was assessed by the Mantel–Haenszel
sensitivity analysis. We used "mhbounds" command, a Stata program to check if the ATT estimate of a given
binary outcome was susceptible to a possible hidden bias caused by unobserved confounders. A Gamma value
of 1 means the ATT estimate was free of hidden b ias49.
We used multiple linear regression analysis to assess the associations between physical activeness and cogni-
tive functioning after adjusting for various individual and household factors. This analysis consists of two parts.
First, a linear regression model was built using the full sample (pre-matching). Second, after propensity score
matching analysis, a linear regression analysis was performed using a reduced (post-matching) sample contain-
ing only those cases included in the matches.
Ethics approval. The Central Ethics Committee on Human Research (CECHR) under the Indian Council
of Medical Research (ICMR) extended the necessary guidance, guidelines and ethics approval for conducting
the LASI survey. And all methods were carried out in accordance with those relevant guidelines and regulations.
Consent to participate. The survey agencies that conducted the field survey for the data collection have
collected prior informed consent (signed and oral) for both the interviews and biomarker tests from the eligible
respondents in accordance with Human Subjects Protection.
Results
Table 1 shows the socio-economic and demographic characteristics of the older adults (15,098 men and 16,366
women) included in the sample. The mean age of older males was 69.3 (CI 69.1–69.4) years whereas for older
females it was 69.1 (69.0–69.2) years. Around 24.6 percent of older men and 12.0 percent of older women were
frequently physically active. Women in the final sample were slightly younger than men. Compared to older
men, a higher proportion of older women were uneducated (81.4% vs. 53.1%). Around four-fifths of older men
(81%) and nearly two-fifth of older women (44.1%) were currently married. More than half of the older women
(54.0%) were widowed. Relatively, older women were more likely to live alone (8.5% vs. 2.5%) than older men.
Nearly 23.2 percent of older women and 15.5 percent of older men were overweight or obese. The alcohol (27.6%
vs. 2.6%) and tobacco (59.0% vs. 22.4%) consumption were comparatively higher in older men than in older
women. Regarding activities of daily living (ADL), women had greater difficulty with both basic ADL (26.5% vs.
Scientific Reports | (2022) 12:2725 | https://doi.org/10.1038/s41598-022-06725-3 4
Vol:.(1234567890)www.nature.com/scientificreports/
Male Female
Variables Mean CI Mean CI
Cognitive score 26.4 26.3–26.5 22.1 22.0–22.2
Age in years 69.3 69.1–69.4 69.1 69.0–69.2
Sample Percentage Sample Percentage
Frequent physical activity
No 11,392 75.5 14,400 88.0
Yes 3706 24.6 1966 12.0
Individual factors
Age
Young-old 8730 57.8 9678 59.1
Old-old 4702 31.1 4803 29.4
Oldest-old 1666 11.0 1886 11.5
Education
No education/primary not completed 8019 53.1 13,314 81.4
Primary 2235 14.8 1297 7.9
Secondary 3096 20.5 1297 7.9
Higher 1748 11.6 458 2.8
Marital status
Currently married 12,242 81.1 7211 44.1
Widowed 2489 16.5 8837 54.0
Others 366 2.4 318 2.0
Living arrangement
Living alone 380 2.5 1397 8.5
Living with spouse 3929 26.0 2485 15.2
Living with children and spouse 10,205 67.6 11,268 68.9
Living with others 583 3.9 1216 7.4
Working status
Never worked 575 3.8 7662 46.8
Currently working 6348 42.1 3088 18.9
Currently not working 6172 40.9 5311 32.5
Retired 1999 13.3 302 1.8
Social participation
No 1192 7.9 1722 10.5
Yes 13,906 92.1 14,644 89.5
Obesity/overweight
No 12,755 84.5 12,568 76.8
Yes 2343 15.5 3798 23.2
Alcohol consumption
No 10,939 72.5 15,943 97.4
Yes 4159 27.6 423 2.6
Tobacco consumption
No 6197 41.1 12,706 77.6
Yes 8901 59.0 3660 22.4
Health factors
Depression
No 14,006 92.8 14,818 90.5
Yes 1092 7.2 1548 9.5
Self-rated health
Good 8253 54.7 8335 50.9
Poor 6845 45.3 8031 49.1
Difficulty in ADL
No 11,788 78.1 12,022 73.5
Yes 3310 21.9 4344 26.5
Difficulty in IADL
No 9112 60.4 7047 43.1
Yes 5986 39.7 9319 56.9
Continued
Scientific Reports | (2022) 12:2725 | https://doi.org/10.1038/s41598-022-06725-3 5
Vol.:(0123456789)www.nature.com/scientificreports/
Sample Percentage Sample Percentage
Morbidity
0 7507 49.7 7274 44.5
1 4240 28.1 4928 30.1
2+ 3351 22.2 4164 25.4
Household factors
MPCE quintile
Poorest 3145 20.8 3681 22.5
Poorer 3219 21.3 3611 22.1
Middle 3262 21.6 3331 20.4
Richer 2902 19.2 3136 19.2
Richest 2570 17.0 2607 15.9
Religion
Hindu 12,386 82.0 13,484 82.4
Muslim 1769 11.7 1781 10.9
Christian 388 2.6 511 3.1
Others 555 3.7 590 3.6
Caste
Scheduled caste 2836 18.8 3113 19.0
Scheduled tribe 1166 7.7 1389 8.5
Other backward class 6925 45.9 7308 44.7
Others 4172 27.6 4556 27.8
Place of residence
Rural 10,879 72.1 11,322 69.2
Urban 4219 28.0 5044 30.8
Region
North 1863 12.3 2096 12.8
Central 3395 22.5 3202 19.6
East 3713 24.6 3729 22.8
Northeast 437 2.9 497 3.0
West 2457 16.3 2941 18.0
South 3233 21.4 3900 23.8
Total 15,098 100 16,366 100
Table 1. Socio-economic profile of the study respondents, 2017–18.
21.9%) and instrumental ADL (56.9% vs. 39.7%) compared to men. Older women had a comparatively higher
prevalence of depression (9.5% vs. 7.2%) and self-reported multi-morbidity (25.4% vs. 22.2%) than older men.
The percentage difference in the level of physical activity (frequent vs. not frequent) among older adults by
gender is presented in Table 2. Men who were aged 70–79 years (old-old), widowed, living alone, not working,
had poor self-rated health, difficulties in activities of daily living (ADL and IADL), and multi-morbidity were
less frequently physically active than their respective counterparts. A similar pattern was found for older women,
except for living arrangements where older women living with children and spouses were less frequently physi-
cally active than those living alone. According to household characteristics, the level of physical activity was
lower among urban residents and poor older adults. Table 3 shows the matching analysis results for the effect of
frequent physical activeness on cognitive functioning. The unmatched sample estimates for cognitive function-
ing among older men and women show that, on average, the cognitive function for those who were frequently
physically active was increased by 0.73 and 1.07 points, respectively, compared to those who were not frequently
physically active. The association between physical activeness and cognitive functioning was significant for older
men and older women in the matched sample. Among older men, the cognitive functioning on average was
increased by 0.75 points for those who were physically active than those who were not physically active but had
similar background characteristics. On the other hand, the cognitive functioning among older women who were
physically active was increased by 0.82 points than their counterparts with similar background characteristics.
The average treatment effect (ATE) estimates the average increase in cognitive functioning if the whole popu-
lation were physically active. The cognitive function was increased by 0.98 and 1.32 points for the frequently
physically active older men and older women population, respectively. Although physical activeness positively
affects cognitive functioning, the effect was slightly higher in older women than in older men. Average Treat-
ment Effect on the Untreated (ATU) results indicated that among those who were not physically active if they
were physically active, the average cognitive function was likely to increase by 1.06 and 1.39 points for older
men and older women respectively.
Scientific Reports | (2022) 12:2725 | https://doi.org/10.1038/s41598-022-06725-3 6
Vol:.(1234567890)www.nature.com/scientificreports/
Table 4 showed the adjusted regression coefficients for cognitive functioning by gender for unmatched and
matched (PSM) samples. In the unmatched sample, after adjusting for various individual, health, lifestyle, and
household factors, results suggest that physical activeness was significantly associated with greater cognitive
functioning for both older men (β = 0.73; 95% CI 0.51, 0.96) and older women (β = 1.09; 95% CI 0.77, 1.40).
Similar results were observed in the matched sample.
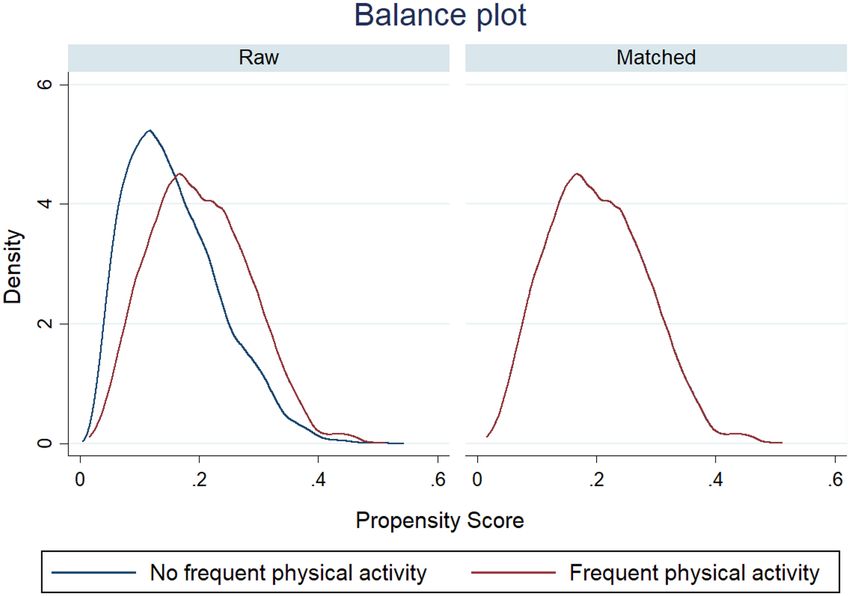
The balance plot is the kernel density plots of the covariates over treatment levels for raw and matched sam-
ples. The balance plot in Fig. 2 shows that both control and treatment groups were balanced. According to the
overlap assumption, each individual has a positive probability of receiving each treatment level. The overlap plot
in Fig. 3 depicts that neither too much probability mass near zero nor one and most of the masses for these two
estimated densities lie in regions where they overlap each other. Thus, we can conclude that there is no evidence
of a violation of the overlap assumption. In our analysis, satisfying covariate balance and overlap assumptions
indicate the unbiasedness in the estimated treatment effects.
Discussion
This study aimed to investigate the association of physical activity with cognitive functioning in older adults with
a gender lens by utilising the PSM method of estimating the impact of a specific intervention. To our knowledge,
this study was the first to have added empirical evidence regarding gender differences in cognitive functioning
among older Indian adults considering their physical activity status by constructing an artificial control group.
A proportion of 24.6% of older men and 12.0% of older women in the current study were found to be fre-
quently physically active. The higher prevalence of vigorous physical activities in older adults may be explained
by the definition of physical activity (vigorous) in this paper which includes the farm-related activities. A large
proportion of older population in rural areas of the country are engaged in agricultural labor50. Another study
based on the data from the LASI pilot survey, using the same definition of vigorous activity, has estimated that
27% of the participants were engaged in vigorous activities37. On the other hand, the significant gender difference
in the prevalence of physical activity may be attributed to the fact that traditionally, in India, men have been con-
sidered as income earners while women are confined to the household. Similarly, studies based in other develop-
ing countries reported gender differences in the prevalence of vigorous physical activities51,52. The previous study
reported that the prevalence of vigorous activities during the farming season was nearly 33% and highlighted
the existing gender differences by reporting that vigorous activities among the male farmers were greater than
female farmers irrespective of the season of f arming52.
Our results suggest that older adults who engaged in physical activity have higher cognitive functioning score
compared with older adults without physical activity. The finding is consistent with previous reviews of obser-
vational studies that have concluded that interventions that promote higher levels of physical activity in old age
are associated with a slower rate of cognitive decline14,53,54. Evidence also suggest that regular physical activity
through management of cardiovascular risk factors such as hypertension, diabetes and obesity may protect the
cognitive abilities and reduce the risk of late-life d ementia55. Several studies based on cross-sectional/ prospec-
tive cohort design as well as randomized controlled trials (RCTs) have shown similar findings that suggest a
significantly larger hippocampal or grey matter volumes and associated better spatial memory and improved
cognitive functioning among physically fit older individuals compared with their unfit c ounterparts56,57. Hence,
exercise and physical activity interventions for older adults may help ameliorate age-related deficits in cognitive
functioning by providing a better executive functioning and appropriate decision making, that in turn result in
avoiding adverse life habits in later years of life.
However, it is also plausible that a reciprocal association is present, such that remaining cognitively active may
positively influence being physically active. In particular, this effect might occur through higher performance
in executive functioning that have a positive impact on independence and functionality among older adults as
shown in the previous studies58–60. Again, as documented, further cognitive deficits could possibly be explained
by the decline in physical activity in people in later years of life with cognitive impairment or with lower score in
cognitive functioning. On the other hand, multiple studies have found no evidence of slowing down the cogni-
tive decline in people doing more physical activity61–65. Another study suggests that although physical activity
levels were found lower in the years leading up to diagnosis of dementia, such a reduction in physical activity
might simply be a part of preclinical symptoms of dementia66. Nevertheless, by using the PSM method in the
current study which mimics the experimental design with balanced baseline characteristics, a potential positive
causal association between physical activities and cognitive functioning among Indian older adults is suggested.
Another important finding of our study is that after including for critical confounding factors, such as socio-
demographics and health behaviours, women had a stronger cognitive score compared to men while they were
assumedly treated with physical activity. Recent studies showed that women’s lower cognitive functioning is
importantly explained by the individual attributes such as differences in educational and occupational levels
and poor health s tatus67–69. Moreover, in comparison to men, a shorter duration of formal education, longest
occupation being domestic worker and the psychiatric disorders associated with widowhood and lack of social
resource accounted for steeper cognitive decline in women than in men70–73. Hence, the increased physical activ-
ity in women might have a stronger influence on their cognitive abilities. Similarly, the longer life expectancy of
women could also explain observed gender differences in the association between physical activity and cogni-
tive functioning Women have a larger burden of impairment than men74,75. Thus, as the current results suggest
the interventional programs that focus on promoting physical activity in old age may have greater impact on
cognitive health especially among women. Furthermore, women’s increased engagement in group activities and
social interactions that have beneficial effects on their brain volume and executive functioning may reduce the
gender gap observed in cognitive functioning15.
Scientific Reports | (2022) 12:2725 | https://doi.org/10.1038/s41598-022-06725-3 7
Vol.:(0123456789)www.nature.com/scientificreports/
Male Female
No frequent Frequent No frequent Frequent
Variables physical activity physical activity Difference physical activity physical activity Difference
Individual factors
Age
Young-old 53.0 72.7 19.8 57.0 75.0 18.1
Old-old 33.8 22.8 − 11.0 30.6 20.3 − 10.3
Oldest-old 13.2 4.4 − 8.8 12.5 4.7 − 7.8
Education
No education/primary not
52.5 54.9 2.4 81.4 81.0 − 0.4
completed
Primary 14.8 14.9 0.1 7.8 8.9 1.1
Secondary 21.0 19.0 − 2.0 8.1 6.7 − 1.3
Higher 11.7 11.2 − 0.5 2.7 3.4 0.7
Marital status
Currently married 79.1 87.1 7.9 42.2 57.8 15.6
Widowed 18.4 10.7 − 7.7 56.0 39.2 − 16.8
Others 2.5 2.2 − 0.3 1.8 3.1 1.3
Living arrangement
Living alone 2.9 1.5 − 1.4 8.3 10.5 2.2
Living with spouse 26.3 25.2 − 1.1 14.5 20.2 5.7
Living with children and
66.5 70.9 4.4 69.5 64.0 − 5.5
spouse
Living with others 4.3 2.4 − 1.9 7.7 5.3 − 2.4
Working status
Never worked 4.4 2.1 − 2.2 49.9 24.0 − 25.9
Currently working 31.7 74.0 42.3 14.0 54.8 40.9
Currently not working 49.6 14.0 − 35.6 34.2 19.6 − 14.6
Retired 14.4 9.8 − 4.5 1.9 1.6 − 0.3
Obesity/overweight
No 84.7 83.7 − 1.0 77.2 73.9 − 3.3
Yes 15.3 16.3 1.0 22.8 26.1 3.3
Alcohol consumption
No 72.9 71.2 − 1.7 97.6 96.4 − 1.1
Yes 27.1 28.9 1.7 2.5 3.6 1.1
Tobacco consumption
No 41.9 38.5 − 3.4 78.0 74.9 − 3.1
Yes 58.1 61.5 3.4 22.0 25.1 3.1
Health factors
Self-rated health
Good 52.1 62.5 10.4 48.9 65.8 16.9
Poor 47.9 37.5 − 10.4 51.1 34.2 − 16.9
Difficulty in ADL
No 75.6 85.8 10.2 72.5 80.8 8.4
Yes 24.4 14.2 − 10.2 27.6 19.2 − 8.4
Difficulty in IADL
No 57.4 69.4 12.0 42.2 49.0 6.8
Yes 42.6 30.6 − 12.0 57.8 51.0 -6.8
Morbidity
0 47.0 58.1 11.1 44.0 47.7 3.6
1 28.9 25.5 − 3.4 29.5 34.3 4.8
2+ 24.1 16.4 − 7.7 26.5 18.0 − 8.5
Household factors
MPCE quintile
Poorest 21.0 20.2 − 0.8 23.0 19.1 − 3.9
Poorer 21.6 20.6 − 1.0 22.1 21.8 − 0.3
Middle 21.0 23.5 2.5 20.1 22.3 2.2
Richer 18.9 20.1 1.2 18.9 21.3 2.4
Continued
Scientific Reports | (2022) 12:2725 | https://doi.org/10.1038/s41598-022-06725-3 8
Vol:.(1234567890)www.nature.com/scientificreports/
Male Female
No frequent Frequent No frequent Frequent
Variables physical activity physical activity Difference physical activity physical activity Difference
Richest 17.5 15.6 − 1.9 16.0 15.5 − 0.4
Religion 0.0
Hindu 81.3 84.3 3.0 81.9 86.3 4.4
Muslim 12.2 10.2 − 2.1 11.4 7.0 − 4.5
Christian 2.7 2.2 − 0.5 3.2 2.4 − 0.8
Others 3.8 3.4 − 0.4 3.5 4.4 0.9
Caste
Scheduled caste 18.6 19.3 0.7 19.2 17.8 − 1.4
Scheduled tribe 7.4 8.7 1.3 7.9 12.5 4.6
Other backward class 45.1 48.3 3.2 44.3 47.5 3.2
Others 28.9 23.8 − 5.1 28.6 22.2 − 6.4
Place of residence
Rural 70.4 77.2 6.8 68.8 72.2 3.4
Urban 29.6 22.8 − 6.8 31.2 27.8 − 3.4
Region
North 13.4 8.9 − 4.5 13.2 10.0 − 3.2
Central 23.1 20.7 − 2.3 20.4 13.8 − 6.5
East 25.3 22.3 − 3.1 24.0 13.8 − 10.2
Northeast 2.7 3.4 0.6 3.1 2.9 − 0.2
West 14.4 22.0 7.6 16.3 30.3 14.0
South 21.0 22.7 1.7 23.1 29.2 6.1
Total 100 100 0.0 100 100 0.0
Table 2. Percentage of older adults who were involved in frequent physical activity and not involved in
frequent physical activity, LASI, 2017–18. Differences: Frequent physical activity − No frequent physical
activity.
Treated Control Differences SE p-value
Male
Frequent physical activity
Cognitive score (0–43)
Unmatched 27.346 26.617 0.728 0.126
ATT 27.346 26.592 0.754 0.180 0.001
ATU 26.617 27.680 1.063
ATE 0.986
Female
Frequent physical activity
Cognitive score (0–43)
Unmatched 23.594 22.522 1.072 0.179
ATT 23.594 22.774 0.821 0.251 0.001
ATU 22.538 23.935 1.397
ATE 1.323
Table 3. Results of matching estimates showing the effect of frequent physical activity on cognitive scores
among older adults, LASI, 2017–2018. The model was controlled for individual, health and household factors.
There are several limitations to this study. Importantly, the study is conducted with a cross-sectional design
and relies upon self-report for physical activity. Also, the possibility of unobserved confounding factors may
exist since the method of PSM is limited by the fact that it can only control for observed confounders. This
again suggests the need for future longitudinal studies to test the current conclusions. Although the cogni-
tive functioning module was based on multiple domains and was multi-faceted, mechanisms underlying the
physical and executive functioning that directly affect cognitive domains are not taken into account in the
study. Further, finding of the relationship of physical activity and cognitive functioning is often attributed to the
underlying neurobiological differences between older adults with cognitive deficits. For example, compared to
cognitively healthy older adults, those with mild cognitive impairment have greater amounts of beta-amyloid
Scientific Reports | (2022) 12:2725 | https://doi.org/10.1038/s41598-022-06725-3 9
Vol.:(0123456789)www.nature.com/scientificreports/
PSM
Outcome variable (cognitive score) Unmatched ATE ATT
Male
Frequent physical activity (Yes vs no) 0.73* (0.51–0.96) 1.22* (0.92–1.52) 0.71* (0.39–1.18)
Female
Frequent physical activity (Yes vs no) 1.09* (0.77–1.40) 1.29* (0.83–1.76) 0.74* (0.31–1.18)
Table 4. Adjusted regression coefficients (for cognitive scores)—unmatched and PSM models. The model was
control for individual, health and household factors.
Figure 2. Balance plot before and after propensity matching.
accumulation; accelerated atrophy in the medial temporal lobe; and decreased connectivity of the hippocampus
with the brain76–79. These underlying changes in the brain may potentially alter the relationships of behavioural
factors with cognitive functioning, leading to an attenuation of the relationship between physical activity and
cognitive functioning observed in our study. This reveals the need for further investigation with more clinical
information as well as longitudinal design.
Nevertheless, the findings of our study have important public health implications because the analyses are
conducted in a large sample of older adults derived from a nationally-representative survey, and explored the
treatment effects of physical activity on cognitive functioning with comparing to an artificial control group that
is untreated with such intervention, which in turn provides a potential causal effect of such treatment. The data
also provided exhaustive and comprehensive information on aging population by which the major confounding
factors could be controlled throughout the analyses.
Conclusion
Given rapid increase in life expectancy, cognitive disability is increasingly a public health challenge. The findings
of the present study suggest physical activity as one of the modifiable risk factors that prevent or delay the onset
of cognitive impairment. Owing to its cardio-protective effect, physical activity can be considered as a potential
factor that stimulates the brain activities and cognitive functioning in old age and can be accommodated in
interventions related to active aging. Therefore, health practitioners aiming to improve the cognitive functioning
of older patients or clients might benefit from the development of the interventions related to physical activities
designed to reduce the decline of cognitive resources. Moreover, in terms of cognitive enrichment in older popu-
lation and in women in particular by initiating behavioural interventions that can also contribute to optimizing
a successful aging, further longitudinal studies are warranted.
Scientific Reports | (2022) 12:2725 | https://doi.org/10.1038/s41598-022-06725-3 10
Vol:.(1234567890)www.nature.com/scientificreports/
Figure 3. Overlap plot for the propensity score of each treatment.
Data availability
The study uses secondary data which is available on reasonable request through https://www.iipsindia.ac.in/
content/lasi-wave-i.
Received: 2 August 2021; Accepted: 28 January 2022
References
1. Fisher, G. G., Chacon, M. & Chaffee, D. S. Theories of Cognitive Aging and Work (Elsevier Inc., 2019). https://doi.org/10.1016/
B978-0-12-812756-8.00002-5.
2. Salthouse, T. A. The processing-speed theory of adult age differences in cognition. Psychol. Rev. 103, 403–428 (1996).
3. Van Hooren, S. A. H. et al. Cognitive functioning in healthy older adults aged 64–81: A cohort study into the effects of age, sex,
and education. Aging Neuropsychol. Cogn. 14, 40–54 (2007).
4. Orgeta, V. et al. The lancet commission on dementia prevention, intervention, and care: A call for action. Ir. J. Psychol. Med. 36,
283 (2019).
5. Livingston, G. A. et al. The lancet international commission on dementia prevention and care. Lancet 390, 1–10 (2021).
6. Frankish, H. & Horton, R. Prevention and management of dementia: A priority for public health. Lancet 390, 2614–2615 (2017).
7. United Nations. World Population Prospects 2019. (2019).
8. Shaji, K., Jithu, V. & Jyothi, K. Indian research on aging and dementia. Indian J. Psychiatry 52, 148 (2010).
9. Muhammad, T. & Meher, T. Association of late-life depression with cognitive impairment: Evidence from a cross-sectional study
among older adults in India. BMC Geriatr. 21, 1–13 (2021).
10. Blazer, D. G., Yaffe, K. & Liverman, C. T. Cognitive aging: Progress in understanding and opportunities for action. BMC Geriatr.
https://doi.org/10.17226/21693 (2015).
11. Yang, R. et al. Loneliness as a mediator of the impact of social isolation on cognitive functioning of Chinese older adults. Age
Ageing 49, 599–604 (2020).
12. Fratiglioni, L., Paillard-Borg, S. & Winblad, B. An active and socially integrated lifestyle in late life might protect against dementia.
Lancet Neurol. 3, 343–353 (2004).
13. Bherer, L., Erickson, K. I. & Liu-Ambrose, T. A review of the effects of physical activity and exercise on cognitive and brain func-
tions in older adults. J. Aging Res. https://doi.org/10.1155/2013/657508 (2013).
14. Blondell, S. J., Hammersley-Mather, R. & Veerman, J. L. Does physical activity prevent cognitive decline and dementia? A systematic
review and meta-analysis of longitudinal studies. BMC Public Health 14, 1–12 (2014).
15. Hertzog, C. et al. Enrichment effects on adult cognitive development: Can the functional capacity of older adults be preserved and
enhanced?. Psychol. Sci. Public Interest Suppl 9, 1–65 (2008).
16. Kramer, A. F. et al. Environmental influences on cognitive and brain plasticity during aging. J. Gerontol. A 59, 940–957 (2004).
17. Hamer, M. & Chida, Y. Physical activity and risk of neurodegenerative disease: A systematic review of prospective evidence. Psychol.
Med. 39, 3–11 (2008).
18. Erickson, K. I., Hillman, C. H. & Kramer, A. F. Physical activity, brain, and cognition. Curr. Opin. Behav. Sci. 4, 27–32 (2015).
19. Gomez-Pinilla, F. & Hillman, C. The influence of exercise on cognitive abilities. Compr. Physiol. 3, 403–428 (2013).
20. Kramer, A. F. & Erickson, K. I. Capitalizing on cortical plasticity: Influence of physical activity on cognition and brain function.
Trends Cogn. Sci. 11, 342–348 (2007).
21. Marques, A. et al. The association between physical activity and chronic diseases in European adults. Eur. J. Sport Sci. 18, 140–149
(2018).
Scientific Reports | (2022) 12:2725 | https://doi.org/10.1038/s41598-022-06725-3 11
Vol.:(0123456789)www.nature.com/scientificreports/
22. de Souto, B. P. et al. Physical activity and incident chronic diseases: A longitudinal observational study in 16 European Countries.
Am. J. Prev. Med. 52, 373–378 (2017).
23. Yang, X. et al. Prospective associations between depressive symptoms and cognitive functions in middle-aged and elderly Chinese
adults. J. Affect Disord. 263, 692–697 (2020).
24. Fan, S. et al. Physical activity level and incident type 2 diabetes among chinese adults. Med. Sci. Sports Exerc. 47, 751–756 (2015).
25. Falck, R. S. et al. Cross-sectional relationships of physical activity and sedentary behavior with cognitive function in older adults
with probable mild cognitive impairment. Phys. Ther. 97, 975–984 (2016).
26. Makizako, H. et al. Moderate-intensity physical activity, hippocampal volume, and memory in older adults with mild cognitive
impairment. J. Gerontol. A 70, 480–486 (2015).
27. Kooistra, M. et al. Physical activity, structural brain changes and cognitive decline: The SMART-MR study. Atherosclerosis 234,
47–53 (2014).
28. Raz, N. et al. Regional brain changes in aging healthy adults: General trends, individual differences and modifiers. Cereb. Cortex
15, 1676–1689 (2005).
29. O’Sullivan, M. et al. Evidence for cortical ‘disconnection’ as a mechanism of age-related cognitive decline. Neurology 57, 632–638
(2001).
30. Voss, M. W. et al. Bridging animal and human models of exercise-induced brain plasticity. Trends Cogn. Sci. 17, 525–544 (2013).
31. Gill, S. J. et al. Association between lifetime physical activity and cognitive functioning in middle-aged and older community
dwelling adults: Results from the brain in motion study. J. Int. Neuropsychol. Soc. 21, 816–830 (2015).
32. Gallaway, P. J. et al. Physical activity: A viable way to reduce the risks of mild cognitive impairment, alzheimer’s disease, and
vascular dementia in older adults. Brain Sci. https://doi.org/10.3390/brainsci7020022 (2017).
33. Cherubal, A. G. et al. Physical activity and mental health in India: A narrative review. Int. J. Soc. Psychiatry 65, 656–667 (2019).
34. Nayak, S., Mohapatra, M. K. & Panda, B. Prevalence of and factors contributing to anxiety, depression and cognitive disorders
among urban elderly in Odisha: A study through the health systems’ Lens. Arch. Gerontol. Geriatr. 80, 38–45 (2019).
35. International Institute for Population Sciences (IIPS), NPHCE, MoHFW, et al. Longitudinal Ageing Study in India (LASI) Wave 1,
Mumbai (2020).
36. Chen, L. J. et al. Relationships of leisure-time and non-leisure-time physical activity with depressive symptoms: A population-based
study of Taiwanese older adults. Int. J. Behav. Nutr. Phys. Act. 9, 1–10 (2012).
37. Cramm, J. M. & Lee, J. Smoking, physical activity and healthy aging in India. BMC Public Health 14, 1–7 (2014).
38. Srivastava, S. et al. Interaction of physical activity on the association of obesity-related measures with multimorbidity among older
adults: A population-based cross-sectional study in India. BMJ Open 11, e050245 (2021).
39. Srivastava, S. et al. The association of widowhood and living alone with depression among older adults in India. Sci. Rep. 1, 1–13
(2021).
40. Muhammad, T., Meher, T. & Sekher, T. V. Association of elder abuse, crime victimhood and perceived neighbourhood safety with
major depression among older adults in India: A cross-sectional study using data from the LASI baseline survey (2017–2018).
BMJ Open 11, e055625 (2021).
41. Meher, T., Muhammad, T. & Gharge, S. The association between single and multiple chronic conditions and depression among
older population in India: A comparative study between men and women. Int. J. Geriatr. Psychiatry. https://doi.org/10.1002/gps.
5639 (2021).
42. Muhammad, T. & Srivastava, S. Why rotational living is bad for older adults evidence from a cross-sectional study in India. J.
Popul. Ageing https://doi.org/10.1007/s12062-020-09312-4 (2020).
43. Srivastava, S. & Muhammad, T. Violence and associated health outcomes among older adults in India: A gendered perspective.
SSM Popul. Health https://doi.org/10.1016/j.ssmph.2020.100702 (2020).
44. Keetile, M., Navaneetham, K. & Letamo, G. Prevalence and correlates of multimorbidity among adults in Botswana: A cross-
sectional study. PLoS ONE https://doi.org/10.1371/journal.pone.0239334 (2020).
45. Rosenbaum, P. R. & Rubin, D. B. The central role of the propensity score in observational studies for causal effects. Biometrika 70,
41–55 (1983).
46. Austin, P. C. An introduction to propensity score methods for reducing the effects of confounding in observational studies. Mul-
tivariate Behav. Res. 46, 399–424 (2011).
47. Rosenbaum, P. R. Discussing hidden bias in observational studies. Ann. Intern. Med. 115, 901–905 (1991).
48. Leuven, E. & Sianesi, B. PSMATCH2: Stata module to perform full Mahalanobis and propensity score matching, common support
graphing, and covariate imbalance testing.
49. Becker, S. O. & Caliendo, M. Sensitivity analysis for average treatment effects. Stata J. 7, 71–83 (2007).
50. Milovanovic, V. & Smutka, L. Populating aging in rural India: Implication for agriculture and smallholder farmers. J. Popul. Ageing
13, 305–323 (2020).
51. Muntrer, P. et al. Prevalence of physical activity among Chinese adults: Results from the international collaborative study of car-
diovascular disease in Asia. Am. J. Public Health 95, 1631–1636 (2005).
52. Ding, C. et al. The physical activity patterns among rural Chinese adults: Data from China national nutrition and health survey
in 2010–2012. Int. J. Environ. Res. Public Health 15, 1–13 (2018).
53. Sofi, F. et al. Physical activity and risk of cognitive decline: A meta-analysis of prospective studies. J. Intern. Med. 269, 107–117
(2011).
54. Xu, W. et al. Meta-analysis of modifiable risk factors for Alzheimer’s disease. J. Neurol. Neurosurg. Psychiatry 86, 1299–1306 (2015).
55. Baumgart, M. et al. Summary of the evidence on modifiable risk factors for cognitive decline and dementia: A population-based
perspective. Alzheimer’s Dement. 11, 718–726 (2015).
56. Morgan, G. S. et al. Physical activity in middle-age and dementia in later life: Findings from a prospective cohort of men in caer-
philly, South Wales and a meta-analysis. J. Alzheimer’s Dis. 31, 569–580 (2012).
57. Ahlskog, J. E. et al. Physical exercise as a preventive or disease-modifying treatment of dementia and brain aging. Mayo Clin. Proc.
86, 876–884 (2011).
58. Cahn-Weiner, D. A., Boyle, P. A. & Malloy, P. F. Tests of executive function predict instrumental activities of daily living in
community-dwelling older individuals. Appl. Neuropsychol. 9, 187–191 (2002).
59. Best, J. R., Davis, J. C. & Liu-Ambrose, T. Longitudinal analysis of physical performance, functional status, physical activity, and
mood in relation to executive function in older adults who fall. J. Am. Geriatr. Soc. 63, 1112–1120 (2015).
60. Royall, D. R. et al. Declining executive control in normal aging predicts change in functional status: The freedom house study. J.
Am. Geriatr. Soc. 52, 346–352 (2004).
61. Colcombe, S. & Kramer, A. F. Fitness effects on the cognitive function of older adults: A meta-analytic study. Psychol. Sci. 14,
125–130 (2003).
62. Snowden, M. et al. Effect of exercise on cognitive performance in community-dwelling older adults: Review of intervention trials
and recommendations for public health practice and research. J. Am. Geriatr. Soc. 59, 704–716 (2011).
63. Sink, K. M. et al. Effect of a 24-month physical activity intervention compared to health education on cognitive outcomes in
sedentary older adults: The LIFE Randomized Trial. JAMA 314, 781–790 (2015).
64. Angevaren, M. et al. Physical activity and enhanced fitness to improve cognitive function in older people without known cognitive
impairment. Cochrane Database Syst. Rev. https://doi.org/10.1002/14651858.CD005381.pub2 (2008).
Scientific Reports | (2022) 12:2725 | https://doi.org/10.1038/s41598-022-06725-3 12
Vol:.(1234567890)www.nature.com/scientificreports/
65. Young, J. et al. Aerobic exercise to improve cognitive function in older people without known cognitive impairment. Cochrane
Database Syst. Rev. https://doi.org/10.1002/14651858.CD005381.pub4 (2015).
66. Sabia, S. et al. Physical activity, cognitive decline, and risk of dementia: 28 year follow-up of Whitehall II cohort study. BMJ 357,
1–12 (2017).
67. Okamoto, S. et al. Decomposition of gender differences in cognitive functioning: National Survey of the Japanese elderly. BMC
Geriatr. 21, 1–13 (2021).
68. Muhammad, T., Srivastava, S. & Sekher, T. V. Association of self-perceived income sufficiency with cognitive impairment among
older adults: A population-based study in India. BMC Psychiatry 21, 1–14 (2021).
69. Muhammad, T., Govindu, M. & Srivastava, S. Relationship between chewing tobacco, smoking, consuming alcohol and cognitive
impairment among older adults in India: A cross-sectional study. BMC Geriatr. 21, 85 (2021).
70. Yount, K. M. Gender, resources across the life course, and cognitive functioning in Egypt. Demography 45, 907–926 (2008).
71. Lyu, J. & Kim, H. Y. Gender-specific incidence and predictors of cognitive impairment among older Koreans: Findings from a
6-year prospective cohort study. Psychiatry Investig. 13, 473–479 (2016).
72. Feng, L. et al. Marital status and cognitive impairment among community-dwelling chinese older adults: The role of gender and
social engagement. Dement. Geriatr. Cogn. Dis. Extra. https://doi.org/10.1159/000358584 (2014).
73. Lei, X. et al. Gender differences in cognition among older adults in China. J. Hum. Resour. 47, 951–971 (2012).
74. Jagger, C. & Matthews, F. Gender differences in life expectancy free of impairment at older ages. Health Expect. Older Women Int.
Perspect. 2841, 85–98 (2014).
75. Brayne, C. et al. Health and ill-health in the older population in England and Wales. Age Ageing 30, 53–62 (2001).
76. Zhou, Y. et al. Abnormal connectivity in the posterior cingulate and hippocampus in early Alzheimer’s disease and mild cognitive
impairment. Alzheimer’s Dement. 4, 265–270 (2008).
77. Pike, K. E. et al. β-amyloid imaging and memory in non-demented individuals: Evidence for preclinical Alzheimer’s disease. Brain
130, 2837–2844 (2007).
78. Driscoll, I. et al. Longitudinal pattern of regional brain volume change differentiates normal aging from MCI. Neurology 72,
1906–1913 (2009).
79. Huang, P. et al. Exercise-related changes of networks in aging and mild cognitive impairment brain. Front. Aging Neurosci. https://
doi.org/10.3389/fnagi.2016.00047 (2016).
Acknowledgements
The authors are grateful to the International Institute for Population Sciences, Mumbai, for providing the LASI
data for undertaking the current study.
Author contributions
Conceived and designed the research paper: M.K., S.S., and T.M.; analyzed the data: S.S.; Contributed agents/
materials/analysis tools: M.K. and T.M.; Wrote the manuscript: M.K., T.M. and S.S.; Refined the manuscript:
M.K. and T.M. All authors read, reviewed and approved the manuscript to be published.
Competing interests
The authors declare no competing interests.
Additional information
Correspondence and requests for materials should be addressed to T.M.
Reprints and permissions information is available at www.nature.com/reprints.
Publisher’s note Springer Nature remains neutral with regard to jurisdictional claims in published maps and
institutional affiliations.
Open Access This article is licensed under a Creative Commons Attribution 4.0 International
License, which permits use, sharing, adaptation, distribution and reproduction in any medium or
format, as long as you give appropriate credit to the original author(s) and the source, provide a link to the
Creative Commons licence, and indicate if changes were made. The images or other third party material in this
article are included in the article’s Creative Commons licence, unless indicated otherwise in a credit line to the
material. If material is not included in the article’s Creative Commons licence and your intended use is not
permitted by statutory regulation or exceeds the permitted use, you will need to obtain permission directly from
the copyright holder. To view a copy of this licence, visit http://creativecommons.org/licenses/by/4.0/.
© The Author(s) 2022
Scientific Reports | (2022) 12:2725 | https://doi.org/10.1038/s41598-022-06725-3 13
Vol.:(0123456789)You can also read