Regional Water Implications of Reducing Oil Imports with Liquid Transportation Fuel Alternatives in the United States
←
→
Page content transcription
If your browser does not render page correctly, please read the page content below
Policy Analysis

                                                                                                                                                pubs.acs.org/est

Regional Water Implications of Reducing Oil Imports with Liquid
Transportation Fuel Alternatives in the United States
Sarah M. Jordaan,*,†,‡,§ Laura Diaz Anadon,† Erik Mielke,† and Daniel P. Schrag§
†
 Belfer Center for Science and International Affairs, John F. Kennedy School of Government, Harvard University, 79 John F. Kennedy
 Street, Cambridge, Massachusetts 02138, United States
‡
 Department of Political Science, University of Calgary, 2500 University Drive NW, Calgary, Alberta, Canada T2N1N4
§
 Department of Earth and Planetary Sciences, Harvard University, 20 Oxford Street, Cambridge, Massachusetts 02138, United States
    *
    S Supporting Information

    ABSTRACT: The Renewable Fuel Standard (RFS) is among the
    cornerstone policies created to increase U.S. energy independence by
    using biofuels. Although greenhouse gas emissions have played a role in
    shaping the RFS, water implications are less understood. We
    demonstrate a spatial, life cycle approach to estimate water
    consumption of transportation fuel scenarios, including a comparison
    to current water withdrawals and drought incidence by state. The water
    consumption and land footprint of six scenarios are compared to the
    RFS, including shale oil, coal-to-liquids, shale gas-to-liquids, corn
    ethanol, and cellulosic ethanol from switchgrass. The corn scenario is
    the most water and land intense option and is weighted toward drought-prone states. Fossil options and cellulosic ethanol
    require significantly less water and are weighted toward less drought-prone states. Coal-to-liquids is an exception, where water
    consumption is partially weighted toward drought-prone states. Results suggest that there may be considerable water and land
    impacts associated with meeting energy security goals through using only biofuels. Ultimately, water and land requirements may
    constrain energy security goals without careful planning, indicating that there is a need to better balance trade-offs. Our approach
    provides policymakers with a method to integrate federal policies with regional planning over various temporal and spatial scales.

1. INTRODUCTION                                                               policy has been questioned because of the many uncertainties
Since the oil crisis in the 1970s, energy security has been a long-           associated with both life cycle greenhouse gas emissions and
standing concern of policymakers in the United States. This                   the speed of technological change.9,10 While biofuels are often
concern continues as 57% percent of crude oil processed in                    discussed in policy, due mainly to their perceived environ-
U.S. refineries was imported in 2012.1 The United States’                      mental benefits, they are not the only alternative for meeting
continued reliance on oil keeps the questions about the                       U.S. energy security goals. Recent increases in shale oil and gas
economic consequences of energy imports and the associated                    reserves have altered the outlook for America’s energy system,
vulnerability of the U.S. to politically motivated energy supply              switching the focus from importing crude oil and liquefied
disruption in the minds of the policymakers. The desire to                    natural gas to a focus on increasing the domestic energy supply.
achieve energy security was underscored in the March 2011                     For example, natural gas can be converted to gasoline or can be
speech where President Obama announced a new U.S. a goal to                   used in compressed natural gas vehicles (CNG).11 Increasing
reduce the ten million barrels of oil imported a day by one-third             the electric vehicle fleet can also significantly reduce the
by 2025.2 The mix of policies that is expected to contribute                  demand for oil imports. Though technologically viable, the
toward this goal are increasing the efficiency of the vehicle fleet;             compressed natural gas and transport electrification options
increasing electrification; increasing domestic petroleum                      necessitate major changes in the vehicle fleet and/or
production; and substituting petroleum-based fuels with                       distribution infrastructure.12 Improving fuel economy is
biofuels. Among the most prominent of these policies to                       another prominent policy that could be used to reduce
date, the renewable fuel standard (RFS), was passed under the                 transportation emissions. While our analysis did not include
Energy Independence and Security Act of 2007. The RFS                         an investigation of improved fuel economy, it does rely on the
mandates an increase in the use of biomass-based fuels from 9                 EIA’s Annual Energy Outlook 2011, which does include
billion gallons in 2008 to 36 billion gallons by 2022.3−7 Out of              improvements in fuel economy in their scenarios. More
those 36 billion gallons, no more than 15 billion are meant to                recently, a standard has been introduced which will result in
be produced with corn grain, while the remaining 21 billion
would be produced from “advanced biofuels” (no less than 16                   Received: March 27, 2012
billion of which should come from cellulosic biofuels, mainly                 Accepted: September 18, 2013
from switchgrass and crop residues).8 The adequacy of this                    Published: September 18, 2013

                              © 2013 American Chemical Society        11976                dx.doi.org/10.1021/es404130v | Environ. Sci. Technol. 2013, 47, 11976−11984
Environmental Science & Technology                                                                                                             Policy Analysis

an increase of fuel economy to the equivalent of 54.5 mpg for                impacts of a prominent policy into the future or discuss how
cars and light-duty trucks by Model Year 2025.13 While not                   these impacts may be mitigated with other possible alternatives
included in this analysis, it should be noted that such programs             to reduce oil imports (e.g., coal-to-liquids, shale gas-to-liquids,
will help to reduce oil consumption by an estimated 2 million                or shale oil-to-liquids). Using current designs, we estimate the
barrels per day.                                                             amount of motor vehicle fuels that can be displaced by other
   In this paper, we consider the regional water and land-use                fuels using gallon of gasoline equivalents (GGE) metrics. As a
implications of reaching corn and cellulosic ethanol goals stated            result, we include the GGE of gasoline, ethanol, and diesel. We
in the RFS and compare them to the implications of other                     use this approach to be consistent with policy for replacing
liquid-fuel alternatives for reducing oil imports. Of all the                motor vehicle fuels. Previous studies have characterized water
alternatives for reducing oil imports, we have chosen to                     consumption and withdrawal for different liquid fuels in terms
examine liquid transportation fuel options that can be used                  of intensity. Although none have characterized shale gas and
without making large changes to either the fleet or the                       shale oil specifically, it is important to understand total water
distribution infrastructure. These alternatives include (1) a                requirements to place potential impacts in a regional
baseline corn-to-ethanol scenario that assumes that the RFS is               perspective.
not implemented, that corn ethanol contributes 10% of the
transportation fuel demand in 2022, and that any additional oil              2. MATERIALS AND METHODS
required for growth is imported; (2) a business-as-usual                     In this work, we focus specifically on the extraction and
scenario where the RFS is not implemented, no oil is imported,               conversion phases of the life cycle of fuel production
and domestic shale oil is produced instead of the RFS; (3) a                 technologies with a process-based approach focused on the
scenario where cellulosic and corn grain ethanol goals of the                inclusion of spatially resolved data into LCA. In this analysis we
RFS are met; (4) a scenario where cellulosic ethanol is not                  neglect the consideration of water used in several ways: (1) to
commercial and the RFS standards are met only with ethanol                   transport the feedstock from mines or farms to refineries; (2)
from corn grain; (5) a switchgrass-to-ethanol scenario that                  to transport refined fuel to the point of sale to consumers; and
assumes that breakthroughs in switchgrass conversion tech-                   (3) where the water use is embedded in the manufacture and
nologies will enable rain-fed switchgrass crops to meet both the             installation of physical equipment (see King and Webber).13
corn and switchgrass RFS goals; (6) a scenario where the RFS                    As we detail in the description of the assumptions made for
is not implemented and coal-to-liquids are produced instead of               each scenario, the projected spatial allocation of water
the RFS; and (7) a shale gas to gasoline scenario that meets the             consumption is based on the most likely evolution of
demand that will otherwise be met with the RFS. To the best of               extraction, farming, and conversion facilities given the
the authors’ knowledge, there has not yet been any in-depth                  information available today. While it is clearly impossible to
examination of the consumptive water impacts for shale oil and               predict how the scenarios would unfold given changes in cost
shale gas transportation fuel options. To understand the                     and political realities in the future, the general trends reported
regional water implications of each scenario, we make estimates              are meaningful in that they provide a sense of where the largest
of future water consumption for extraction/farming and                       water stresses are likely to be found (and, approximately, how
conversion at the state-level, and compare them to the                       large they may be) depending on what fuels are considered to
industrial and agricultural withdrawals and to the drought                   replace oil imports in an RFS context. Water withdrawal is
incidences.                                                                  defined as the amount of water removed from the ground or
   Previous work related to increased U.S. biofuel production                diverted from a water source for use. While there is some
was focused on evaluating the economic and job creation                      debate surrounding exactly which metric should be used,21−27
impacts of large increases in the role of biofuels in reducing               we define water consumption as the difference between the
U.S. oil dependence,14,15 and thus did not focus on water and                water withdrawn from surface water and the water consumed in
land-use implications. Other studies have quantified current                  evaporation, evapotranspiration, and product integration,
direct average water intensity (defined as consumption and                    discharge to the sea, or percolation to the salt sink (thus not
withdrawal) related to the production of various types of                    re-released into the waterbody). For biofuels, this will include
transportation fuels in the United States,16 but did not use                 irrigation rather than evapotranspiration. We quantify con-
scenarios or spatially resolved information to estimate the                  sumptive water use for each scenario rather than withdrawal.
potential impacts of various policies promoting those fuels. The             Water consumption for each scenario is then normalized to
lack of integration of spatial data has been identified not only as           water withdrawals for irrigation and for industrial use. Recent
a key limitation to life cycle assessment (LCA),17,18 but, more              consumption data is not available from the U.S. Geological
specifically, as a limitation for the application of LCA to                   Survey (USGS); therefore we use water withdrawals to obtain
biofuels. Indeed, the incorporation of spatially resolved                    conservative estimates for the relative change in water
information was one of the seven grand challenges in the                     requirements.
LCA of biofuels identified in the 2011 meetings of the Life-                     For each scenario, a variety of assumptions were used to
Cycle Program of the Energy Biosciences Institute at the                     characterize the expected regional fuel production and its
University of California, Berkeley.19 Other recent work                      corresponding land use and water consumption. The RFS
compares the water footprint of gasoline from conventional                   would require an additional 3.0 billion gasoline gallon
oil and oil sands with that of first generation and cellulosic                equivalents (GGE) of corn ethanol and 10.8 billion GGE of
ethanol and identifies what fraction of current water                         cellulosic ethanol, if cellulosic ethanol were commercial,
consumption takes place in drought-prone areas.20 While                      amounting to a total of 13.8 GGE. In our RFS scenario, we
Scown et al. (2011) use a drought index to indicate what                     examine the maximum amount of cellulosic ethanol to be
fraction of current corn to ethanol, cellulosic ethanol from                 produced. For the scenarios that incorporate corn ethanol
miscanthus, oil sands to gasoline, and crude oil to gasoline                 production, corn yields and irrigation by state were derived
comes from drought prone areas, it does not estimate the                     from USDA data.28 It was assumed that yields increase at a rate
                                                                     11977                dx.doi.org/10.1021/es404130v | Environ. Sci. Technol. 2013, 47, 11976−11984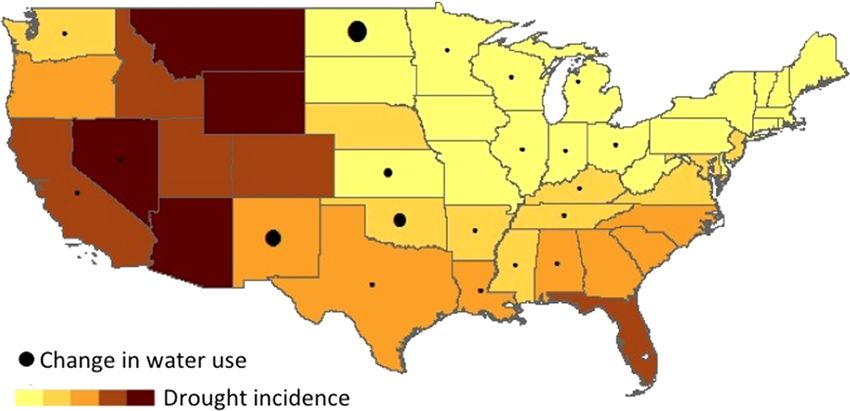
Environmental Science & Technology                                                                                                            Policy Analysis

of 1% per year up to 2022, which is consistent with historical              order to demonstrate improvements in water reuse and
increases in yield.29 In the Supporting Information, we test the            recycling that may occur moving forward. In addition, this
sensitivity of the results by varying the crop yield from −4% to            analysis relies on relative order of magnitude estimates,
4%. Dry milling, which accounts for 80% of corn ethanol                     diminishing the need for detailed sensitivity analyses, as the
production in the U.S. today, was assumed to be the key                     conclusions will not be changed. Land use was quantified for
conversion process. Water consumed for corn conversion was                  extraction, but that used for building natural gas-to-liquids
allocated by state according to the current location of corn                (GTL) plants was assumed to be negligible. Land footprint was
biorefineries as per data from the Renewable Fuels Associa-                  estimated per well from an existing study40 and was converted
tion.30 Corn crops are expected to replace soy, which is                    to an annual spatial requirement for the natural gas production
currently not used for fuel production, with the expansion of               required to meet the scenario. Three different configurations of
the biofuel industry.31 Water consumed by displaced crops was               Fischer−Tropsch processes were used to estimate the potential
defined as the difference between the water consumed per acre                 water consumed for the GTL conversion, where water is used
of soy and the water consumed per acre of corn.32 Water was                 primarily in the steam methane reforming and in the water gas
allocated to coproducts (dried distillers grain) based on energy            shift reaction.41 It was assumed that water for the GTL process
content.33                                                                  was consumed in the Petroleum Administration for Defense
   To provide a lower bound for water consumption of ethanol                District (PADD) in which the natural gas was extracted. The
production, rain-fed switchgrass was used for the cellulosic                water was then allocated to states according to current refining
ethanol case. The amount of land available for rain-fed                     capacity in each state based on the underlying assumption that
switchgrass by state was used to determine the spatial                      building plants near refineries would provide access to various
distribution of production. The allocation of switchgrass crop              types of infrastructure, for both process inputs and gasoline
by state was based on POLYSYS model results from a 2006                     distribution.
study from the University of Tennessee12 in which they                         The study’s coal-to-liquids (CTL) scenario projected coal
estimated the feasibility of a vision to produce 25% of U.S.                production equivalent to 330−380 million additional tonnes of
motor vehicle fuels and 25% of U.S. electric power by 2025                  coal mined per year to produce 13.8 gallons of gasoline.
with biomass. POLYSYS provides annual estimates of changes                  Bituminous and subbituminous coal mining data reported by
in land-use resulting from the demand generated by bioenergy                the U.S. Energy Information Administration (EIA) was used to
industries (including switchgrass production), and changes in               characterize coal production by state. The water consumed by
economic conditions that affect adjustment costs. Conversion                 year for coal mining was calculated using previous estimates of
factors from switchgrass to gallons of ethanol (or equivalent)              the water intensity of coal.42 Land use was quantified for
for biochemical and thermochemical pathways were taken from                 extraction, but that used for the CTL plant was assumed to be
Wu et al. (2009).34 Biochemical conversion relies on either                 negligible. Four different configurations of the Fischer−
acids or enzymes to break down the lignins followed by                      Tropsch process were used to estimate potential water
fermentation. Thermochemical conversion typically relies on                 consumed for CTL conversion, where water is used primarily
gasification followed by Fischer−Tropsch processes to convert                in autothermal reforming and the water gas shift reaction.28
the syngas to liquids, but may also involve a combination of                Three of four CTL designs considered utilize bituminous coal
pyrolysis, hydrotreating, and hydrocracking.35,36                           while the fourth design considered utilizes subbituminous coal.
   We estimate natural gas (NG) production equivalent to                    For the scenario used in the geospatial analysis, the current
approximately 3 tcf/year is required to produce 13.8 gallons of             proportion of bituminous and subbituminous coal production
gasoline. Natural gas data on drilling and production were                  in 2010 was used for projecting the type of coal produced. The
extracted from HPDI, an oil and gas database.37 Future                      average of the three designs was used for the bituminous coal,
production of shale gas by play is assumed to grow                          with the underlying assumption that each would be as
proportionally to current production by play. The water                     economically viable as the other. It was assumed that water
consumed by year was calculated using the number of wells                   for conversion was consumed in the PADD in which the coal
drilled thereby assuming that the timing of the water injected              was mined. The water was then allocated to states based on
for hydraulic fracturing is related to well completion and                  refining capacity based on the same reasoning used in the GTL
refracturing is minimal in comparison. In shale gas develop-                case.
ment, the vast majority of water consumed per well takes place                 The study’s shale oil scenario estimates 2022 oil production
in the first two weeks of drilling. There is a clear downward                equivalent to 0.45 billion bbls/year allocated by states to
trend at the play level in the water intensity of shale gas                 produce 13.8 billion gallons of gasoline equivalent. Data were
production over time after plays come online, likely driven by              extracted from HPDI on drilling and production. Similar to the
the improved recovery through learning as well as by the                    shale gas case, the water consumed by year was calculated using
accumulation of producing wells and subsequent increases in                 the number of wells drilled annually, assuming the timing of
cumulative production that do not depend on large injections                water injected in hydraulic fracturing is related to well
of water. To determine the amount of water injected for shale               completion and refracturing is minimal in comparison. Trends
gas extraction in 2022, the intensity was projected using the               for the water intensity of shale oil from the main plays (Bakken,
trend of the Barnett shale, which is the oldest active shale play           Eagleford, Bone-Spring, and Monterey)43 did not show a steady
and is expected to have significant growth. Recycled and reused              downward trend as with shale gas. As a result, water intensity
water was assumed to range between 0% and 50% of the water                  was calculated as the average water intensity of shale oil
consumed for hydraulic fracturing with an average of 25%,                   extraction over the past decade for all of the plays considered.
which may comprise of flowback water from the well in                        The same amount of water recycled for shale gas was assumed
question or other treated water from other operations.                      for shale oil extraction. The methodology for allocating water
Literature values we found ranged from 0% when produced                     consumed in refining was similar to that of GTL, by assuming
water is injected38 to 45%.39 We chose an aggressive range in               water is consumed in the PADD in which the oil is extracted,
                                                                    11978                dx.doi.org/10.1021/es404130v | Environ. Sci. Technol. 2013, 47, 11976−11984
Environmental Science & Technology Policy Analysis
Figure 1. U.S. consumptive water use of each scenario in billion gallons in 2022. For clarity, the scenarios are presented in the following order:
baseline, renewable fuel standard (RFS), switchgrass using biochemical conversion (SG BC), switchgrass using advanced biochemical conversion
(SG AdvBC), switchgrass using thermochemical conversion (SG TC), corn using dry milling (Corn), shale oil, four configurations of coal-to-liquids
options (CTL 1−4), and three configurations of natural gas to liquids (GTL 1−3). The error bars show the variation in estimates from recycling of
water, demonstrating little change in the overall magnitude.
and then allocated to states by refining capacity.44 Water is to capture more recent trends. We do not aim to predict
allocated to coproducts on an energy content basis, using a drought occurrence or severity, but rather to provide an
method that is based on the average product slates from 2010 indication of recent drought incidence. Drought incidence was
to 2011 in the refinery yields provided by the EIA.45 The calculated as the percentage of time that a state experienced
amount of land disturbed per shale oil pad was assumed to be severe, extreme, or exceptional drought. These data were then
the same as that for shale gas per well27 and intensity was exported to ArcGIS to create a shapefile where maps were
determined using annual oil production to meet the scenario’s created overlaying future water consumption for each scenario
goals as the same infrastructure is required and the operations divided by current water withdrawals (industrial and agricul-
are similar. tural) and drought by state.
To place the water requirements in perspective, water The sensitivity of the results to changes in switchgrass
consumption of each scenario was compared to USGS data on conversion technologies, CTL configurations, and GTL
water withdrawals of industrial and agricultural sectors by configurations was tested as well as the effects of varying
state46 using a simple ratio. Since USGS data for consumption water recycling and reuse in the recovery of hydrocarbons from
is not available for recent years, water withdrawals are used as a shale gas and oil formations. With the exception of switchgrass,
conservative comparison as withdrawals are always higher than these sensitivity analyses were typically did not lead to
consumptive uses are. We refer to this as the consumption to substantial changes in the results. An additional suite of
withdrawal ratio (CWR). Increases in water consumption are scenarios was developed to test the sensitivity of the results to
less likely to be problematic in areas where water is abundant the total overall production of oil substitutes. These scenarios
than in areas where water availability is constrained. Due to the can be found in the Supporting Information, where we examine
limited amount of integrated, large-scale spatial data on water the water and land implications of reaching the goal of reducing
flow and demand at the local level, we employ a simpler U.S. oil imports by one-third by 2025, outlined by President
approach by using drought incidence by state as a proxy.17 Data Obama in March 2011, using the conventional oil substitutes
on the Palmer Drought Index from 2000 to 2010 were considered.
downloaded by state.47 It is well-known that available
technology and science has limited ability to forecast specific 3. RESULTS
drought beyond a few months in advance for a region.48 Rather As shown previously,20 corn ethanol produced using dry milling
than using longer or older data sets, we chose the past decade has significantly greater water consumption than other liquid
11979 dx.doi.org/10.1021/es404130v | Environ. Sci. Technol. 2013, 47, 11976−11984Environmental Science & Technology Policy Analysis
Figure 2. Land use for each scenario in million acres. The scenarios are presented in the following order: baseline, renewable fuel standard,
switchgrass using estimates for improved yields (SG1) and current yields (SG2), corn ethanol (CE), shale oil, four configurations of coal-to-liquids
(CTL 1−4), and three configurations of natural gas to liquids (GTL 1−3). Fossil fuel options are orders of magnitude smaller than biofuel options.
Figure 3. The ratio of annual water consumption for each scenario in 2022 to industrial water withdrawals by state in 2005 is depicted by the circles.
To demonstrate the relative magnitude of the ratio by state, we include a legend for reference. Drought incidence is shown for each state with darker
colors demonstrating a higher percentage of time spent in drought.
transportation options, primarily due to the irrigation of crops order of those of fossil fuel options. While Figure 1
(Figure 1). If cellulosic ethanol becomes commercial, it could demonstrates a comparison of irrigated water, when evapo-
have a much lower consumptive water use, particularly if it was transpiration is considered, rain-fed switchgrass requires 1401 L
produced using rain-fed switchgrass in concert with thermo- of water per liter of ethanol compared to corn that requires
chemical conversion, reaching water consumption levels on the 1262 L of water per liter of ethanol.21 A key finding of this
11980 dx.doi.org/10.1021/es404130v | Environ. Sci. Technol. 2013, 47, 11976−11984Environmental Science & Technology Policy Analysis
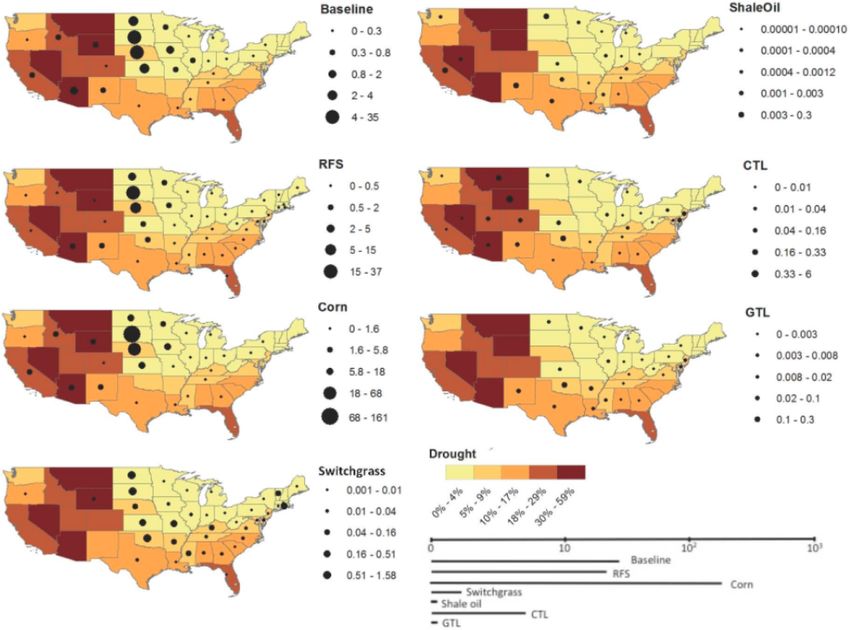
Figure 4. The ratio of annual water consumption for each scenario in 2022 to irrigation water withdrawals by state in 2005 is depicted by the circles.
To demonstrate the relative magnitude of the ratio by state, we include a legend for reference. Drought incidence is shown for each state with darker
colors demonstrating a higher percentage of time spent in drought. It should be noted that WV has very low water withdrawals for irrigation,
resulting in a seemingly high ratio.
analysis is that the baseline option, using anticipated growth in significant. What should be noted is the high increase of CWR
2022, uses an order of magnitude more water than the fossil in drought-prone states, particularly in the Rockies and in
fuel scenarios. California. Idaho, Wyoming, New Mexico, and Arizona would
The land use of fossil fuels was found to be negligible in see increases in consumptive water use compared to industrial
comparison to biofuels (Figure 2). The direct land use of shale withdrawal ranging from a factor of 1.9 for Idaho to a factor of
oil and gas is 4 orders of magnitude smaller than that of first 5.8 for Arizona, with the rest falling within this range. When we
generation biofuel options. When analyzing the impact of the compare new water consumption for corn by state to irrigation
scenarios on land use by state, we focus on the biofuel scenarios withdrawals in these states, the difference is less significant. Of
as they have a much more significant direct land requirement. the drought prone states identified above, water use in the corn
In the Supporting Information, we provide the percentage of scenario would result in an increase of consumptive use to
land required by state for each scenario and demonstrate that to withdrawals ranging from 0.3% in WY to 3% in Arizona. The
fulfill the goals of the RFS using only first generation biofuel corn scenario results in very large increases compared to
technologies (e.g., corn fermentation), 10−30% of the land in irrigation in some states that are not prone to drought; for
several states would be required under our assumptions. The example, in South Dakota the increase in water consumption is
yield of switchgrass is currently low, resulting in land 3-fold compared to current irrigation withdrawals and in Iowa,
requirements in cellulosic ethanol scenarios that are greater it is on the order of 48. Though not a drought-prone state,
than those of the corn ethanol scenarios. We show that with these large increases in water consumption may result in water
aggressive breeding programs, yields may reach levels where constraints and in an inability to reach these levels of
land requirements of switchgrass crops may be less than that of production.
corn. The GTL scenario decreases water consumption by an order
Figures 3 and 4 demonstrate the regional water consumption of magnitude compared to water consumption under the
of each scenario compared to the drought incidence by state. baseline scenario. It would also result in water consumption in
We compare water consumption in all scenarios to industrial states that are less drought-prone. Using Arizona as an example,
water withdrawal (Figure 3) and to irrigation water withdrawal the baseline scenario and the RFS increases water consumption
(Figure 4). We discuss the normalized consumptive water use by 1.2 and 1.3 times the current industrial withdrawals
by scenario to current industrial water withdrawals using a respectively, whereas GTL uses none. In Texas, GTL increases
consumption to withdrawal ratio (CWR), unless indicated consumptive water use by 2% when compared to current
otherwise. Consumptive water use is also normalized to industrial water withdrawal, whereas there is a 5% increase
irrigation water withdrawals for the biofuel scenarios for a under the baseline and RFS scenarios. In New Mexico, GTL
more relevant comparison. Given the water intensive nature of results in significantly less water consumption when compared
corn, it is not surprising that the increases in the ratio of water to the baseline and the RFS scenarios. The GTL scenarios
consumption to withdrawal by state in the corn scenario are result in a 7% increase over current industrial water withdrawal,
11981 dx.doi.org/10.1021/es404130v | Environ. Sci. Technol. 2013, 47, 11976−11984Environmental Science & Technology Policy Analysis
whereas the latter two scenarios increase by approximately 80% cellulosic ethanol can have significant water benefits particularly
when compared to withdrawals. if produced using rain-fed switchgrass in concert with
CWRs in the CTL and shale oil scenarios, while also on the thermochemical conversion, with levels similar to fossil fuel
same order as the GTL scenario, are more heavily weighted options. The fossil options were found to have the lowest water
toward drought-prone areas. We focus on the comparison to footprint, though water consumption of CTL was weighted
industrial water withdrawal for this scenario. CTL would toward drought-prone states. Shale oil and GTL scenarios
represent a decrease in water consumption when compared to could increase water consumption in some drought-prone
baseline. The largest increases in water consumption compared states; however, the general trends for these two scenarios are
to withdrawals occur in drought-prone states, for example, CTL that they are weighted toward states that experience lower
has significantly less water consumption in comparison to the levels of drought.
baseline and RFS scenarios in Arizona, California, and Idaho. Limitations to this analysis include the need to improve
The most significant difference is in Arizona, where the baseline methods for quantifying land impacts, the exclusion of
and RFS resulted in an approximate increase of 1.2 and 1.3 cumulative effects and growth of other resource uses, and the
times the current industrial water withdrawal, respectively, uncertain nature of reserves, technological deployment, and
whereas the CTL scenario resulted in a much smaller increase commercialization. First, there is a need to improve methods
of 2%. CTL can result in a significant increase in CWR for used in quantifying land impacts of energy alternatives.15 For
drought-prone areas, however. In Wyoming, the baseline and example, the land footprint of natural gas may appear small but
RFS scenarios resulted in increases of approximately 0.5 times, it may also result in extensive habitat fragmentation.49 We
whereas CTL resulted in an over 6-fold increase in water include a scenario in the Supporting Information, which
consumption compared to 2005 industrial water withdrawal. demonstrates that there are likely to be limitations to land
While the baseline and RFS scenarios require no additional availability if oil imports are reduced by one-third and biofuels
water consumption in Montana using current assumptions, the are the sole supply source. Second, cumulative effects of the
CTL scenario would result in an increase of approximately 33% growth of different sectors of the economy on overall water
over withdrawals. The key findings for the CTL case is that, consumption and land use are not considered, as the water
although the water consumption is relatively low when consumption of each scenario is compared with 2005 water
compared to withdrawals, the largest increases are in areas withdrawals. Uncertainties that are not fully explored in our
more prone to drought. analysis include the commercial availability of cellulosic
The switchgrass and shale oil scenarios were found to be the technologies, the location of deployed GTL and CTL plants,
least likely to affect drought-prone states. Switchgrass only and technological improvements, for example in shale gas and
represents a 3% increase with respect to industrial water shale oil extraction. Water consumption for all conversion
withdrawal in Wyoming. Most notably in the Corn Belt, but technologies that are not demonstrated commercially in the
also in many drought-prone states, significant water increases United States (e.g., GTL and CTL) is estimated using
result from the corn scenario if cellulosic technologies are not engineering models rather than data on actual commercial
commercial, emphasizing the fact that rain-fed switchgrass to production facilities. Finally, the discovery of new reserves,
ethanol provides a significantly less water intense alternative. particularly in the area of shale oil, could result in significant
The shale oil scenario results in small water consumption when changes to the distribution of water consumption for each
compared with the other cases as more fuel can be produced scenario. It should be noted that whether or not shale oil in
with less water. The only drought-prone state where this California can be extracted economically is still to be
scenario has a significant increase is in California with an determinedthis play is currently purported to have significant
increase of 21%, although this is still lower than the baseline reserves,30 yet production is still low. As the reserves in the
increase of 45% when compared to industrial water with- Bakken play are highly uncertain, we include a scenario where
drawals. production by play in 2022 is proportional to production by
play today (as opposed to estimated reserves) in the
4. DISCUSSION Supporting Information.
This life cycle framework, which compares the relative change Topics for future research include refining temporal and
in CWR with drought data from a regional standpoint, can be spatial resolution, applying constraints to scenarios, and
used to estimate the possible water implications of federal applying similar methods to alternative transportation options
policies and alternatives to those policies. We demonstrate this not considered in this analysis. While finer scale assessments
analytical tool using seven scenarios of possible fuel alternatives. will be an important component for regional planning, the
This framework addresses the need to incorporate spatially analysis presented here does serve to highlight areas where in-
resolved information within the life cycle assessment of water depth regional planning is likely to be warranted under each
resource impacts. Using the scenarios presented in this study, scenario. As spatial data sets for water availability and
water impacts of the RFS were examined in comparison to consumption improve, this approach can provide a powerful
alternative options for reducing oil imports for the trans- tool to more precisely identify areas where there could be
portation sector. This can inform policymakers with a strategic potential bottlenecks for water availability at smaller spatial
overview of regional impacts of the RFS and its alternatives. scales. An initiative is currently underway that will develop a
Supporting previous findings, corn ethanol from dry milling GIS data set representing water budgets by watershed.50 Using
was found to have significantly greater overall water such data, constraints to energy resource development can be
consumption than other liquid transportation options, primarily better quantified at smaller scales, allowing policymakers to
due to crop irrigation. In the corn scenario, we show high CWR identify where coordination is most important. A recent study
in drought-prone states. The largest increases are in states that examined six scenarios for cellulosic ethanol from Miscanthus,
are not drought-prone but have a magnitude so great that there where life cycle greenhouse gases were quantified under
may be limitations regardless. From the broadest perspective, economic, land, and water constraints.51
11982 dx.doi.org/10.1021/es404130v | Environ. Sci. Technol. 2013, 47, 11976−11984Environmental Science & Technology Policy Analysis
Finally, options requiring large changes to the vehicle fleet or nature, such as those to water and land resources. Water and
distribution infrastructure may reveal additional limitations land requirements may ultimately constrain energy security
and/or opportunities for the future of transportation fuels. goals if based on biofuels, indicating a need to better
Future research could examine how water consumption in understand and balance environmental trade-offs. Our
these scenarios compares with the other options available to approach provides but one piece of the puzzle and provides a
power the transportation sector, such as electric vehicles and tool that can allow policymakers to strategically shape the
compressed natural gas. Compressed natural gas will rely only implementation of future transportation fuel production to
on upstream water consumed in hydraulic fracturing, which is minimize regional effects.
small when compared to other options. Electrification, while it
has been found to have water consumption similar to that of
shale oil to liquids, can have water withdrawals on the same
■
*
ASSOCIATED CONTENT
S Supporting Information
order of magnitude as biofuels.14 A more detailed analysis of Additional information as noted in the text. This material is
electrification should focus on both withdrawals and con- available free of charge via the Internet at http://pubs.acs.org.
■
sumptive use and should include an examination of the trend to
heavier reliance on combined cycle gas turbines for electricity
AUTHOR INFORMATION
generation. Fuel economy is naturally a significant portion of
increasing energy security and will continue to play a large role Corresponding Author
in policy heading into the future. *(S.M.J.) E-mail: smjordaa@ucalgary.ca.
Our approach is an improvement over aspatial models as it Notes
provides policymakers with a tool for planning over various The authors declare no competing financial interest.
■
temporal and spatial scales, facilitating a better integration
between federal policies with regional planning. For example, ACKNOWLEDGMENTS
those advising the legislative branch should produce such
analyses to assist policymakers in strategically managing the We thank researchers from the Energy Technology Innovation
regional implications of their policies. While we do not claim Policy Group for their helpful feedback. We also thank Tess
these results will predict the exact regional outcome of federal Williams for the assistance she provided in the data collection
policies, this tool can be used to develop inter- and intrastate for the shale oil scenario. We are most grateful for the funding
strategies to attenuate impacts; for example, strategic placement received from BP and the Science Technology and Public
of new capacity, inclusion of more flexibility in fuel choice to Policy Program of the Belfer Center for Science and
meet policy targets, or use of improved technologies. Future International Affairs at the Harvard Kennedy School of
scenarios should be run in concert with federal agencies such as Government, Harvard University. Sarah Jordaan undertook
the Department of Energy and the Environmental Protection the analysis as a fellow at the Belfer Center and completed the
research as Assistant Professor at the University of Calgary.
■
Agency, and state water managers to determine how to manage
regional trade-offs associated with federal energy policy.
Informative conclusions can be drawn using current assump- REFERENCES
tions which can be used to shape the future of fuel production (1) Frequently Asked Questions, US Energy Information Admin-
such that stress to water supply can be minimized. Water istration. http://www.eia.gov/tools/faqs/faq.cfm?id=32&t=6.
managers in drought-prone states with large expected increases (2) President Obama Sets Goal to Reduced Imports by One Third,
US Department of Energy. http://www1.eere.energy.gov/cleancities/
in water consumption could apply restrictions based on in-
news_detail.html?news_id=16858.
streamflow needs. As the spatial resolution of data sets on water (3) A USDA Regional Roadmap to Meeting the Biofuels Goals of the
budgets improve, this framework can provide increasingly Renewable Fuels Standard by 2022; US Department of Agriculture:
significant strategic insight into the possible local impacts Washington DC, 2012; http://www.usda.gov/documents/USDA_
inherent to different energy choices, whether or not policy Biofuels_Report_6232010.pdf.
goals can be achieved, and the way in which societal goals can (4) Renewable Fuel Standard; Environmental Protection Agency.
be attained by designing or modifying a policy. http://www.epa.gov/otaq/fuels/renewablefuels/index.htm.
Results of our analysis suggest that there may be significant (5) Renewable Fuel Standard (RFS): Overview and Issues; Congres-
consumptive water and land impacts associated with energy sional Research Service: Washington DC, 2012; http://www.
security goals relying on liquid fuel substitutes derived from nationalaglawcenter.org/assets/crs/R40155.pdf
(6) Renewable Fuel Standard, 2010 and Beyond; Environmental
biofuels. Due to the inherently local nature of land and water Protection Agency: Washington DC, 2010; http://www1.eere.energy.
impacts, policy goals must move toward incorporating spatial gov/cleancities/toolbox/pdfs/renewable_fuel_standard_program--
and temporal considerations at increasingly finer scales. At 2010_and_beyond.pdf
these finer scales and in future research more broadly, it may be (7) USDA Biofuels Strategic Production Report. U.S. Department of
valuable to expand the quantification of consumption to include Agriculture: Washington DC, 2012; http://www.usda.gov/
the additional water consumed through photosynthetic and documents/USDA_Biofuels_Report_6232010.pdf.
evapotranspiration processes. While our framework provides (8) Energy Independence and Security Act of 2007. Public Law
policymakers with a consistent approach for understanding the Section 202, H.R. 6-30 to H.R. 6-37. http://frwebgate.access.gpo.gov/
possible regional water- and land-use impacts of a policy, it cgi-bin/getdoc.cgi?dbname=110_cong_bills&docid=f:h6enr.txt.pdf
(9) Searchinger, T.; Heimlich, R.; Houghton, R. A.; Dong, F. Land
does not answer the question of how to weigh in different
use change greenhouse gases through emissions from use of U.S.
environmental factors (e.g., greenhouse gas emissions versus croplands for biofuels increases. Science 2008, 319, 1238−1240.
water consumption and withdrawal versus water quality), which (10) O’Hare, M.; Plevin, R. J.; Martin, J. I.; Jones, A. D.; Kendall, A.;
is more of a political decision. The overall goal should be to Hopson, E. Proper accounting for time increases crop-based biofuels’
recognize not only the global goals of attenuating climate greenhouse gas deficit versus petroleum. Environ. Res. Lett. 2009, 4 (2),
change but also the trade-offs with impacts more local in 024001.
11983 dx.doi.org/10.1021/es404130v | Environ. Sci. Technol. 2013, 47, 11976−11984Environmental Science & Technology Policy Analysis
(11) The Future of Natural Gas: An Interdisciplinary MIT Study (32) Farm and irrigation survey, Table 28: Estimated Quantity of
Interim Report; Massachusetts Institute of Technology: Cambridge, Water Applied and Primary Method of Distribution by Selected Crops
MA, 2010; web.mit.edu/mitei/research/studies/report-natural-gas.pdf. Harvested: 2008 and 2003. US Department of Agriculture,
(12) Yeh, S. An empirical analysis on the adoption of alternative fuel Washington DC, 2012. http://www.agcensus.usda.gov/Publications/
vehicles: The case of natural gas vehicles. Energy Policy 2007, 35 (11), 2007/Online_Highlights/Farm_and_Ranch_Irrigation_Survey/index.
5865−5875. asp
(13) Obama Administration Finalizes Historic 54.5 MPG Fuel (33) Kim S.; Dale B. E. Allocation Procedure in Ethanol Production
Efficiency Standards, the White House. http://www.whitehouse.gov/ System from Corn Grain, Int. J. LCA, OnlineFirst, LCA Case Studies,
the-press-office/2012/08/28/obama-administration-finalizes-historic- 2002.
545-mpg-fuel-efficiency-standard (34) Wu, M.; Mintz, M.; Wang, M.; Arora, S. Consumptive Water Use
(14) Impacts on U.S. Energy Expenditures and Greenhouse-Gas in the Production of Ethanol and Petroleum Gasoline, ANL/ESD/09-1;
Emissions of Increasing Renewable-Energy Use. RAND Corporation: Argonne National Laboratory, Center for Transportation Research,
Boston MA, 2008; http://www.rand.org/pubs/technical_reports/ Energy Systems Division, 2009;
2008/RAND_TR384-1.pdf (35) Spieght, J. G. Synthetic Fuels Handbook; McGraw-Hill: New
(15) English, B C.; De La Torre Ugarte, D. G.; Jensen, K.; York, 2009.
Hellwinckel, C.; Menard, J.; Wilson, B.; Roberts, R.; Walsh, M. 25% (36) Wu, M.; Mintz, M.; Wang, M.; Arora, S. Consumptive Water Use
Renewable Energy for the United States by 2025: Agricultural and in the Production of Ethanol and Petroleum Gasoline, Report ANL/ESD/
Economic Impacts; University of Tennessee, Institute of Agriculture, 09-1; Argonne National Laboratory, Center for Transportation
2006; http://www.agpolicy.org/ppap/REPORT%2025x25.pdf Research, Energy Systems Division, 2009; http://www.
(16) King, C.; Webber, M. Water intensity of transportation. Environ. transportation.anl.gov/pdfs/AF/557.pdf
Sci. Technol. 2008, 42 (21), 866−7872. (37) HPDI. http://info.drillinginfo.com/category/hpdi-2/
(17) Reap, J.; Roman, F.; Duncan, S.; Bras, B. A survey of unresolved (38) Clark, C. E.; Veil, J. A. Produced Water Vol.s and Management
problems in life cycle assessment: Part 1: Goal and scope and Practices in the United States. United States Department of Energy,
inventory analysis. Int. J. Life Cycle Assess. 2008, 13, 290−300. Argonne National Laboratory ANL/EVS/R-09/1, 2009. www.evs.anl.
(18) Jordaan, S. M. Land and water impacts of oil sands production gov/pub/doc/ANL_EVS__R09_produced_water_volume_report_
in Alberta. Environ. Sci. Technol. 2012, 46 (7), 3611−3617, 2437.pdf
DOI: 10.1021/es203682m. (39) Jiang, M.; Griffin, W. M.; Hendrickson, C.; Jaramillo, P.; Van
(19) McKone, T. E.; Nazaroff, W. W.; Berck, P.; Auffhammer, M.; Briesen, J.; Venkatesh, A. Life cycle greenhouse gas emissions of
Lipman, T.; Torn, M. S.; Masanet, E.; Lobscheid, A.; Santero, N.; Marcellus shale gas. Environ. Res. Lett. 2011, 6, 3.
Mishra, U.; Barrett, A.; Bomberg, M.; Fingerman, K.; Scown, C.; (40) Jiang, M.; Griffin, W. M.; Hendrickson, C.; Jaramillo, P.;
Strogen, B.; Horvath, A. Grand challenges for life-cycle assessment of VanBriesen, J.; Venkatesh, A. Life cycle greenhouse gas emissions of
biofuels. Environ. Sci. Technol. 2011, 45, 1751−1756. Marcellus Shale gas. Environ. Res. Lett. 2011, 6, 034014.
(20) Scown, C. D.; Horvath, A.; McKone, T. E. Water footprint of (41) Marano, J. J.; Ciferno, J. P. Life-Cycle Greenhouse-Gas Emissions
U.S. transportation fuels. Environ. Sci. Technol. 2011, 45, 2541−2553. Inventory for Fischer−Tropsch Fuels; National Energy Technology
(21) Pfister et al. Assessing the environmental impacts of freshwater Laboratory: Pittsburgh, PA, 2001.
consumption in LCA. Environ. Sci. Technol. 2009, 43, 4098−4104. (42) Gleick, P. H. Water and Energy. Annu. Rev. Energy Environ.
(22) Dominguez-Faus, R.; Powers, S. E.; Burken, J. G.; Alvarez, P. J.. 1994, 19 (1), 267−299.
The water footprint of biofuels: A drink or drive issue? Environ. Sci. (43) Review of emerging resources: US shale gas and shale oil plays.
Technol. 2009, 43, 3005−3010. Energy Information Administration: Washington DC, 2011; ftp://ftp.
(23) Pfister, S.; Bayer, P.; Koehler, A.; Hellweg, S. Environmental eia.doe.gov/natgas/usshaleplays.pdf.
impacts of water use in global crop production: Hotspots and trade- (44) Refinery Capacity Report 2011. Energy Information Admin-
offs with land use. Environ. Sci. Technol. 2011, 45 (13), 5761−5768. istration: Washington DC, 2011; http://205.254.135.24/petroleum/
(24) Mishra and Yeh. Life cycle water consumption and withdrawal refinerycapacity/ Last accessed March 15 2012
requirements of ethanol from corn grain and residues. Environ. Sci. (45) Refinery Yield; Energy Information Administration: Washington
Technol. 2011, 45 (10), 4563−4569. DC, 2012; http://www.eia.gov/dnav/pet/pet_pnp_pct_dc_nus_pct_
(25) Owens, J. W. Water resources in life-cycle impact assessment: m.htm (accessed March 15, 2012)
Considerations in choosing category indicators. J. Ind. Ecol. 2001, 5 (46) Kenny, J. F.; Barber, N. L.; Hutson, S. S., Linsey, K. S.; Lovelace,
(2), 37−54. J. K.; Maupin, M. A. Estimated Use of Water in the United States in 2005,
(26) Bayart, J.; Bulle, C.; Deschênes, L.; Margni, M.; Pfister, S.; Circular 1344; U.S. Geological Survey, 2009.
Vince, F.; Koehler, A. A framework for assessing off-stream freshwater (47) NOAA Satellite and Information Service. 2012. www7.ncdc.
use in LCA. Int. J. Life Cycle Assess. 2010, 15 (5), 439−453. noaa.gov/CDO/CDODivisionalSelect.jsp# (accessed March 15, 2012)
(27) Canals, L.; Chenoweth, J.; Chapagain, A.; Orr, S.; Antón, A.; (48) www.fas.org/sgp/crs/misc/RL34580.pdf
Clift, R. Assessing freshwater use impacts in LCA: Part IInventory (49) Jordaan, S. M.; Keith, D. W.; Stelfox, B. Quantifying land use of
oil sands production: A life cycle perspective. Environ. Res. Lett. 2009,
modelling and characterisation factors for the main impact pathways.
4, 024004.
Int. J. Life Cycle Assess. 2009, 14 (1), 28−42.
(50) The National Water Census. US Geological Survey, 2012.
(28) USDA. 2007 CENSUS OF AGRICULTURE, Table 8, 2008,
http://water.usgs.gov/wsi/index.html. (accessed March 19, 2012)
USDA, National Agricultural Statistics. http://www.agcensus.usda.
(51) Scown, C. D.; Nazaroff, W. W.; Mishra, U.; Strogen, B.;
gov/Publications/2007/Online_Highlights/Farm_and_Ranch_
Lobscheid, A. B.; Masanet, E.; Santero, N. J.; Horvath, A.; McKone, T.
Irrigation_Survey/fris08_1_28.pdf
E. Lifecycle greenhouse gas implications of US national scenarios for
(29) World Agriculture: Towards 2015/2030: An FAO Perspective;
cellulosic ethanol production. Environ. Res. Lett. 2012, DOI: 10.1088/
Food and Agrocultural Organization; Earthscan: London UK, 2003;
1748-9326/7/1/014011.
■
http://www.fao.org/fileadmin/user_upload/esag/docs/y4252e.pdf.
(30) Building Bridges to a More Sustainable Future-2011 Ethanol
Industry Outlook; Renewable Fuels Association: Washington DC,
NOTE ADDED AFTER ASAP PUBLICATION
2006; http://www.ethanolrfa.org/page/-/ The last sentence of the first paragraph in the Introduction
2011%20RFA%20Ethanol%20Industry%20Outlook.pdf?nocdn=1 section was in error in the version of this paper published
(31) Water Implications of Biofuels Production in the United States, October 9, 2013. The correct version published October 15,
Water Science and Technology Board; National Academies Press. 2013.
Washington D.C., 2008.
11984 dx.doi.org/10.1021/es404130v | Environ. Sci. Technol. 2013, 47, 11976−11984You can also read