Regional data sets of high-resolution (1 and 6 km) irrigation estimates from space
←
→
Page content transcription
If your browser does not render page correctly, please read the page content below

Earth Syst. Sci. Data, 15, 1555–1575, 2023
https://doi.org/10.5194/essd-15-1555-2023
© Author(s) 2023. This work is distributed under
the Creative Commons Attribution 4.0 License.

             Regional data sets of high-resolution (1 and 6 km)
                      irrigation estimates from space
              Jacopo Dari1,2 , Luca Brocca2 , Sara Modanesi2 , Christian Massari2 , Angelica Tarpanelli2 ,
          Silvia Barbetta2 , Raphael Quast3 , Mariette Vreugdenhil3 , Vahid Freeman4 , Anaïs Barella-Ortiz5 ,
                              Pere Quintana-Seguí5 , David Bretreger6 , and Espen Volden7
                1 Department    of Civil and Environmental Engineering, University of Perugia, Perugia, Italy
              2 Research  Institute for Geo-Hydrological Protection, National Research Council, Perugia, Italy
                       3 Department of Geodesy and Geoinformation, Research Unit Remote Sensing,

                                 Vienna University of Technology (TU Wien), Vienna, Austria
                              4 Earth Intelligence, Spire Global, 2763 Luxembourg, Luxembourg
                   5 Observatori de l’Ebre (OE), Ramon Llull University – CSIC, 43520 Roquetes, Spain
            6 School of Engineering, The University of Newcastle, Callaghan, New South Wales 2308, Australia
                                        7 European Space Agency, ESRIN, Frascati, Italy

                                    Correspondence: Jacopo Dari (jacopo.dari@unipg.it)

                                 Received: 21 November 2022 – Discussion started: 9 December 2022
                           Revised: 28 February 2023 – Accepted: 16 March 2023 – Published: 5 April 2023

      Abstract. Irrigation water use represents the primary source of freshwater consumption by humans. The amount
      of water withdrawals for agricultural purposes is expected to further increase in the upcoming years to face the
      rising world population and higher living standards. Hence, effective plans for enacting a rational management
      of agricultural water use are urgent, but they are limited by knowledge gaps about irrigation. Detailed infor-
      mation on irrigation dynamics (i.e., extents, timing, and amounts) is generally lacking worldwide, but satellite
      observations can be used to fill this gap.
         This paper describes the first regional-scale and high-resolution (1 and 6 km) irrigation water data sets obtained
      from satellite observations. The products are developed over three major river basins characterized by varying
      irrigation extents and methodologies, as well as by different climatic conditions. The data sets are an outcome of
      the European Space Agency (ESA) Irrigation+ project. The irrigation amounts have been estimated through the
      SM-based (soil-moisture-based) inversion approach over the Ebro river basin (northeastern Spain), the Po valley
      (northern Italy), and the Murray–Darling basin (southeastern Australia). The satellite-derived irrigation prod-
      ucts referring to the case studies in Europe have a spatial resolution of 1 km, and they are retrieved by exploiting
      Sentinel-1 soil moisture data obtained through the RT1 (first-order Radiative Transfer) model. A spatial sampling
      of 6 km is instead used for the Australian pilot area, since in this case the soil moisture information comes from
      CYGNSS (Cyclone Global Navigation Satellite System) observations. All the irrigation products are delivered
      with a weekly temporal aggregation. The 1 km data sets over the two European regions cover a period ranging
      from January 2016 to July 2020, while the irrigation estimates over the Murray–Darling basin are available for the
      time span April 2017–July 2020. The retrieved irrigation amounts have been compared with benchmark rates col-
      lected over selected agricultural districts. Results highlight satisfactory performances over the major part of the
      pilot sites falling within the two regions characterized by a semiarid climate, namely, the Ebro and the Murray–
      Darling basins, quantified by median values of RMSE, Pearson correlation r, and bias equal to 12.4 mm/14 d,
      0.66, and −4.62 mm/14 d, respectively, for the Ebro basin and to 10.54 mm/month, 0.77, and −3.07 mm/month,
      respectively, for the Murray–Darling basin. The assessment of the performances over the Po valley is affected
      by the limited availability of in situ reference data for irrigation. The developed products are made available to
      the scientific community for use and further validation at https://doi.org/10.5281/zenodo.7341284 (Dari et al.,
      2022a).

Published by Copernicus Publications.
1556                                                                             J. Dari et al.: Irrigation estimates from space

1   Introduction                                                   finer modeling of crop evapotranspiration. The approach was
                                                                   successfully applied over heavily irrigated areas located in
                                                                   northeastern Spain. In that case, input soil moisture data from
Human activities are deeply modifying the natural hydrolog-        the 1 km resolution DISPATCH (DISaggregation based on
ical cycle, as they affect water storage and relocation dynam-     Physical And Theoretical scale CHange; Merlin et al., 2013)
ics. Among the anthropogenic water uses, the agricultural          downscaled SMOS and SMAP products were used. Dari et
one (mainly constituted of water applied for irrigation) pre-      al. (2022c) further studied the role of the evapotranspiration
vails. More than 70 % of surface and subsurface water with-        component within the SM-based inversion algorithm and in-
drawals worldwide are destined for irrigation practices (Fo-       troduced the interesting perspective of a configuration forced
ley et al., 2011; Dorigo et al., 2021). In the near future, the    with remotely sensed data only. The SM-based inversion ap-
pressure exerted on water resources to foster irrigation is ex-    proach is not the only method relying on soil moisture data
pected to be further exacerbated to face the global challenge      to estimate irrigation existing in literature. Another exam-
represented by the increasing food demand due to the popu-         ple is represented by the SM-delta (soil-moisture-delta) al-
lation growth under climate warming scenarios (Hunter et al.,      gorithm, first proposed by Zaussinger et al. (2019). The ap-
2017; Ferguson et al., 2018). Hence, strategies aimed at a ra-     proach is based on the discrepancies between satellite and
tional management of agricultural water are essential for sev-     modeled soil moisture, which, over agricultural areas, can be
eral environmental, economic, and social reasons, as well as       attributed to irrigation signals. The method was later updated
to comprehensively characterize the hydrological cycle over        by Zappa et al. (2021), who added terms accounting for evap-
anthropogenic basins. Nevertheless, irrigation practices are       otranspiration and drainage fluxes to the algorithm. This new
scarcely monitored worldwide, thus creating the paradoxical        configuration was applied over agricultural fields in north-
situation for which the largest human intervention on the wa-      ern Germany; high-resolution (500 m) soil moisture observa-
ter cycle is mostly unknown.                                       tions from Sentinel-1 were used, and an agreement between
   Remote sensing technology offers unprecedented oppor-           estimated irrigation amounts and benchmark rates quantified
tunities for answering the following research question: how        by an average Pearson correlation equal to 0.64 was found.
much water is used for irrigation? More specifically, re-          The SM-delta was recently applied in synthetic and real-
motely sensed observations of soil moisture and evapotran-         world experiments to highlight the mutual effects of vary-
spiration are particularly suitable for the development of irri-   ing satellite soil moisture temporal and spatial resolutions
gation quantification techniques, as demonstrated by a num-        on the accuracy of the retrieved irrigation amounts (Zappa
ber of recent studies implementing evapotranspiration-based        et al., 2022). Finally, data assimilation (DA) techniques ex-
(see, for example, Romaguera et al., 2014; Van Eekelen et          ploiting remote sensing soil moisture can also be used in
al., 2015; Peña-Arancibia et al., 2016; Brombacher et al.,         irrigation quantification studies to balance modeling defi-
2022) and soil-moisture-based (see, for example, Brocca et         ciencies and correct unrealistic assumptions. Indeed, models
al., 2018; Jalilvand et al., 2019; Zaussinger et al., 2019; Dari   have recently seen improvements in irrigation parameteriza-
et al., 2020, 2022c; Zappa et al., 2021; Zhang et al., 2022)       tion (Ozdogan et. al., 2010; Lawston et al., 2015; Nie et al.,
approaches. Brocca et al. (2018) first proposed an irrigation      2018). However, some studies (e.g., Modanesi et al., 2021b)
quantification methodology relying on the inversion of the         have highlighted that the performance of LSM (land surface
satellite soil moisture signal, currently known as the SM-         model) irrigation simulations are negatively affected by sim-
based (soil-moisture-based) inversion approach. The feasi-         plified assumptions in model parameterizations, as well as
bility of estimating irrigation rates through coarse-resolution    by unrealistic/out-of-date input information (e.g., lack of dy-
soil moisture data from AMSR2 (Advanced Microwave                  namic crop maps). DA can reduce models’ uncertainties by
Scanning Radiometer 2), ASCAT (Advanced SCATterom-                 merging model systems with satellite observations, which
eter), SMAP (Soil Moisture Active Passive), and SMOS               can track human-induced processes. In particular, Lawston
(Soil Moisture and Ocean Salinity) was demonstrated, even          et al. (2017) suggested the use of SMAP surface soil mois-
though limitations due to the low spatial resolution of the in-    ture retrievals to incorporate the irrigation signal into models
put data sets were pointed out. Later on, the methodology          via DA, and more recently Jalilvand et al. (2021) exploited
was implemented by Jalilvand et al. (2019) over a semiarid         the potential of SMAP/Sentinel-1 retrievals (Das et al., 2019)
region of Iran by exploiting AMSR2, ASCAT, and SMOS                for the same purpose. In this context, Abolafia-Rosenzweig
soil moisture data. In this study, the non-negligible con-         et al. (2019) designed a particle batch smoother DA sys-
tribution of evapotranspiration in properly reproducing ir-        tem for remote-sensing-based soil moisture assimilation into
rigation amounts was highlighted. This result was corrob-          the VIC (Variable Infiltration Capacity) model (Liang et al.,
orated by Dari et al. (2020), who further developed the            1994) to estimate irrigation amounts. An alternative way to
method by implementing the guidelines provided by the FAO          assimilate satellite observations is to directly ingest level-1
(Food and Agriculture Organization) paper 56 (Allen et al.,        observations (i.e., brightness temperature or radar backscat-
1998) within the SM-based inversion algorithm to develop a

Earth Syst. Sci. Data, 15, 1555–1575, 2023                                         https://doi.org/10.5194/essd-15-1555-2023
J. Dari et al.: Irrigation estimates from space                                                                               1557

ter) instead of retrievals (De Lannoy and Reichle, 2016a, b;       Darling basin (∼ 1 000 000 km2 ) in Australia. According to
Lievens et al., 2017a, b; Modanesi et al., 2022). In particular,   the Köppen–Geiger climate classification (Beck et al., 2018)
Modanesi et al. (2022) assimilated 1 km Sentinel-1 backscat-       provided in Fig. 1, the Ebro basin is mainly characterized
ter (γ 0 ) observations into the Noah-MP LSM, equipped with        by a cold semiarid climate (BSk), but in its upper part there
a sprinkler irrigation scheme into the National Aeronautics        are also areas with oceanic climate (Cfb). The Po river val-
and Space Administration (NASA) Land Information System            ley mainly falls within the humid subtropical climatic zone
(LIS) framework for the update of both surface soil moisture       (Cfa), while the Murray–Darling basin is mainly subject to
and vegetation states. The authors found that DA improves          hot and cold semiarid climatic areas (BSh and BSk, respec-
the bias of irrigation simulation although limitations mainly      tively); desert climate (BWh) is also present for a minor ex-
due to irrigation model parameterization still need further im-    tent.
provement.                                                            The Ebro basin is the largest Mediterranean basin of Spain
   The high-resolution observations of the most recent satel-      and a major Mediterranean basin in Europe. Precipitation is
lite technologies open unprecedented perspectives in the ir-       unevenly distributed, being higher in the mountainous re-
rigation quantification activity. As pointed out in Peng et        gions, where it can reach 1800 mm yr−1 , and lower in the
al. (2021), the optimal spatial resolution for monitoring agri-    central valley, with values below 500 mm yr−1 . Therefore,
cultural practices is less than or equal to 1 km. This is par-     to irrigate agricultural areas, mainly located in the central
ticularly true in the Mediterranean area, where the nominal        valley, there is an extensive network of dams and canals to
size of the agricultural fields makes the adoption of high-        transport water from the mountains to these regions. For in-
resolution data necessary (Dari et al., 2022b).                    stance, the total dam capacity is approximately 8000 hm3
   This study is aimed at presenting three regional-scale,         (PHE1 2015–2021). Focusing on agriculture, the most rep-
high-resolution irrigation data sets developed through the         resentative herbaceous crops are alfalfa, corn, barley, wheat,
SM-based inversion approach within the European Space              and rice, while the most widespread tree crops are peach
Agency (ESA) Irrigation+ project (https://esairrigationplus.       and pear trees, vineyards, and olive groves. In order to sat-
org/, last access: 3 April 2023). The irrigation products have     isfy the average agricultural annual demand, quantified as
been developed for two European regions, namely, the Ebro          7623 hm3 yr−1 , an area of almost 9660 km2 is conceded for
basin (Spain) and the Po valley (Italy), as well as for the        irrigated surface over the basin.
Murray–Darling basin (Australia). Both data sets referring            The Po valley is part of the Po river basin, the longest river
to the Mediterranean area rely on input soil moisture from         in Italy. It is a critical hotspot for studying the impact of hu-
the RT1 (first-order Radiative Transfer) Sentinel-1 data set       man activities on the water cycle, considering the key role
(Quast et al., 2019), are delivered over a 1 km regular grid,      of the agricultural production and the increasing frequency
and cover the period ranging from January 2016 to the end          of severe drought events over this area (Strosser et al., 2012;
of July 2020. For the Australian sites, Spire’s soil moisture      Ceppi et al., 2014; Formetta et al., 2022). The northern side
product retrieved from NASA’s CYGNSS (Cyclone Global               of the valley has a higher water availability compared to the
Navigation Satellite System) satellite data (Freeman et al.,       southern side, thanks to the presence of several Alpine reser-
2020) has been used instead; irrigation estimates are sam-         voirs (Musolino et al., 2017). In the south, the Emilia Ro-
pled over a 6 km regular grid, and the temporal coverage is        magna region is poorer in storage capacity, but it is served by
from April 2017 to July 2020. All the products are delivered       one of the most important Italian hydraulic systems for irri-
with a weekly temporal aggregation. Even though an assess-         gation applications, the Canale Emiliano Romagnolo (CER,
ment of the product’s performances is provided by exploit-         https://consorziocer.it/it/, last access: 1 December 2022). The
ing benchmark irrigation amounts over selected sites, the au-      size and spatial extent of the irrigated fields and districts
thors’ main goal is to make the data sets publicly available       in the Po valley are often not homogeneous, and agricul-
as they can be used and further validated by the scientific        tural plots are characterized by small extents due to com-
community. The proposed irrigation estimates represent an          plex historical processes (Massari et al., 2021). The main
important step towards the implementation of an operational        cultivated crops include general summer and winter crops,
system for high-resolution irrigation water monitoring from        orchards, olive groves, and vineyards (https://sites.google.
satellite observations.                                            com/arpae.it/servizio-climatico-icolt/home?authuser=0, last
                                                                   access: 1 December 2022).
                                                                      The Murray–Darling basin is often considered the food
2   Pilot areas                                                    bowl of Australia, covering over 1 000 000 km2 or approxi-
                                                                   mately 14 % of Australia and accounts for over two-thirds of
The irrigation products have been developed over three re-
gions highly influenced by irrigation practices. They are             1 Ministerio de Agricultura, Alimentación y Medio Ambiente,
the Ebro river basin (∼ 86 000 km2 ) in Spain; the Po valley       Confederación Hidrográfica del Ebro: Plan Hidrológico de la parte
(∼ 78 000 km2 ) in Italy, which includes the Po river basin        española de la demarcación hidrográfica del Ebro 2015–2021. v2.6
and part of the Emilia-Romagna region; and the Murray–             Memoria, 2015.

https://doi.org/10.5194/essd-15-1555-2023                                         Earth Syst. Sci. Data, 15, 1555–1575, 2023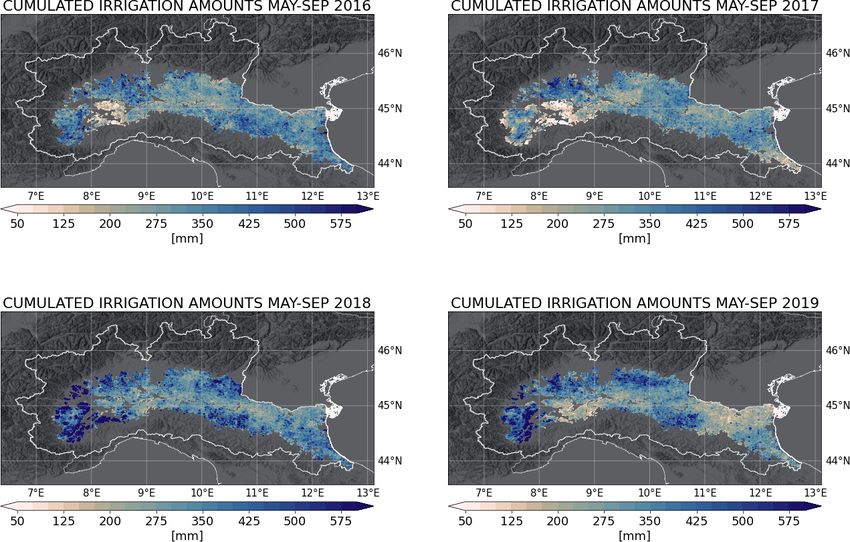
1558                                                                                J. Dari et al.: Irrigation estimates from space

all of Australia’s irrigation water use. There has been a cap        Before running the algorithm, the noise in the soil mois-
on diversions since 1995 to help manage over allocation and          ture signal is reduced by computing the Soil Water Index
extraction in the basin. The basin is often subject to extreme       (SWI) according to the exponential filter proposed by Al-
droughts such as the Millennium Drought (2001–2009) (van             bergel et al. (2008). Once the total amount of water entering
Dijk et al., 2013) and more recently the 2017–2019 drought.          into the soil is quantified, it is possible to obtain the irriga-
There is typically more irrigation in the southern side of the       tion rate by removing the rainfall from the output of Eq. (3),
basin, which is facilitated by major storage capacities in the       i(t) = Win(t) − r(t); negative irrigation rates (if any) are set
region. Irrigated properties are often fragmented in nature          to zero (Jalilvand et al., 2019). In order to remove negligi-
and contain a wide range of crops that are suited to the vastly      ble irrigation amounts attributable to random errors, the re-
different conditions that are observed across such a large           sults are discarded if the ratio between weekly estimated ir-
basin. Both surface water and groundwater are used across            rigation and weekly rainfall is lower than 0.2. Weekly irri-
the basin with groundwater use mainly associated with ma-            gation estimates covering the time span from January 2016
jor alluvial systems.                                                to July 2020 have been produced for the Ebro basin and
                                                                     the Po river valley. Over the Murray–Darling basin, weekly
3     Materials and methods                                          irrigation amounts have been retrieved by considering the
                                                                     period from April 2017 to July 2020. A regular 1 km grid
3.1    The SM-based inversion approach                               has been adopted for the Spanish and the Italian case study,
                                                                     while a 6 km sampling has been used for the Australian pi-
Regional-scale irrigation products have been developed               lot basin. For each region, the irrigation amounts have been
through the SM-based inversion approach (Brocca et al.,              estimated over agricultural areas only. For the Ebro and Po
2018; Dari et al., 2020, 2022c). The method relies on the            regions, such information has been derived by the 25 m reso-
inversion of the soil moisture signal for backward estimating        lution Corine Land Cover data set referring to the year 2018
the total amount of water entering into the soil, which, over        (CLC2018), while for the Murray–Darling basin the 300 m
agricultural areas, is determined by rainfall plus irrigation.       spatial resolution ESA CCI (Climate Change Initiative) land
The approach is based on the soil water balance, expressed           cover map for the year 2018 has been exploited.
by                                                                      The parameters a, b, Z ∗ , and F of Eq. (3) are calibrated by
    dS (t)                                                           implementing the iterative procedure summarized in Fig. 2.
Z∗         = i (t) + r (t) − g (t) − sr (t) − e (t) ,        (1)
      dt                                                             First, the algorithm is run by masking out days with no rain-
where Z ∗ [mm] indicates the water capacity of the soil layer        fall rate during the irrigation seasons (hence, potential ir-
– calculated as the product between the depth of the soil layer      rigation days). This first step involves the calibration of a,
and the porosity, S(t) [–] is the relative soil moisture (i.e.,      b, and Z ∗ parameters that are optimized by minimizing the
ranging between 0 and 1), t [d] indicates the time, i(t) is the      root-mean-square difference (RMSD) against reference rain-
irrigation rate [mm d−1 ], r(t) [mm d−1 ] is the rainfall rate,      fall rates. During this phase, implemented for each pixel, the
g(t) [mm d−1 ] indicates the drainage term, sr(t) [mm d−1 ] is       evapotranspiration adjustment factor, F , is assumed equal to
the surface runoff, and e(t) [mm d−1 ] represents the evapo-         1. Then, F is calibrated against the sum of rainfall plus irriga-
transpiration rate. Equation (1) is equivalent to the following:     tion over selected pilot sites where irrigation rates are known.
                                                                     At this point, the calibrated F value is compared with the
              dS (t)
Win (t) = Z ∗        + g (t) + sr (t) + e (t) ,               (2)    first guess (F = 1), and, in case of disagreement, the values
                dt                                                   of a, b, and Z ∗ are recalibrated by repeating the first step
with Win(t) indicating the algorithm output, i.e., the total         and adopting the updated F value. In this way, the effects
amount of water entering into the soil. The drainage term            of adopting for rainfed agricultural areas the same F value
can be linked to soil moisture according to the power-law            calibrated where irrigation occurs are compensated. It is im-
equation g (t) = aS(t)b , in which a and b are drainage pa-          portant to highlight that the calibration of a, b, and Z ∗ is
rameters (Famiglietti and Woods, 1994; Brocca et al., 2014).         spatially distributed; hence, such values differ pixel by pixel.
As demonstrated in previous studies, the sr(t) term can be ne-       Conversely, the calibration of F can be only implemented
glected (Brocca et al., 2015; Jalilvand et al., 2019), since irri-   over selected sites where irrigation rates are known and for
gation water either infiltrates or evaporates. The actual evap-      this reason spatially aggregated time series must be used. The
otranspiration term is computed as the potential rate, PET(t),       period 2016–2017 has been considered for the calibration
limited by the available water content: e(t) = F ·S(t)·PET(t);       procedure over the Ebro basin and the Po valley, while for
an adjustment factor, F , ranging between 0.6 and 1.4 and            the Murray–Darling catchment the time span ranging from
aimed at accounting for uncertainties linked to the coarse res-      April 2017 to the end of 2018 has been adopted. The F pa-
olution of the input PET rates is adopted (Modanesi et al.,          rameter has been calibrated over three districts in the Ebro
2021a). Hence, Eq. (2) can be simplified as                          basin, both pilot districts in the Po river valley, and three dis-
                dS (t)                                               tricts in the Murray–Darling basin. For each region, the areal-
Win (t) = Z ∗          + aS(t)b + F · S (t) · PET (t) .       (3)    weighted average of the F values has been then adopted for
                 dt

Earth Syst. Sci. Data, 15, 1555–1575, 2023                                            https://doi.org/10.5194/essd-15-1555-2023
J. Dari et al.: Irrigation estimates from space                                                                                       1559

Figure 1. Location of the pilot areas and their climatic characteristics according to the Köppen–Geiger classification. The Ebro basin and
the Po valley are indicated by the numbers 1 and 2, respectively. The Murray–Darling basin is identified by the number 3. The predominant
classes on the pilot areas are cold semiarid climate (BSk) and oceanic climate (Cfb) for the Ebro basin, humid subtropical climate (Cfa) for
the Po valley, and hot and cold semiarid climates (BSh and BSk, respectively), as well as desert climate (BWh), for the Murray–Darling
basin.

estimating irrigation (as a fixed parameter for all the pixels).        tics of soil and vegetation are hereby modeled via parametric
For more details on the outputs of the calibration procedure            distribution functions. The retrieval is then performed via a
and on the irrigation data used to calibrate the F parameter,           nonlinear least-squares regression procedure that minimizes
the reader is referred to Appendix A and Sect. 3.3, respec-             the difference between the measured and modeled backscat-
tively.                                                                 ter time series for each pixel individually (Quast, 2021). To
                                                                        account for spatial variations in the soil-scattering character-
3.2   Input data sets                                                   istics, a temporally constant soil-scattering directionality pa-
                                                                        rameter is optimized. To correct for effects induced by sea-
Input time series of soil moisture, potential evapotranspira-           sonal dynamics of vegetation, auxiliary leaf area index (LAI)
tion (PET), and rainfall are needed to run the SM-based in-             time series provided by the ECMWF (European Centre for
version approach. For the Ebro and Po regions, the irrigation           Medium-Range Weather Forecasts) ERA5-Land (European
products rely on 1 km soil moisture data derived by Sentinel-           ReAnalysis v5-Land) reanalysis data set (Muñoz-Sabater et
1 observations. More specifically, soil moisture is obtained            al., 2021) are used as proxy for the seasonal dynamics of
from incidence-angle-dependent Sentinel-1 backscatter mea-              the vegetation optical depth. In addition, the single-scattering
surements at 500 m spatial sampling (∼ 1 km spatial res-                albedo of the vegetation layer is optimized for each Sentinel-
olution) (Bauer-Marschallinger et al., 2019) by using a                 1 orbit individually to account for differences in the obser-
time-series-based first-order Radiative Transfer modeling ap-           vation geometry between consecutive timestamps. The soil
proach (RT1) (Quast et al., 2019). The scattering characteris-

https://doi.org/10.5194/essd-15-1555-2023                                                Earth Syst. Sci. Data, 15, 1555–1575, 2023
1560                                                                                     J. Dari et al.: Irrigation estimates from space

Figure 2. Iterative procedure adopted to calibrate the SM-based inversion algorithm parameters a, b, Z ∗ , and F .

moisture time series is finally obtained by implying a linear            tivity measurements (dry and wet references in each loca-
relationship to the normalization factor of the bare-soil scat-          tion) that correspond in each case on the vegetation wilting
tering distribution function. The resulting soil moisture data           point and the degree of soil saturation. The obtained rela-
set therefore represents a percentage measure of the relative            tive soil moisture measurements were calibrated using the
moisture saturation of the soil surface.                                 concurrent SM measurements from NASA’s SMAP mission.
   The irrigation product developed over the Murray–Darling              In this study, Spire’s CYGNSS-based SM product retrieved
basin relies on CYGNSS observations. The GNSS-R (GNSS                    from GNSS-R observations on a 6 km equidistant grid in the
reflectometry) remote sensing is a relatively new technique              Murray–Darling basin has been used.
based on a bistatic radar system that is used to perform                    Finally, PET rates from the GLEAM (Global Land Evapo-
Earth surface scatterometry. The applications of the GNSS-               ration Amsterdam Model) v3.5b product at 0.25◦ spatial res-
R technique have been demonstrated in several studies us-                olution (Miralles et al., 2011; Martens et al., 2017) have been
ing the data from recent spaceborne missions, such as                    used to force the algorithm, while rainfall rates have been de-
TechDemoSat-1, CYGNSS, and Spire’s GNSS-R satellites.2                   rived by the ERA5-Land data set at 9 km spatial resolution.
The CYGNSS satellite constellation consists of eight GNSS-                  All the data sets used have been resampled to the adopted
R satellites launched in December 2016 into a 35◦ inclination            regular grids (1 km for Ebro and Po basins, 6 km for Murray–
low Earth orbit. Each satellite carries a four-channel GNSS-R            Darling basin) as a preprocessing step.
bistatic radar receiver tuned to receive the L1 signals trans-
mitted by GPS (Global Positioning System) satellites (Ruf
et al., 2017). The Spire soil moisture retrieval algorithm is            3.3    Benchmark irrigation amounts
based on a change detection method (Freeman et al., 2020).
GNSS-R reflectivity measurements over land vary depend-                  Benchmark irrigation rates over selected sites have been
ing on soil water content, surface roughness, and vegetation.            collected for calibration and validation purposes. Within
The vegetation and roughness changes occur on timescales                 the Ebro basin, four districts have been considered: Urgell
longer than soil moisture changes, which makes it possible               (887.6 km2 ), Algerri Balaguer (70.8 km2 ), North Catalan and
to monitor soil moisture in the presence of vegetation and               Aragonese (657.0 km2 ), and South Catalan and Aragonese
surface roughness contributions. For a given geographic lo-              (504.5 km2 ). The districts differ from each other in terms
cation, the surface roughness can be viewed as almost con-               of irrigation techniques and management (Dari et al., 2021).
stant. Seasonal changes in vegetation can still affect reflec-           The dense network of irrigation canals feeding the districts
tion but on a much longer timescale than changes in soil                 is monitored by the SAIH (Sistema Automático de Informa-
moisture. Short-term fluctuations in reflectivity (dB scale)             ción Hidrológica, http://www.saihebro.com/saihebro/index.
are roughly linearly related to changes in soil moisture. A              php, last access: 1 November 2022) system of the Ebro
relative measure of reflectivity that corresponds to variations          river basin, which provides data about water volumes flow-
in soil moisture levels can be calculated by scaling the nor-            ing through the canals. Hence, this information has been col-
malized reflectivity between the lowest and highest reflec-              lected at a daily temporal scale for the period 2016–2019.
                                                                         The Urgell district is fed by two canals, while the others re-
   2 The Spire GNSS-R data are available through the NASA                ceive water from one canal each. The irrigation depths in mil-
CSDAP and ESA Earthnet programs. https://earth.esa.int/                  limeters have been calculated by dividing the volumes by the
eogateway/missions/spire,    https://www.earthdata.nasa.gov/esds/        areas of interest. Losses due to irrigation efficiency have been
csda/commercial-datasets (last access: 1 November 2022)                  considered as described in Dari et al. (2020).

Earth Syst. Sci. Data, 15, 1555–1575, 2023                                                 https://doi.org/10.5194/essd-15-1555-2023
J. Dari et al.: Irrigation estimates from space                                                                                1561

   Two small districts have been considered for the Po valley:     the Murray–Darling basin. The retrieved irrigation estimates
San Silvestro (2.9 km2 ) and Formellino (7.6 km2 ). They are       are compared against the benchmark amounts in terms of
located around the city of Faenza, in the Emilia Romagna re-       RMSE (root-mean-square error), Pearson correlation r, and
gion. For each pilot district, daily irrigation amounts (in mm)    bias. Limitations of the proposed data sets and future plans
have been provided by the CER consortium for the period            are discussed in Sect. 4.4 and 4.5, respectively.
2016–2019. The crops growing in the Faenza small districts
are mainly pear and kiwi trees.
   Data from five irrigation districts located in New South        4.1   Ebro basin, Spain
Wales have been collected for the Murray–Darling basin:
Coleambally (977.0 km2 ), Murrumbidgee (2789.3 km2 ),              The data set of irrigation amounts retrieved through the
Western Murray (49.1 km2 ), Murray Mulwala (3092.6 km2 ),          SM-based inversion approach over the Ebro basin is devel-
and Murray Wakool (1455.2 km2 ). Each district is managed          oped over a 1 km regular grid and covers the period ranging
by an irrigation infrastructure operator (IIO), which is re-       from January 2016 to the end of July 2020. Figure 4 pro-
sponsible for the production of annual reports on the irriga-      vides the maps of the cumulated irrigation estimates during
tion water withdrawals (Bretreger et al., 2020). It is notewor-    the highest-intensity (May–September) irrigation seasons of
thy that the Murray Mulwala and Murray Wakool districts            2016, 2017, 2018 and 2019. Some patterns of high irriga-
belong to the same IIO. Monthly irrigation amounts refer-          tion rates recurring over areas known to be irrigated can be
ring to the period ranging from April 2017 to April 2019           observed, as the pilot districts considered in this study (see
have been considered. As in the case of the Ebro basin, the        Fig. 3), the narrow portion unfolding from west to east along
irrigation amounts in millimeters have been obtained by di-        the main reach of the Ebro in the middle of the basin, and the
viding the volumes provided in the IIO reports by the area         area close to the river delta.
of interest. It is noteworthy that minor portions of the West-        Figure 5a–d show the 14 d aggregated time series of irriga-
ern Murray and of the Murrumbidgee districts fall outside          tion estimates (the black lines) over the pilot districts against
the agricultural domain derived from the ESA CCI (Climate          the benchmark rates (the light grey shaded areas) for the pe-
Change Initiative) land cover. Hence, for the abovementioned       riod 2016–2019; a yearly comparison in which data referring
districts, the irrigation rates have been computed by consid-      to different districts and years is indicated by different mark-
ering the portion of area overlapped with the mask of agri-        ers and colors, respectively, is provided as well (panel e). It
cultural pixels.                                                   is noteworthy that 2016 is not considered for the Urgell dis-
   Figure 3 provides an overview on the location of all pilot      trict, as there is a lack of irrigation benchmarks for half of the
irrigation districts with respect to the agricultural portions     year. The time series in panels (a)–(d) highlight that the best
(white areas) over which the irrigation estimates have been        performances in terms of RMSE are obtained over the North
produced. The ground-truth information on the collected ir-        Catalan and Aragonese district (RMSE = 10.08 mm/14 d),
rigation rates is summarized in Table 1.                           while the best results in terms of r and bias (denoted BIAS
   A part of the collected irrigation amounts has been used        hereafter) are found for the Algerri Balaguer district (r =
to calibrate the F parameter (see Sect. 3.1). More specifi-        0.78 and BIAS = −2.23 mm/14 d). Even though a general
cally, irrigation data referring to the Algerri Balaguer and to    tendency in slightly underestimating the benchmark amounts
the North Catalan Aragonese and South Catalan Aragonese            can be observed, the performances in terms of RMSE and
districts for the 2-year period 2016–2017 have been used to        BIAS are satisfactory, as the maximum deviation from previ-
calibrate F over the Ebro basin. For the Po valley, the same       ously mentioned minimum values is +4.58 mm/14 d for the
temporal window has been considered (i.e., irrigation appli-       RMSE and −6.59 mm/14 d for the BIAS; in both cases, the
cations over both pilot districts during the time span 2016–       highest values of these two metrics refer to the Urgell district.
2017 have been exploited). Finally, irrigation volumes for the        Along with the irrigation amounts, timing is also satisfac-
period ranging from April 2017 to December 2018 and refer-         torily reproduced over the Algerri Balaguer (r = 0.78) and
ring to the three districts, i.e., Coleambally, Murray Mulwala,    the South Catalan and Aragonese (r = 0.74) districts, while
and Murray Wakool, have been used for the Murray–Darling           worst performances are observed over the remaining two dis-
basin.                                                             tricts. The results agree with previous experiments carried
                                                                   out over a portion of the Ebro basin enclosing the same pi-
                                                                   lot districts of this study and in which irrigation estimates
4   Results and discussion                                         were retrieved by using a combination of DISPATCH SMOS
                                                                   and SMAP soil moisture with evapotranspiration rates calcu-
In this section, the retrieved irrigation amounts over each pi-    lated through the FAO56 approach (Dari et al., 2020). More-
lot area are presented and discussed. Comparisons with ref-        over, the current implementation of a soil-moisture-limited
erence irrigation rates are provided as well. Section 4.1 de-      approach to compute the actual evapotranspiration brings
scribes the irrigation product developed over the Ebro basin,      benefits in reproducing irrigation amounts with respect to
Sect. 4.2 is dedicated to the Po valley, and Sect. 4.3 refers to   previous attempts in this regard (Dari et al., 2022c).

https://doi.org/10.5194/essd-15-1555-2023                                          Earth Syst. Sci. Data, 15, 1555–1575, 2023
1562                                                                                      J. Dari et al.: Irrigation estimates from space

Figure 3. Pilot irrigation districts whose irrigation data have been used for calibration and validation purposes: (1) the Ebro basin, (2) the
Po valley, and (3) the Murray–Darling basin. For each region, the agricultural areas over which the irrigation estimates have been carried out
are indicated in white.

Table 1. Summary of the collected ground-truth irrigation rates.

                      District                     Area [km2 ]     Time span of collected irrigation rates   Source
                      Ebro basin
                      Urgell                             887.6     2016–2019                                 SAIH Ebro
                      Algerri Balaguer                    70.8
                      North Catalan Aragonese            657.0
                      South Catalan Aragonese            504.5
                      Po valley
                      San Silvestro                        2.9     2016–2019                                 CER
                      Formellino                           7.6
                      Murray–Darling basin
                      Coleambally                        977.0     2017 (April)–2019 (April)                 IIOs
                      Murrumbidgee                      2789.3
                      Western Murray                      49.1
                      Murray Mulwala                    3092.6
                      Murray Wakool                     1455.2

   Panel (e) of Fig. 5 provides a long-term comparison, in                the relative error is lower than ±30 %. Seasonal values re-
which the results are yearly cumulated; each point indicates              ferring to the Algerri Balaguer and the North Catalan and
the performance of a district in a certain year. A confidence             Aragonese districts are outside the interval only for one out
interval of ±30 % of the benchmark is shown as well; ac-                  of the four considered years; underestimates lower than 30 %
cording to Massari et al. (2021), such a value matches with               of the total are found over the Urgell and the South Catalan
the upper limit of the accuracy of satellite-derived irrigation           and Aragonese districts for the years 2017 and 2019.
products desired by farmers. In 9 out of the 15 total cases,

Earth Syst. Sci. Data, 15, 1555–1575, 2023                                                  https://doi.org/10.5194/essd-15-1555-2023
J. Dari et al.: Irrigation estimates from space 1563
Figure 4. Cumulated irrigation amounts over the Ebro basin (Spain) during the highest-intensity irrigation season (May–September) of 2016,
2017, 2018, and 2019.
4.2 Po valley, Italy been masked out. In fact, as shown by the time series of
benchmark volumes of Fig. 5, in the Ebro basin irrigation
Similarly to the Ebro case study, the satellite-derived irriga- can occur in winter as well, even though the volumes are
tion data set over the Po valley is developed over a 1 km reg- much lower with respect to summer. This is the case, for
ular grid for the period ranging from January 2016 to the end instance, with irrigated fruit trees and greenhouses. For
of July 2020. The spatial distribution of the cumulated irriga- the pilot districts in the Po valley, the information on the
tion amounts during the highest-intensity irrigation seasons irrigation season is available, and it has been exploited.
of 2016, 2017, 2018, and 2019 are provided in Fig. 6. As Hence, the metrics are computed during irrigation periods
a difference with the Ebro case study, strong contrasts be- only. It is important to underline that reference irrigation
tween areas with very low and very high irrigation rates are amounts in 2018 are lacking from mid-August onwards. A
not detected here. The only exception is a portion with low ir- tendency to overestimate the benchmark can be observed,
rigation amounts in the southeastern side that recurs in 2016, with more satisfactory performances over Formellino
2017, and 2019. This is an expected result, since while in (RMSE = 14.86 mm/14 d and BIAS = 8.65 mm/14 d)
the Ebro basin permanent rainfed and irrigated lands coexist, than over San Silvestro (RMSE = 18.42 mm/14 d and
the Po valley landscape consists of almost evenly distributed BIAS = 12.36 mm/14 d). In both cases, poor performances
agricultural fields. Nevertheless, crop rotation creates a com- in reproducing irrigation timing are found (r = 0.31 and
plex mosaic of irrigated and non-irrigated fields at a spatial r = 0.20 for San Silvestro and Formellino, respectively).
scale that can be lower than 1 km. Panel (c) of Fig. 7 shows that, even though for both districts
The comparison between the proposed irrigation es- the benchmark yearly amounts are overestimated, the rela-
timates and the benchmark rates collected over the San tive error for the representative points of Formellino during
Silvestro and Formellino districts are provided in Fig. 7. the years 2016 and 2017 is below +30 %. It is important
Panels (a) and (b) show the 14 d aggregated time series, to highlight that the validation over the Po valley is limited
while the yearly comparison is proposed in panel (c). by the number and size of the pilot districts. In fact, it has
It is noteworthy that, as a difference with the Ebro case been possible to collect benchmark irrigation rates over
study, here the results during the non-irrigated season have just two sites, each one enclosing a very limited number
https://doi.org/10.5194/essd-15-1555-2023 Earth Syst. Sci. Data, 15, 1555–1575, 20231564 J. Dari et al.: Irrigation estimates from space
Figure 5. (a–d) The 14 d aggregated time series of irrigation estimates (the black lines) over the four considered pilot districts within the
Ebro basin against the benchmark rates (the light grey shaded areas). (e) Yearly comparison with data referring to different districts (AB:
Algerri Balaguer, SCA: South Catalan Aragonese, NCA: North Catalan Aragonese, URG: Urgell) and years indicated through different
markers and colors, respectively. The interval indicating a relative error of ±30 % is shown as well.
of 1 km pixels of the satellite-derived irrigation data set. of high irrigation rates on the eastern and the southern sides
As a result, contamination with adjacent areas that can be of the domain can be observed.
non-irrigated or irrigated but with mixed techniques can Figure 9 shows the comparisons between the benchmark
influence the results. Previous studies highlighted how the irrigation rates and the proposed estimates over the five pi-
irrigation method affects the capability of remotely sensed lot districts. Panels (a)–(e) show the monthly time series,
soil moisture products to detect irrigation-driven changes while a seasonal comparison is provided in panel (f). As in
(see, for example, Gao et al., 2018; Dari et al., 2021). the case of the Po valley, the results referring to the non-
Moreover, the 1 km resolution represents the upper limit of irrigated season have been masked out, and the metrics have
the nominal size of agricultural fields over the Po valley; been computed by considering irrigation periods only. Very
hence, the comparisons could suffer from a variability of the good performances are obtained over three districts, i.e.,
irrigation dynamics occurring at the subpixel scale as well. Coleambally, Murray Mulwala, and Murrumbidgee, across
which the RMSE varies between 8.65 and 10.54 mm/month,
r ranges from 0.66 to 0.84, and the BIAS is between −7.26
and 3.18 mm/month. Even though the timing is properly re-
4.3 Murray–Darling basin, Australia
produced, the SM-based inversion approach overestimates
The irrigation data set over the Murray–Darling basin has benchmark irrigation over the Murray Wakool site. Finally,
been produced over a 6 km regular grid for the period ranging unsatisfactory performances are found over the Western Mur-
from April 2017 to July 2020. The spatial distribution of the ray district, where non-negligible underestimates can be ob-
retrieved irrigation amounts cumulated during the highest- served. Over this district, the SM-based inversion algorithm
intensity irrigation seasons (September–March) of 2017/18, returns lower estimates with respect to the other test sites,
2018/19, and 2019/20 are shown in Fig. 8. Recurring patterns and, concurrently, benchmark rates are higher. The unsatis-
Earth Syst. Sci. Data, 15, 1555–1575, 2023 https://doi.org/10.5194/essd-15-1555-2023J. Dari et al.: Irrigation estimates from space 1565 Figure 6. Cumulated irrigation amounts over the Po valley (Italy) during the highest-intensity irrigation season (May–September) of 2016, 2017, 2018, and 2019. Figure 7. (a–b) The 14 d aggregated time series of irrigation estimates (the black lines) over the two considered pilot districts within the Po valley against the benchmark rates (the light grey shaded areas). (c) Yearly comparison with data referring to different districts and years indicated through different markers and colors, respectively. The interval indicating a relative error of ±30 % is shown as well. factory performances over the Western Murray district could season, which crosses two calendar years. Three representa- be explained by the mismatch between the site extent (which tive points are very close to the 1 : 1 line, and the relative is from 20 to 60 times smaller than the areas of the other error results in less than or equal to ± 30 % in 5 cases out of pilot districts) or by the adopted spatial resolution, which is 10. a crucial aspect for properly detecting the irrigation signal from space (Dari et al., 2022b; Massari et al., 2021). The 4.4 Limitations scatter plot provided in panel (f) of Fig. 9 summarizes the long-term comparison. It is noteworthy that, in this case, the Two main issues may affect the developed data sets, namely, data have been aggregated at the yearly time step by consid- irrigation amounts wrongly retrieved over non-irrigated areas ering April as a starting month, thus including the irrigation and false irrigation rates reproduced during the non-irrigated https://doi.org/10.5194/essd-15-1555-2023 Earth Syst. Sci. Data, 15, 1555–1575, 2023
1566                                                                              J. Dari et al.: Irrigation estimates from space

Figure 8. Cumulated irrigation amounts over the Murray–Darling basin (Australia) during the highest-intensity irrigation season
(September–March) of 2017/18, 2018/19, 2019/20.

season. In principle, detailed knowledge of the actual extent      or, at least, with global maps of areas equipped for irrigation
of irrigated areas could allow us to estimate how much wa-         (e.g., Salmon et al., 2015; Siebert et al., 2015; Nagaraj et al.,
ter is wrongly retrieved where irrigation is not practiced and     2021).
such information could be exploited to correct the algorithm          False irrigation rates during non-irrigated seasons repre-
output (Jalilvand et al., 2019). Unfortunately, irrigation dy-     sent an additional issue that could affect the proposed data
namics are highly uncertain, and the actual extent of irri-        sets. Unlike the irrigation extent, the information on the
gated areas is not an exception, as demonstrated by the large      crop watering period is generally available and more reliable.
number of studies aimed at developing remote-sensing-based         Moreover, since the irrigation schedule depends on the crop
techniques to map irrigation (see, for example, Bazzi et al.,      type, cropping calendars can be useful (see, for example,
2019; Deines et al., 2019; Dari et al., 2021; Elwan et al.,        Portmann et al., 2008). Information on the irrigation seasons
2022). Moreover, the information on the irrigation extent is       can be used to postprocess the developed products, as shown
dynamic in time, as within the areas equipped for irrigation       here for the Po and Murray–Darling case studies. However,
the actually irrigated fields may vary from year to year on        an assessment of retrieved irrigation amounts through the
the basis of economic factors, climatic conditions, and farm-      SM-based inversion approach per month of the year has been
ing strategies (e.g., crop rotation). In summary, the developed    carried out. Figure 10 provides the mean of the cumulated ir-
data sets could benefit from integration with the spatial infor-   rigation amounts for each month of the year covered by the
mation of the actual extent of irrigated areas (when available)    developed data sets calculated over the pilot districts, i.e.,

Earth Syst. Sci. Data, 15, 1555–1575, 2023                                         https://doi.org/10.5194/essd-15-1555-2023
J. Dari et al.: Irrigation estimates from space                                                                                          1567

Figure 9. (a–e) The 14 d aggregated time series of irrigation estimates (the black lines) over the five considered pilot districts within the
Murray–Darling basin against the benchmark rates (the light grey shaded areas). (f) Yearly comparison with data referring to different districts
and years indicated through different markers and colors, respectively. The interval indicating a relative error of ±30 % is shown as well.

where irrigation surely occurs. The highest-intensity irriga-             4.5    Future plans
tion seasons are highlighted in light green. For the selected
sites within the Ebro and the Murray-Darling basins, the                  The room for enhancing the retrieved irrigation products
highest rates are retrieved when expected. The same happens               largely relies on users’ feedback, which is essential to ad-
for the Po valley, for which the highest peak occurs in June,             dress future developments. In the following, some of the
but a second non-negligible peak can be observed in October               main improvements that could be implemented in the near
as well. Such a circumstance can be attributed to false irriga-           future are listed:
tion rates, as it is not corroborated by significant benchmark               – Temporal extension of the retrieved irrigation data sets
irrigation rates in the same period. However, over the portion                 could be implemented. Currently, the time span for
of the Po valley where the considered pilot districts are lo-                  which the data sets have been produced is constrained
cated, fruit trees are irrigated even in October and November;                 by the availability of the input data at the time of prod-
hence, contamination with the signal coming from surround-                     uct development. For instance, the ending date common
ing pixels with this feature could explain the irrigation peak                 to all the data sets is due to the temporal coverage of
in the autumn season over the Formellino and San Silvestro                     GLEAM v3.5b.
districts. Nevertheless, the monthly irrigation rates are never
equal to zero during the winter period; this is a common issue               – Spatial extension of the retrieved irrigation data
with all three case studies, and, except for the Ebro basin, it                sets could be implemented. Undoubtedly, the main
can be considered a false irrigation, with magnitude over the                  challenge is going through a global irrigation product.
Po valley higher than over the Murray–Darling basin. These                     Nevertheless, the high resolution (1 km or less) required
potential errors can be attributed to overestimates of rain-                   for the input data sets (at least soil moisture) and the
fall rates through the proposed approach occurring especially                  high variability of irrigation practices worldwide makes
under humid climate conditions, resulting in water amounts                     it necessary for a gradual progression. Hence, the very
wrongly attributed to irrigation practices.                                    imminent challenge is the extension to the country and
                                                                               continental scales. For instance, the development of
                                                                               irrigation estimates through the SM-based inversion
                                                                               approach over the whole Mediterranean area is a
                                                                               task foreseen within the ESA 4DMED-Hydrology

https://doi.org/10.5194/essd-15-1555-2023                                                  Earth Syst. Sci. Data, 15, 1555–1575, 2023
1568 J. Dari et al.: Irrigation estimates from space
Figure 10. Mean irrigation amounts retrieved per each month of the year over the pilot irrigation districts of the Ebro basin, the Po valley,
and the Murray–Darling basin. Note the different y-axis range for the plot referring to the Murray–Darling case study.
project (https://www.4dmed-hydrology.org/#: 6 Conclusions
~:text=4DMED-Hydrologyaimsatdeveloping,
fromtheESA-Copernicusmissions, last access: 3 This study presents high-resolution irrigation products de-
April 2023). rived from satellite observations and developed over three
highly human-influenced regions. The data sets, developed
through the SM-based inversion approach, are one of the
– Exploitation of high-resolution evapotranspiration in-
main outcomes of the ESA Irrigation+ project. The retrieved
put data could be implemented. Along with soil mois-
irrigation amounts have been validated through a compar-
ture, the evapotranspiration term plays a fundamental
ison with benchmark rates over selected districts. For the
role in determining the output of the SM-based inver-
Ebro and the Murray–Darling basins, the amount of the col-
sion approach (Dari et al., 2020). Hence, the exploita-
lected information on irrigation dynamics allows for a reli-
tion of evapotranspiration estimates at a spatial reso-
able validation, which provides satisfactory results. For the
lution matching with the scale at which irrigation oc-
Ebro basin, median values of RMSE, r, and bias equal to
curs is expected to bring benefits to the outcomes of
12.4 mm/14 d, 0.66, and −4.62 mm/14 d, respectively, are
the SM-based inversion approach. For this reason, the
found. Referring to the Murray–Darling basin, the analogous
use of higher-resolution input PET rates for comput-
values are 10.54 mm/month, 0.77, and −3.07 mm/month, re-
ing the evapotranspiration term of Eq. (3) (e.g., from
spectively. Note that the two abovementioned data sets are
a 1 km resolution version of the GLEAM data set over
based on different soil moisture products. The validation
the Mediterranean, which will be developed within the
over the Po valley is affected by higher uncertainties due to
abovementioned 4DMED-Hydrology project) is among
the limited number and size of the pilot districts. However,
the future perspectives of this study.
the authors encourage the scientific community to perform
deeper validation studies, as the main aim of this work is
– Integration with crop calendars and spatial information the use of the developed products. Under this perspective,
on actually irrigated areas could be implemented. As al- limitations and suggested postprocessing strategies are high-
ready mentioned in Sect. 4.4, the postprocessing of the lighted in Sect. 4.4. The presented irrigation products are the
developed data sets with ancillary site-specific informa- first regional-scale gridded data sets retrieved from satellite
tion on irrigation extent and duration is recommended. observation at a spatial resolution suitable for the water re-
Hence, users are encouraged to exploit such informa- source management in agriculture. Hence, these kinds of ap-
tion, when available, to refine the data. In future, such plications are fostered, as for instance the ingestion of the
procedures could be even automatized and implemented developed data sets in systems providing irrigation advice
into the algorithm. This is already partly done in the cal- or performing irrigation water accounting. Of course, the in-
ibration step, in whose first step the potential irrigation gestion of the proposed irrigation data sets into hydrolog-
days are masked out (see Sect. 3.1). ical and land surface modeling is possible as well. Users’
feedback will be essential to address future implementations,
with the final aim of building an operational system for high-
5 Data availability resolution irrigation water monitoring from space.
The three irrigation data sets presented in this study are freely
available at https://doi.org/10.5281/zenodo.7341284 (Dari et
al., 2022a).
Earth Syst. Sci. Data, 15, 1555–1575, 2023 https://doi.org/10.5194/essd-15-1555-2023J. Dari et al.: Irrigation estimates from space 1569 Appendix A: Calibrated parameters In this section, the outcomes of the calibration procedure de- scribed in Sect. 3.1 and summarized in Fig. 2 are provided. For the parameters a, b, and Z ∗ , a spatially distributed cali- bration has been performed. The calibrated values of such pa- rameters for the Ebro basin are shown in the maps of Fig. A1 and in the boxplots of Fig. A2. Across the whole study area, the median values of a, b, and Z ∗ are equal to 18.84 mm, 3.98, and 79.82 mm, respectively. The calibrated value of the F parameter (adopted over the whole domain) is equal to 1.37. Figure A1. Spatial distribution of the calibrated values of the parameters a, b, and Z ∗ over the Ebro basin. Figure A2. Boxplot showing the calibrated values of the parameters a, b, and Z ∗ over the Ebro basin. https://doi.org/10.5194/essd-15-1555-2023 Earth Syst. Sci. Data, 15, 1555–1575, 2023
1570                                                                                      J. Dari et al.: Irrigation estimates from space

   The calibrated values of the parameters a, b, and Z ∗ ob-
tained over the Po valley are shown in the maps of Fig. A3
and in the boxplots of Fig. A4. The median values of a, b, and
Z ∗ resulting from the calibration step are equal to 7.02 mm,
1.40, and 97.63 mm, respectively. The calibrated value of the
F parameter (adopted over the whole domain) is equal to
0.60.

Figure A3. Spatial distribution of the calibrated values of the parameters a, b, and Z ∗ over the Po valley.

Figure A4. Boxplot showing the calibrated values of the parameters a, b, and Z ∗ over the Po valley.

Earth Syst. Sci. Data, 15, 1555–1575, 2023                                                  https://doi.org/10.5194/essd-15-1555-2023
You can also read