PROTEVS-MED field experiments: very high resolution hydrographic surveys in the Western Mediterranean Sea
←
→
Page content transcription
If your browser does not render page correctly, please read the page content below

Earth Syst. Sci. Data, 12, 441–456, 2020
https://doi.org/10.5194/essd-12-441-2020
© Author(s) 2020. This work is distributed under
the Creative Commons Attribution 4.0 License.

        PROTEVS-MED field experiments: very high resolution
       hydrographic surveys in the Western Mediterranean Sea
           Pierre Garreau1 , Franck Dumas2 , Stéphanie Louazel2 , Stéphanie Correard2 , Solenn Fercocq2 ,
       Marc Le Menn2 , Alain Serpette2 , Valérie Garnier1 , Alexandre Stegner3 , Briac Le Vu3 , Andrea Doglioli4 ,
                                                 and Gerald Gregori4
       1 Laboratoire   d’Océanographie Physique et Spatiale (LOPS), IFREMER, Université de Bretagne Occidentale,
                                   CNRS UMR 6523, IRD, IUEM, 29280 Plouzané, France
                   2 SHOM, Service Hydrographique et Océanographique de la Marine, 13 Rue de Châtellier,

                                           CS592803, 29228 Brest CEDEX 2, France
                            3 Laboratoire de Météorologie Dynamique (LMD), CNRS UMR 8539,

                                         École Polytechnique, 91128 Palaiseau, France
       4 Institut Méditerranéen d’Océanographie (MIO), Aix-Marseille Université, Université de Toulon, CNRS, IRD,

                                            MIO UM 110, 13288 Marseille, France
                               Correspondence: Pierre Garreau (pierre.garreau@ifremer.fr)

                              Received: 19 September 2019 – Discussion started: 27 September 2019
                       Revised: 20 January 2020 – Accepted: 21 January 2020 – Published: 26 February 2020

      Abstract. From 2015 to 2018 four field experiments (seven legs) were performed in the Western Mediterranean
      basin during winter or early spring. The main objectives were the assessment of high-resolution modeling and the
      observation of mesoscale structure and associated ageostrophic dynamics. Thanks to the intensive use of a towed
      vehicle undulating in the upper oceanic layer between 0 and 400 m depth (SeaSoar), a large number of very high
      resolution hydrographic transects (total length about 10 000 km) were measured, observing mesoscale dynamics
      (slope current and its instabilities, anticyclonic eddies, submesoscale coherent vortices, frontal dynamics, con-
      vection events, strait outflows) and submesoscale processes like stirring, mixed-layer or symmetric instabilities.
      When available, the data were completed with velocities recorded by a vessel-mounted acoustic Doppler current
      profiler (VMADCP) and by surface salinity and temperature recorded by a thermosalinograph (TSG). Classical
      full-depth CTD (conductivity, temperature, depth) stations were also used, providing the background hydrogra-
      phy of the deeper layers when focusing on peculiar structures. In 2017, a free-fall profiler (MVP-200; MVP –
      moving vessel profiler) was deployed to manage even higher horizontal resolutions. In 2018, another free-fall
      profiler (a rapidCAST) was tested. When available, biological sensors (chlorophyll a, turbidity, dissolved oxy-
      gen, etc.) were used. They provided useful complementary observations about the circulation. This dataset is
      an unprecedented opportunity to investigate the very fine scale processes, as the Mediterranean Sea is known
      for its intense and contrasting dynamics. It should be useful for modellers (who reduce the grid size below a
      few hundred meters) and should properly resolve finer-scale dynamics. Likewise, theoretical work could also be
      illustrated by in situ evidence embedded in this dataset. The data are available through the SEANOE repository
      at: https://doi.org/10.17882/62352 (Dumas et al., 2018).

Published by Copernicus Publications.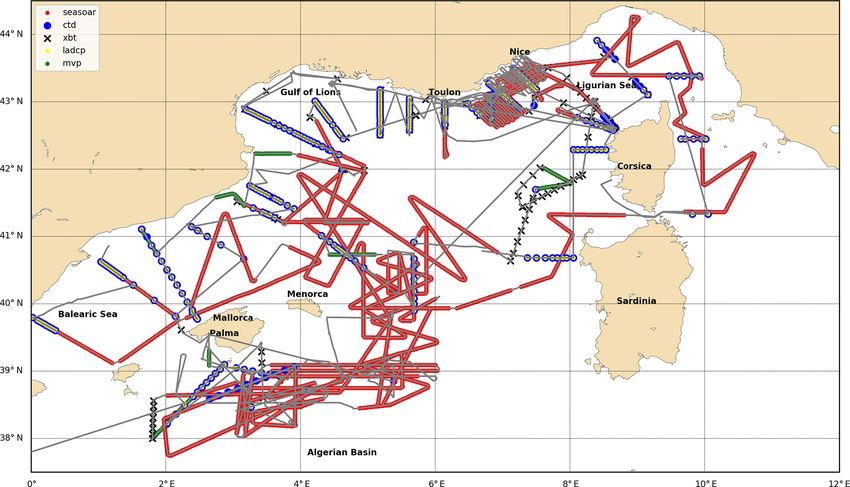
442                                                                       P. Garreau et al.: PROTEVS-MED field experiments

1   Introduction                                                    tures in a relatively restrained and accessible area. There-
                                                                    fore, the PROTEVS-MED cruises potentially caught a multi-
Progress in numerical modeling and conceptual approaches            tude of physical processes in the Western Mediterranean Sea
both emphasized the importance of fine-scale processes in           (Fig. 1).
connecting the ocean interior to the atmosphere, driving the
energy cascade to small scales and reversely (McWilliams,
                                                                    2.1   Surface and intermediate circulation
2016) shaping the biochemical cycles and biodiversity distri-
bution (Lévy et al., 2012, 2018). For instance, in the north-       The basin or sub-basin dynamics is largely driven by the
western Mediterranean Sea, chlorophyll a filaments near the         thermohaline circulation. The Mediterranean Sea is a semi-
external boundary of the Northern Current in the Ligurian           enclosed evaporation basin, including areas of intermediate
Sea are generated by frontal instabilities (Niewiadomska et         to deep convection. Light (fresh) Atlantic water (AW), flow-
al., 2008), and coherent vortices may act efficiently, both as      ing in through the Gibraltar Strait, generally circulates along
biological barriers and drivers of plankton diversity (Bosse        the continental slope in both western and eastern basins (Mil-
et al., 2017; Rousselet et al., 2019). As all these scale in-       lot and Taupier Letage, 2005). The slope current is unstable
teractions are ubiquitous, it is of crucial importance to de-       along the Algerian Coast and generates anticyclonic eddies,
velop an observation strategy to gain insight simultaneously        called Algerian eddies (AEs), that spread AW to the south-
into the large-scale dynamics, the mesoscale processes and          ern half of the Western Mediterranean basin, called the Al-
the submesoscale processes. Unfortunately, reaching this ob-        gerian Basin (Escudier et al., 2016a; Puillat et al., 2002). In
jective using conventional cruise strategies is not straightfor-    the northern part of the Western Mediterranean basin, the
ward, leading to a lack of in situ observations of fine-scale       AW, composed of the eastern Corsica current (ECC) and
processes. Due to their synoptic view, satellite observations       western Corsica current (WCC), joins the Ligurian Sea to
partly fill the gap between larger- and finer-scale dynam-          form the Northern Current that flows along the slope until
ics. For many years, remotely sensed observations of surface        the Balearic Sea (Millot, 1999; Send et al., 1999). The ex-
temperature, ocean colors or altimetry exhibit a large spec-        istence and the strength of a return branch of this current
trum of processes with various cut-off scales (from around          along the northern Balearic front (NBF) between the islands
70 km for the altimetry to some tens of meters for imagery).        of Menorca and Corsica are still under debate, despite the
Some of these limits will be pushed back soon by the fu-            generally accepted concept of a northern (cyclonic) gyre, in
ture Surface Water and Ocean Topography (SWOT) satellite,           agreement with the doming of isopycnals in the central part
which should provide substantial improvement for small-             of this sub-basin. The Levantine intermediate water (LIW)
scale processes with a sea surface height signature (d’Ovidio       formed in winter in the eastern basin, entering into the West-
et al., 2019).                                                      ern Mediterranean basin through the Strait of Sicily, follows
   The data presented hereafter are a contribution to very          more or less the same cyclonic circulation pattern (Millot and
high resolution observations of the top oceanic layer               Taupier Letage, 2005). It spreads out into the northern part of
and are freely available on the SEANOE repository at:               the Western Mediterranean basin between 400 and 800 m and
https://doi.org/10.17882/62352 (Dumas et al., 2018). Long           is found sporadically within the Algerian Basin. In the West-
transects of the first 400 m below the surface were sam-            ern Mediterranean basin, this important water mass, marked
pled with a horizontal resolution on the order of 2 km in the       by a relative subsurface maximum of temperature and salin-
Western Mediterranean Sea. The hydrographic and dynam-              ity, was already identified as the water type in Sverdrup et
ics background of this region are given in Sect. 2. The ob-         al. (1942).
jectives and implementation of the surveys are presented in
Sect. 3. The details of the measurements (platforms, sensors,
                                                                    2.2   Mesoscale structures
methodology, metrology, data control, ancillary data) are re-
ported in Sect. 4. To illustrate the potential of the dataset, an   As in the global ocean the mesoscale dynamics is ubiquitous
overview of the observed processes is displayed in Sect. 5.         within the Mediterranean Basin; it plays a major role in re-
Lessons learned during surveys and summary are displayed            distributing water masses and has been evidenced by remote
in Sect. 6.                                                         sensing for a long time (Millot et al., 1990). In the Western
                                                                    Mediterranean basin, the first internal radius of deformation
2   Oceanic contexts of the Western Mediterranean                   is on the order of 6 km in the northern basin and of 16 km
    Sea                                                             in the Algerian Basin (Escudier et al., 2016b). It is an in-
                                                                    dicator of the typical size of the mesoscale activity because
The Mediterranean Sea is often referred as a “laboratory            the scale of surface-intensified eddy in geostrophic balance
basin”, exhibiting many processes that are met pervasively          is on the order of a few deformation radii. As a result of
and are of primary interest in the functioning of the global        ocean–atmosphere exchanges, of large structural instabilities
ocean (Robinson and Golnaraghi, 1994). It thus provides             or of flow–topography interactions, submesoscale coherent
the opportunity to investigate a large panel of oceanic fea-        vortices, hereafter referred to as SCVs (McWilliams, 1985),

Earth Syst. Sci. Data, 12, 441–456, 2020                                             www.earth-syst-sci-data.net/12/441/2020/
P. Garreau et al.: PROTEVS-MED field experiments                                                                             443

Figure 1. Map of PROTEVS-MED cruises. Dynamical features, northern Balearic front (NBF), eastern Corsica current (ECC), western
Corsica current (WCC) and Northern Current (NC) are depicted in grey.

whose sizes are currently close to the local radius of defor-     2.4   Previous high-resolution observations
mation, were observed in the Western Mediterranean (Testor
and Gascard, 2003; Bosse et al., 2015, 2016). Eddies, me-         The finest part of the mesoscale dynamics often escapes the
anders, filaments and fronts are typically smaller than in the    usual sampling strategy (CTD – conductivity, temperature,
world ocean.                                                      depth – arrays, glider deployments) because of being short-
                                                                  lived, small in size and quickly advected. A development
2.3   Submesoscale structures                                     in the last decade of glider fleets revealed nevertheless the
                                                                  mesoscale variability in the Western Mediterranean basin.
There are strong interactions between mesoscale structures,          Recent field experiments based on the multi-platform in-
thus generating intense stirring, layered structures and patchy   tegrated monitoring program MOOSE (Coppola et al., 2019)
ocean areas. Air–sea exchanges are marked by frequent             or on the intensive targeted experiment HYMEX (Estournel
strong events (tramontane and mistral gusts, for instance in      et al., 2016) have revisited the hydrography and the dynamics
the northwestern Mediterranean basin); they interact with the     of the northwestern part of the Western Mediterranean basin.
NC and mesoscale structures and generate sinks or sources         A strategy of regular and repeated gliders lines as well as
of potential vorticity, thus leading to ageostrophic dynamics     dedicated deployments allowed characterizing the variabil-
(Bosse et al., 2015; Estournel et al., 2016; Giordani et al.,     ity in the dynamics and describing crossed fine-scale struc-
2017; Testor et al., 2018).                                       tures. Bosse et al. (2015, 2016) inventoried the SCVs and
   Besides this, the northwestern Mediterranean Basin is          their contributions to water mass redistribution. With data
known to be a place of deep convection events which has           from the same strategy, Margirier et al. (2017) character-
been studied for a long time and even taken as one of the         ized the convection plumes in the Gulf of Lions. Testor et
paradigms of deep oceanic convection (Medoc Group, 1970;          al. (2018) summarized the observations of convection during
Schott et al., 1996; Houpert et al., 2016; Testor et al., 2018;   the dedicated experiment HYMEX. Multi-platform strate-
Marshall and Schott, 1999). Both modeling (Jones and Mar-         gies, including gliders, mooring, combined cruises (Ruiz et
shall, 1993, 1997) and observations (Bosse et al., 2016; Mar-     al., 2009; Pascual et al., 2017; Petrenko et al., 2017; Knoll et
girier et al., 2017) show that deep convection is highly fa-      al., 2017; Onken et al., 2018; Troupin et al., 2019) or colo-
vorable to the production of fine-scale structures at subme-      cation with altimetric tracks (Borrione et al., 2016; Heslop
soscale levels whether they are due to deepening of the mixed     et al., 2017; Aulicino et al., 2018, 2019; Carret et al., 2019),
layer during winter or to postconvection restratification.        can provide part of the missing synoptic view.
                                                                     The capability of changing the glider’s trajectory at any
                                                                  time has not often been used in a small-scale context be-

www.earth-syst-sci-data.net/12/441/2020/                                            Earth Syst. Sci. Data, 12, 441–456, 2020
444                                                                       P. Garreau et al.: PROTEVS-MED field experiments

cause its horizontal velocity remains low (in the range of 15–           ties, mixed-layer instabilities, subduction and convec-
30 km d−1 ), preventing any rapid assessment of a detected               tion.
small structure. Despite this lack of synopticity, Cotroneo
et al. (2016, 2019) adapted a glider trajectory to a remotely       Clearly, the main part of the present dataset is not devoted
sensed observed Algerian eddy and current. Conversely the           to tracking any climatic change in water mass properties;
SeaSoar horizontal velocity is 10 times faster than the glider      the SeaSoar, the MVP and the rapidCAST are rapidly mov-
one. This towed vehicle can handle a turning radius of 2 nmi        ing platforms, leading to acquiring less-precise tempera-
(nmi – nautical miles; i.e., gyration speed of 10 ◦ min−1 )         ture, conductivity and above all deduced salinity data than
when the ship changes direction. It allows for a strategy           the standardized CTD protocol. MVP and rapidCAST are
based on long exploratory transects as the ship velocity is         equipped with unpumped sensors, and the three tools reach
close to its transit velocity and on intensive sampling of par-     high ascending or descending velocity (above 2 m s−1 ) that
ticular detected structures. Due to heavy logistical involve-       leads to inescapable thermal-lag issues across sharp fronts.
ment, the use of SeaSoar remained scarce in the Western             Readers interested in this topic should only use the classical
Mediterranean Sea. Allen et al. (2001, 2008) observed an            CTD station data.
oblate lens with a 20 km radius and 150 m thickness, cen-              Four cruises were conducted between 2015 and 2018 by
tered at 250 m depth during the OMEGA-2 field experiment            the “Service Hydrographique et Océanographique de la Ma-
in fall 1996. Salat et al. (2013) reported SeaSoar transects in     rine” (SHOM) in the Western Mediterranean basin, during
the Gulf of Lions after the convection in spring 2009. The          winter or early spring, managing mainly the towed undulat-
SeaSoar was also used during one leg of the ELISA field             ing vehicle SeaSoar to investigate the subsurface (0–400 m)
experiment devoted to the Algerian eddies (Taupier-Letage           layer. When the deployment of this vehicle was either unsafe
et al., 2003), but only the mesoscale features have been re-        (over shallow water) or even impossible (due to rough me-
ported.                                                             teorological conditions, breakdown of the winch or vehicle)
   A free-fall recovered platform, the moving vessel profiler       or when complementary observations were requested (e.g.,
(MVP-200), has lighter logistics but requires a lower ves-          to go below 400 m or collect water samples for biochemical
sel velocity to reach depths equivalent to those reached with       analysis), CTD casts were performed instead. On-board rou-
the SeaSoar: that is to say 2–4 kn to go 400 m deep. In the         tinely acquired data (vessel-mounted acoustic Doppler cur-
Western Mediterranean Sea, the MVP was deployed during              rent profiler – VMADCP – and thermosalinograph – TSG)
the OSCAHR cruise, allowing a detailed study of a cyclonic          were also included in this database.
structure in the Ligurian Sea (Rousselet et al., 2019) and in          We present here, in a synthetic dataset, all data recorded
situ estimation of the sea surface height for a comparison          during the cruises (Fig. 2; Table 1). Complementary data
with along-track satellite data (Meloni et al., 2019).              used to design the cruise, to adapt the strategy on field or to
                                                                    interpret results (altimetric tracks, remotely sensed sea sur-
                                                                    face temperature or chlorophyll a) are available on CMEMS
3    Objectives and achievement of the field
                                                                    servers (http://marine.copernicus.eu, last access: 19 Febru-
     experiments
                                                                    ary 2020). An eddy detection tool called AMEDA (Le Vu et
                                                                    al., 2017) was also used to detect and track structures during
The main scientific objectives of the cruises were threefold:
                                                                    the cruises. Surface and Argo drifters were also dropped dur-
    – to assess the large-scale circulation features of the West-   ing the cruises, and data are available on companion datasets
      ern Mediterranean basin, evaluating the water masses          (Table 2).
      and the fluxes at different key points in the basin (the         The first cruise, called PROTEVS-MED 2015_leg1, took
      Ligurian Sea, the Balearic Sea, the northern Tyrrhenian       place from 7 to 24 January 2015 aboard the R/V Pourquoi
      Sea, the northern Balearic front area and the Algerian        Pas?. Its main objective was to observe the dynamics of the
      Basin), with a goal of assessing of operational numeri-       NC from the Ligurian Sea to the Gulf of Lions and the asso-
      cal simulation of the circulation performed for the navy;     ciated mesoscale and submesoscale processes. Attention was
                                                                    paid to cross-slope transects in the Gulf of Lions in order to
    – to identify and follow peculiar mesoscale structures,         examine the behavior of the Northern Current and the ex-
      such as surface eddies, modal structures composed of          changes across the shelf break. An intensive survey of the
      winter intermediate water (WIW), SCVs, meanders and           Northern Current between Toulon and Nice was performed.
      filaments, and explore their signatures on the sea sur-          The second leg, PROTEVS-MED 2015_leg2, was car-
      face height (altimetry) and their acoustic impact (i.e.,      ried out on the R/V Beautemps-Beaupré from 16 April to
      through their modulation of the sound propagation             3 May 2015. It started in the Balearic Sea and investigated
      speed);                                                       the slope current from the Ligurian Sea to the Balearic Sea.
                                                                    During this cruise, the SeaSoar trawl failed early, after just
    – to observe and characterize the submesoscale dynam-           three transect acquisitions in the Balearic Sea, describing the
      ics such as ageostrophic stirring, symmetric instabili-       hydrology relative to the cyclonic circulation and its associ-

Earth Syst. Sci. Data, 12, 441–456, 2020                                             www.earth-syst-sci-data.net/12/441/2020/
P. Garreau et al.: PROTEVS-MED field experiments 445
Table 1. Summary of measured transects, profiles and routinely acquired data. Cumulated length of transects and total numbers of vertical
profiles are displayed.
PROTEVS- 2015_leg1 2015_leg2 2016 2017_leg1 2017_leg2 swot_2018_leg1 swot_2018_leg2
MED 07-01/24-01 16-04/03-05 22-03/04-04 27-01/07-02 11-02/23-02 23-04/26-03 30-04/18-05
SeaSoar 2290 km 329 km 2090 km 1858 km 620 km 615 km 2830 km
1137 profiles 263 profiles 1369 profiles 706 profiles 1162 profiles 411 profiles 2381 profiles
MVP 153 km 188 km
813 profiles 708 profiles
rapidCAST 22 km 167 km
92 profiles 71 profiles
CTD 62 profiles 151 profiles 47 profiles 17 profiles 27 profiles 1 profile 12 profiles
LADCP 56 profiles 137 profiles 47 profiles 18 profiles 26 profiles 3 profiles
XBT 30 profiles 22 profiles 39 profiles 1 profile
VMADCP 2676 km 1071 km 4118 km
38kHz
VMADCP 3036 km 3688 km 2705 km 5384 km 1068 km 4128 km
150kHz
TSG 3756 km 3861 km 3744 km 2999 km 3011 km 1212 km 4984 km
Figure 2. Map of PROTEVS-MED cruises and instruments deployed; TSG is available for all the ship track.
ated mesoscale structures. This therefore led to using mostly salinity. When differences that were too large appeared be-
CTD stations and VMADCP 150 kHz records. In particular, tween the values at the ascent and descent, the profiles were
a dense array of CTD casts were then performed within the flagged with a value of 4 (a bad value that can be corrected).
Northern Current between Nice and Toulon. The PROTEVS- The second campaign, PROTEVS-MED 2016, took
MED 2015_leg2 survey was characterized by a proliferation place on the R/V Beautemps-Beaupré from 22 March to
of jellyfish; the CTD measurements are to be taken with cau- 4 April 2016. It was designed to focus on the origin of the
tion, as they caused excessive smoothing of temperature and NC, where the flows through the Corsica Channel and the
www.earth-syst-sci-data.net/12/441/2020/ Earth Syst. Sci. Data, 12, 441–456, 2020446 P. Garreau et al.: PROTEVS-MED field experiments
WCC join. The behavior and the origin of the WCC were 4 Data, methods and quality controls
also explored along the western coast of Corsica. Besides
unveiling part of the complex hydrological structure of the 4.1 CTD casts and LADCP
NBF in early spring, the PROTEVS-MED 2016 survey al-
The CTD casts were performed with the Sea-Bird SBE-9 in-
lowed capturing an Algerian eddy in an interaction with the
strument mounted in a General Oceanics 12-place rosette
NBF. Garreau et al. (2018) described, in detail, its original
frame fitted with 12 Niskin bottles. Sometimes a RDI
double-core structure: a superposition of two water masses of
150 kHz current profiler was also implemented on the rosette,
different origin spinning together. The survey provides also
and then the LADCP (lower acoustic Doppler current pro-
scenes of and insights into the way both components of the
filer) performed measurements during the cast. Standard hy-
Northern Current merge together to the north of the Corsica
drographic procedures for CTD casts were applied. When
Channel during early spring.
available, LADCP recorded data were processed following
The third campaign PROTEVS-MED 2017 took place
the inversion method of Visbeck (2002).
from 27 January to 7 February (leg1) and from 11 to
23 February (leg2) aboard the R/V Atalante. This survey
was devoted to exploring eddies detected by altimetry in the 4.2 SeaSoar deployments
northern Balearic front and to assessing an eddy-tracking tool The SeaSoar is a towed undulating vehicle designed and built
(Le Vu et al., 2017). Transects across the northern Balearic by Chelsea Instruments. Two Sea-Bird SBE-9 (with SBE-
front revealed the complexity of this transition zone. In or- 3 temperature and SBE-4 conductivity sensors) instruments
der to escape a rough sea state subsequent to a strong mis- were mounted on either side of the SeaSoar. When available,
tral gust, part of the cruise was dedicated to the investiga- a WET Labs WETStar chlorophyll a fluorometer and both
tion of the Balearic Sea and the outflow of a coastal fresher the oxygen sensor (SBE-43) and optical-properties sensor
and colder water mass from the Gulf of Lions. Back in the (WET Labs C-Star) were deployed. The SeaSoar was trawled
deep-sea area, partial convection and WIW formation were at 9 kn by a profiled cable. It undulated between the surface
recorded. An SCV was thoroughly observed to the north of and 400 m below the surface under optimal conditions, with a
the Balearic front. horizontal resolution on the order of 2 km. Rough sea states,
The fourth and last field experiment, PROTEVS-MED- lateral currents and strong vertical shears can degrade the
SWOT 2018, was conducted in the framework of SWOT performance of the vehicle and reduce the vertical range of
preparatory phase from 23 April to 26 April (leg1) and from exploration between 20 and 360 m. As the software allows
30 April to 18 May (leg2) south from Balearic Islands aboard real-time visualization of the ongoing transect, it is a per-
the R/V Beautemps-Beaupré. The first leg (leg1) gave a gen- fect tool to scan the upper oceanic layer, where mesoscale
eral overview of the oceanic situation, followed by a more and submesoscale dynamics are the most intense. A total of
intensive survey (leg2) planned on the basis of daily re- 10 000 km of transects crossing numerous and various struc-
lease of near-real-time satellite imagery, altimetry and la- tures was recorded during the cruises, giving us the unique
grangian analyses, performed on land by using a dedicated opportunity to explore fine-scale patterns of the upper layer
package (http://www.mio.univ-amu.fr/SPASSO/ last access: of the Western Mediterranean basin.
19 February 2020, as in Nencioli et al., 2011; de Verneil et
al., 2017). Satellite data of altimetry, sea surface tempera-
4.3 MVP deployments
ture and ocean color revealed ubiquity throughout the cruise
period of very fine oceanic structures such as dipolar struc- During PROTEVS-MED 2017 surveys a moving vessel pro-
tures or tenuous fronts. A special focus was on the region filer (MVP-200) – a computer-controlled winching system
south of Mallorca, where fronts were detected by altimetry- that can deploy and recover a sensor from a ship that is un-
derived currents and diagnosis (e.g., Finite Singular Lya- derway – was deployed for finer transects. The sensor was
punov Exponents; d’Ovidio et al., 2004) and by contrasting an AML CTD sensor embedded in a free-fall fish. At 2–4 kn,
surface chlorophyll a concentrations and confirmed by high- it was possible to monitor the 0–400 m layer with a horizon-
frequency flow cytometry analyses of phytoplankton per- tal resolution of less than 1 km. To remove spurious salinity
formed onboard (data not included in the present dataset). A values due to bubbles when the instrument is surfacing, the
Lagrangian strategy was specifically set up in order to study minimum pressure for valid record was set to 1 dbar. A pecu-
the structure and growth rate (at 24 h timescale) of the various liar transect was monitored using, successively, SEASOAR,
phytoplankton groups as defined by flow cytometry measure- MVP and CTD casts, given the opportunity to compare the
ments as in Marrec et al. (2018). Lastly, it is noticeable that a three techniques.
companion campaign (PRE-SWOT) managed by IMEDEA–
SOCIB was conducted in the same area and during the same
4.4 rapidCAST deployments
period aboard the R/V García del Cid (not included in the
present dataset; see Barceló-Lull et al., 2018). During PROTEVS-MED 2018 a free-fall CTD system, called
rapidCAST (Teledyne Marine; http://www.teledynemarine.
Earth Syst. Sci. Data, 12, 441–456, 2020 www.earth-syst-sci-data.net/12/441/2020/P. Garreau et al.: PROTEVS-MED field experiments 447
com/rapidcast, last access: 19 February 2020), was tested icant (i.e., with a satisfactory signal-to-noise ratio) data that
for three transects near the Balearic Islands. It was equipped are additionally formatted to a text file.
with the “rapidCTD - underway profiler”, proposed by Vale- Note that data processed by CASCADE software
port. Bluetooth communication allowed real-time evaluation can be requested from the SISMER repository, collect-
of each profile when the probe surfaced near the ship deck. ing and processing progressively all VMADCPs from
This system sampled the water layer from 0 to 400 m, with French research vessels (https://sextant.ifremer.fr/record/
a navigation speed in the range of 5–6 kn and a resolution 60ad1de2-c3e1-4d33-9468-c7f28d200305/en/index.htm,
similar to SeaSoar (about 2 km). last access: 19 February 2020).
4.5 TSG 4.7 Data metrological traceability and calibration
During the cruises, a Seabird SBE-21 thermosalinograph SBE-9 temperature and conductivity sensors deployed on all
recorded the sea surface temperature and conductivity. The CTD sensors were calibrated before and after each campaign
inlet was equipped with an SBE-38 thermometer. The or at least once a year in the SHOM’s thermo-regulated baths,
recorded sea surface temperature and salinity contributed to whose temperature can be stabilized to less than 1 mK (peak
the Global Ocean Surface Underway Data (GOSUD) pro- to peak) during control and calibration operation. Such a pro-
gram (Gosud, 2016). The metrological traceability and the cedure allows the monitoring of sensors drifts between cali-
data treatment are insured according to the procedures de- brations and the detection of anomalies. In the cases in which
scribed in Gaillard et al. (2015), which explains the delayed sensors kept a good linearity, which is the most common,
mode processing of datasets and presents an overview of the data are corrected with offset-slope coefficients. Figure 3a
resulting quality. The calibrations are complemented with shows a review of the corrections applied on data at 15 ◦ C,
rigorous adjustments on water samples, leading to a salinity after the calibrations of SBE-3 sensors used for PROTEVS-
accuracy of about 0.01 or less. MED campaigns. Figure 3b shows a review of corrections
applied at 40 mS cm−1 after the calibrations of SBE-4 sen-
4.6 VMADCP sors.
The temperature of the thermo-regulated bath is monitored
The hardware used, its configurations and the way it is used with SBE-35, which is used as a laboratory reference tem-
are similar on the R/V Pourquoi Pas?, R/V L’Atalante and perature sensor. It is linked to the International Tempera-
R/V Beautemps Beaupré. The VMADCPs are the 150 and ture Scale of 1990 (ITS-90), thanks to calibrations performed
38 kHz Ocean Surveyor by Teledyne RDI. They are both once a year in a triple-point-of-water cell and at the melt-
monobloc antennas using the beam-forming process to form ing point of gallium. These reference cells are regularly cal-
four beams oriented towards 30◦ from the vertical. Nomi- ibrated by the French National Metrology Institute (NMI)
nally, they emitted a ping per second, which allows the en- LNE-CNAM. The calibration expanded uncertainty of SBE-
semble to have less-noisy profiles. Two ensembles are rou- 3 sensors is between 1.8 and 2.3 mK, according to the resid-
tinely processed: ual linearity errors of SBE-3 sensors.
The conductivity calibration of SBE-4 sensors is made in
– a short-term average (hereafter STA) which gathers and
the same bath during the temperature calibration. Seawater
averages the pings of a 2 min window and makes an en-
samples are taken into the bath and tested against Autosal
semble of at least 120 pings,
and Portasal salinometers. The calibration procedure and the
– a long-term average (hereafter LTA) made of 600 pings propagation of uncertainties to the calculated salinities from
or averaged over 10 min. SBE-9 data are described in Le Menn (2011). Practical-
salinity expanded uncertainty varies from 0.0032 to 0.0034.
The series of geometric transformations necessary to pass In 2015, the SHOM laboratory took part in the JCOMM in-
from beam coordinates along beam data to absolute geo- tercomparison for seawater salinity measurements (JCOMM,
graphic coordinate and geophysical velocity are performed 2015), showing that Autosal and Portasal measurements are
thanks to VMDAS software from Teledyne RDI. It combines within ±0.001 compared to other participating laboratories.
the position (latitude and longitude) from the DGPS (Differ- Note that the same process was done in the framework of
ential Global Positioning System) Aquarius and Octans cen- an international network for the TSG data of the French re-
tral system with the PHINS inertial navigation system from search vessel (see Sect. 4.5 and Table 2). Unfortunately, the
IXSEA (that provides vessel attitude data: pitch, roll, heav- MVP and the rapidCAST sensors were not available for such
ing) to provide synchronized single-ping Earth coordinate a common process and were calibrated directly by the con-
data (file.ENX) and short- and long-term ensembles (STA structor, but a comparison with the in situ records with cali-
and LTA). brated SBE sensors can be carried out. As the optical proper-
This native format (.STA and .LTA) was also processed ties and oxygen concentration were used as tracers only, no
with WinADCP in order to extract and provide only signif- calibration process was performed.
www.earth-syst-sci-data.net/12/441/2020/ Earth Syst. Sci. Data, 12, 441–456, 2020448 P. Garreau et al.: PROTEVS-MED field experiments
Table 2. WMO index of Argo float and surface drifters (SVP) dropped during PROTEVS-MED surveys. Surface temperature and salinity
recorded by thermosalinograph (TSG) are tagged by ship identifier. All data are available from the CORIOLIS website at: http://www.coriolis.
eu.org/Data-Products/Data-Delivery/Data-selection (last access: 19 February 2020) by entering the WMO numbers in the field “Platform
codes”, adjusting the time period of interest (e.g., 1 January 2018 to 30 June 2019) and clicking on “refresh”. The web interface displays the
trajectories of the buoys, profilers or TSG and can be used to find additional opportunity data. The data can then be downloaded in NetCDF
format.
ARGO float SVP surface drifter TSG thermosalinograph
WMO identifier: WMO identification number (platform identifier):
http://www.ifremer.fr/argoMonitoring/ (holey-sock depth): http://www.gosud.org
(last access: 19 February 2020) http://www.jcommops.org/dbcp/ (last access: 19 February 2020)
(last access: 19 February 2020)
PROTEVS-MED 2015_leg1 6901707 6100536 (50 m) FMCY
6901708 6100537 (50 m)
6100538 (50 m)
6100539 (50 m)
6100540 (50 m)
PROTEVS-MED 2015_leg2 6100863 (50 m) FABB
6100864 (50 m)
6100865 (50 m)
6100866 (50 m)
6100867 (50 m)
PROTEVS-MED 2016 6101525 (75 m) FABB
6101526 (75 m)
6101527 (75 m)
6101528 (75 m)
6101529 (50 m)
6101530 (50 m)
6101531 (50 m)
6101532 (50 m)
6101533 (50 m)
6101534 (50 m)
6101535 (50 m)
6101536 (50 m)
6101537 (50 m)
6101538 (50 m)
6101539 (50 m)
6101540 (50 m)
6101541 (50 m)
6101542 (50 m)
6101631 (50 m)
PROTEVS-MED 2017_leg1 6902764 6101634 (50 m) FNCM
6902765 6101639 (50 m)
6902767 6101635 (50 m)
6101637 (50 m)
6101636 (50 m)
6101643 (50 m)
6101641 (50 m)
6101647 (50 m)
PROTEVS-MED 2017_leg2 6101648 (50 m) FNCM
6101633 (50 m)
6101638 (50 m)
6101640 (50 m)
6101632 (50 m)
6101642 (50 m)
PROTEVS-MED-SWOT 2018_leg1 6902844 6101669 (50 m) FABB
6102612 (50 m)
6101677 (100 m)
6102613 (100 m)
PROTEVS-MED-SWOT 2018_leg2 6101671 15 m FABB
6101678 15 m
6101672 15 m
6102615 15 m
6101670 50 m
6101674 50 m
Earth Syst. Sci. Data, 12, 441–456, 2020 www.earth-syst-sci-data.net/12/441/2020/P. Garreau et al.: PROTEVS-MED field experiments 449
Figure 3. (a) Review of corrections applied on data at 15 ◦ C, after the calibrations of SBE-3 sensors. (b) Review of corrections applied on
data at 40 mS cm−1 , after the calibrations of SBE-4 sensors.
4.8 Data processing levels tioned as vertical profiles at the mean geographical po-
sition of the ascending or descending record.
Three levels of processing are available for each dataset:
Temperature and salinity data were also compared to the his-
– Level 0 (L0) consists of the direct output of sensors at torical data in the neighborhood of the profiles or transects
full temporal resolution. using the validated CORA database distributed by the Coper-
nicus Marine and Environment Service (Cabanes et al., 2013;
– Level 1 (L1) displayed data in ASCII (.csv) or netCDF Szekely et al., 2019). PROTEVS-MED data are not yet in-
(.nc) files are only processed from the software of the cluded in this database but will be transmitted for a future
constructor, keeping the full resolution and computing release.
the derived variables into standard units. A recent in- All gridded profiles or transects were plotted for a vi-
strumental system (AML and Valeport probes) directly sual quality check and are available as “quick looks” on
provides L1 files. L1 files are corrected for eventual drift the repository. The L1 and/or L2 dataset is released in the
of sensors. present database. L0 data remain available in constructor for-
mat upon request to the data-providing institution (SHOM;
– Level 2 (L2) is proposed as gridded, controlled and re- data-support@shom.fr).
sampled data in netCDF files (.nc). Gridded datasets for
salinity and temperature were resampled vertically ev-
4.9 Companion datasets
ery meter, removing spikes, spurious values and density
inversions when they persist after the first process sup- During the field experiments, surface drifters with holey
plied by the sensor manufacturer. They are then posi- socks located at 100, 75, 50 or 15 m depth were deployed,
www.earth-syst-sci-data.net/12/441/2020/ Earth Syst. Sci. Data, 12, 441–456, 2020450 P. Garreau et al.: PROTEVS-MED field experiments Figure 4. Overview of some transects or profiles recorded during the PROTEVS-MED fields experiments: (a) dual-core eddy in NBF in 2016 (39.96◦ N, 4.74◦ E – 39.93◦ N, 6.20◦ E), (b) three-layered eddy in Algerian Basin (38.5◦ N, 4.87◦ E – 38.75◦ N, 5.88◦ E; 2018), (c) SCV of LIW front of Toulon (42.17◦ N, 6.14◦ E – 42.78◦ N, 6.10◦ E; 2015), (d) Northern Current position and intensity (2015), (e) cross-frontal (NBF) transect (40.35◦ N, 6.43◦ E – 41.92, 4.01◦ E; 2017), (f) and staircase structure in temperature front of Sardinia (2016), vein of cold water from the Gulf of Lion in Catalan Sea (40.68◦ N, 7.5◦ E; 2017). The reader will find similar quick looks of the transects for all the surveys in the data repository. Earth Syst. Sci. Data, 12, 441–456, 2020 www.earth-syst-sci-data.net/12/441/2020/
P. Garreau et al.: PROTEVS-MED field experiments                                                                             451

given the opportunity at the beginning of their track to per-     vection area. In the NBF, a shift between a surface layer front
form a Lagrangian survey of observed structures.                  and a deep front is revealed. As long as most of the experi-
    A few Argo floats were also dropped and experienced           ments presented here were performed during late winter or
the first PROTEVS-MED dedicated mission with high tem-            early spring in the vicinity of deep convection area, they fre-
poral resolution (daily cycle) and parking depths adjusted        quently showed small-scale structures that are likely formed
to the observations to maintain the drifters as long as pos-      by convection. For instance, from the north to the south, in
sible within the targeted structures (typically 100 m deep).      Fig. 4e, one can observe successively the – probably partial –
After the drifter left the structure, it used the usual Argo      convection area, the formation of SCVs composed of WIW in
standard procedure in the Mediterranean (i.e., a 5 d cycle        the mesoscale adjustment area around the convection chim-
and a parking depth of 350 m). Already stored in dedicated        ney, the surface thermal front and finally a deeper front at
and accessible stable repositories, they can be found us-         40.6◦ N.
ing their WMO (World Meteorological Organization) iden-              Over the abyssal plain near the bottom, the classical CTD
tifiers (see Table 2). Ancillary data can be found on different   station highlighted different Western Mediterranean deep
repositories by selecting dates and locations corresponding       water (WMDW); besides this, under the LIW layer, where
to PROTEVS-MED surveys.                                           the profiles foster a double-diffusion process, staircase struc-
                                                                  tures in temperature and salinity were commonly observed,
                                                                  as in Onken and Brambilla (2003; Fig. 4f).
5   Overview of the selected observations                            MVP transects measured in February 2017, in front of
                                                                  Cap de Creus, across Blanes Canyon and off the coast of
When deployed together, VMADCP and SeaSoar provided               Barcelona, showed cold water movement along the Cata-
a unique synoptic view along transects. It was also possi-        lan shelf and slope (Fig. 4g). The WIW observed along the
ble to simultaneously observe the density and the velocity        Catalan slope was relatively fresh and cold water originating
fields in the subsurface layer, showing the importance of         from the Gulf of Lion’s shelf. The WIW was progressively
the geostrophy even at a fine scale (on the order of 10 km).      entrained and mixed with the AW and LIW while flowing
The temperature and salinity fields were patchier than ex-        southwards in a less intense way than the dense water cas-
pected, but the thermal expansion and the saline contraction      cading described by Durrieu de Madron et al. (2013).
coefficient of seawater often compensate for, and lead to,           Similar and extensive quick looks of all SeaSoar, MVP or
a smoother density (and thus dynamical) field. The struc-         rapidCAST transects, and XBT and CTD profiles are plotted
ture of observed anticyclonic eddies also appeared more           and available as additional resources on the data repository.
complex than formerly described and was commonly com-
posed of many different water masses. Eddies with similar
altimetric or surface thermal signatures can be very differ-      6   Data availability
ent hydrographically. For instance, a dual-core anticyclonic
eddy, observed east of the island of Menorca in March 2016        Data are freely available on the SEANOE repository
(Fig. 4a), was composed of a superposition of winter in-          (https://doi.org/10.17882/62352; Dumas et al., 2018). Some
termediate water and Atlantic water, and in May 2018 a            of the data are already being investigated or are in publica-
three-core eddy was detected (Fig. 4b). The exact process of      tions; the authors would appreciate collaboration proposals.
their formation remains to be investigated. One can invoke        For an initial overview, quick looks of all SeaSoar, MVP or
the coalescence of pre-existing eddies, the extraction of wa-     rapidCAST transects and XBT and CTD profiles are avail-
ter masses from neighboring structures or ageostrophic pro-       able in catalogues on the repository.
cesses. Measurements reveal submesoscale (ageostrophic)              SeaSoar, MVP, rapidCAST, CTD, LADCP and XBT data
dynamics both in the eddy cores (upwelling and down-              are stored in both CSV (ASCII) and netCDF files for L1 (di-
welling) and at eddy edges (symmetric instabilities, fron-        rectly extracted from the instrument or constructor software)
togenesis). Intra-pycnocline structures that were subducted,      and in netCDF for L2 (resampled every meter) files.
stirred or locally formed were commonly observed at the              For TSG, the present database provides only L1 files; L2
edge of gyres.                                                    (validated and resampled data) data are available from the
   In the Northern Current, stirring appeared in both tracers     dedicated repository (see Table 2).
and velocity fields, and an SCV formed by LIW detached in            For the sake of simplicity, VMADCP files were concate-
front of Toulon (Fig. 4c) was observed, as confirmed by ob-       nated over each cruise duration to provide a single file per
served swirling velocities on VAMDCP records. It was also         cruise; for a given cruise, the data are a function of time and
topped by a surface cyclonic gyre. Currents were routinely        depth within the single file dedicated to the cruise.
recorded, and particular attention was paid to the Northern          Data are displayed by cruises and instruments, and the syn-
Current dynamics, as shown Fig. 4d.                               tax is
   The fine-scale structure of the NBF showed the interaction        instrument_data-type_cruises_starting-date-of-
between the front and the SCVs generated in the deep con-         record_index.file-type, where

www.earth-syst-sci-data.net/12/441/2020/                                            Earth Syst. Sci. Data, 12, 441–456, 2020
452 P. Garreau et al.: PROTEVS-MED field experiments
instruments = ctd,seasoar,ladcp,xbt,rapidcast,mvp, reference level for the thermal wind equation and hydrogra-
vmadcp_xxx phy.
data-type = “L1” or “L2” Despite the suspected lack of accuracy of the sensors due
cruises = cruise and leg name to the velocity of the platforms (SeaSoar, MVP, rapidCAST),
date = the date of the first record in the file this experiment of fast and high-resolution sampling revealed
index = sequential index of this kind of profile recorded fine oceanic patterns never described before in the Western
during the cruise Mediterranean. In situ observations of ageostrophic dynam-
file-type = csv(.csv) or netcdf(.nc). ics remain rare, and the synergy between these observations
Additionally, data extracted from onboard automatic ac- and theory, and then between these observations and mod-
quisition are provided in netCDF files for the ship navigation. eling, should be very fruitful. These data should contribute
Future PROTEVS-MED experiments are scheduled, and re- to the knowledge of small scales and fill some of the gaps
sults will be added to the repository. in observing systems in the Mediterranean Sea (Tintore et
al., 2019). As numerical modeling resolution becomes higher
(on the order of few hundred meters), the simulation of sub-
7 Conclusions mesoscale processes (layering, subduction, stirring, vertical
velocities) is therefore expected, and this dataset, providing
The PROTEVS-MED dataset available through an unre- data at similar scales, is an opportunity to validate the sec-
stricted unique repository is an unprecedented opportunity ondary simulated circulation.
for the community to approach the fine-scale dynamics in
the Western Mediterranean Sea and more largely the sub-
mesoscale dynamics associated with strong mesoscale dy- Author contributions. SL, SC, PG and FD designed and con-
namics. In the framework of the high-resolution altimetry ducted the field experiments as principal investigators. ML man-
this dataset can help to characterize the scales of fine-scale aged the calibration and the metrological traceability of SBE sen-
structures in the Western Mediterranean Sea and to design sors. VG carefully checked the dataset. All co-authors carried out
the experiments, participated in the cruise or processed the data. PG
combined experiments using high-resolution in situ mea-
and FD prepared the paper and the data, with contributions from all
surements (SeaSoar or MVP) and altimetry with the future
co-authors.
SWOT satellite (d’Ovidio et al., 2019). It also complements
the repeated glider lines maintained in the framework of the
MOOSE observatory (Coppola et al., 2019) and is useful for Competing interests. The authors declare that they have no con-
designing future combined multi-platform experiments. flict of interest.
During these campaigns, we had the opportunity to deploy
different instruments to obtain temperature, salinity and pos-
sibly other parameters profiles. Some transects were mea- Acknowledgements. The authors acknowledge that the French
sured successively using CTD and SeaSoar (all surveys) or government defense procurement and technology agency (Délé-
using CTD, SeaSoar and MVP-200 (PROTEVS-MED 2017). gation Générale de l’Armement) funded all the campaigns re-
Being easy to manage, only the rapidCAST has been tested ported here extensively through Protevs and Protevs II “programme
and used, except in 2018, when the SeaSoar failed. It pro- d’étude amont”. They thank the technical team at the French Naval
duced a similar result to the SeaSoar in temperature and Hydrologic and Oceanographic Service (SHOM) and the crews of
salinity. The SeaSoar is heavy to manage and needs a conse- the French navy ship Beautemps-Beaupré, the R/V Pourquoi Pas
? and the R/V L’Atalante for their contribution to the field experi-
quent research vessel for the winch system, a constant watch
ments.
on its navigation, and a calm sea state for launch and recov-
ery. Once deployed, the machine can stay at sea for days.
Thanks to the required ship velocity (about 9 kn), the Sea-
Financial support. This research has been supported by the Di-
Soar remains a perfect platform for identifying mesoscale rection Générale de l’Armement (grant no. PEA 082401).
structures before examining them in detail. It explores the
oceanic surface layer down to 400 m, which is sometimes a
bit too short in the Mediterranean context, missing deeper Review statement. This paper was edited by
parts of AEs or deep SCVs, but sufficient to describe impor- Giuseppe M. R. Manzella and reviewed by two anonymous
tant surface and subsurface dynamical features. For the same referees.
depth range an MVP-200 requires a ship velocity about 2–
4 kn and is then more devoted to short transects with higher
horizontal resolution. As it is a free-fall platform, its setting
is lighter, despite regular inspection of the cable and winch
every 10 h. In any case, when exploring a structure in detail,
a CTD network remains necessary, at least for having a valid
Earth Syst. Sci. Data, 12, 441–456, 2020 www.earth-syst-sci-data.net/12/441/2020/P. Garreau et al.: PROTEVS-MED field experiments 453
References Pouliquen, S., and Le Traon, P.-Y.: The CORA dataset: valida-
tion and diagnostics of in-situ ocean temperature and salinity
measurements, Ocean Sci., 9, 1–18, https://doi.org/10.5194/os-
Allen, J. T., Smeed, D. A., Tintoré, J., and Ruiz, S.: Mesoscale sub- 9-1-2013, 2013.
duction at the Almeria–Oran front: Part 1: Ageostrophic flow, Carret, A., Birol, F., Estournel, C., Zakardjian, B., and Testor,
J. Marine Syst., 30, 263–285, https://doi.org/10.1016/S0924- P.: Synergy between in situ and altimetry data to observe
7963(01)00062-8, 2001. and study Northern Current variations (NW Mediterranean
Allen, J. T., Painter, S. C., and Rixen, M.: Eddy trans- Sea), Ocean Sci., 15, 269–290, https://doi.org/10.5194/os-15-
port of Western Mediterranean Intermediate Water to 269-2019, 2019.
the Alboran Sea, J. Geophys. Res.-Oceans, 113, C04024, Coppola, L., Raimbault, P., Mortier, L., and Testor, P.: Monitor-
https://doi.org/10.1029/2007JC004649, 2008. ing the environment in the northwestern Mediterranean Sea, Eos,
Aulicino, G., Cotroneo, Y., Ruiz, S., Sánchez Román, A., 100, https://doi.org/10.1029/2019EO125951, 2019.
Pascual, A., Fusco, G., Tintoré, J., and Budillon, G.: Cotroneo, Y., Aulicino, G., Ruiz, S., Pascual, A., Budillon, G.,
Monitoring the Algerian Basin through glider observa- Fusco, G., and Tintoré, J.: Glider and satellite high resolution
tions, satellite altimetry and numerical simulations along monitoring of a mesoscale eddy in the algerian basin: Effects on
a SARAL/AltiKa track, J. Marine Syst., 179, 55–71, the mixed layer depth and biochemistry, J. Marine Syst., 62, 73–
https://doi.org/10.1016/j.jmarsys.2017.11.006, 2018. 88, https://doi.org/10.1016/j.jmarsys.2015.12.004, 2016.
Aulicino, G., Cotroneo, Y., Olmedo, E., Cesarano, C., Fusco, G., Cotroneo, Y., Aulicino, G., Ruiz, S., Sánchez Román, A., Torner
and Budillon, G.: In Situ and Satellite Sea Surface Salinity in Tomàs, M., Pascual, A., Fusco, G., Heslop, E., Tintoré, J., and
the Algerian Basin Observed through ABACUS Glider Measure- Budillon, G.: Glider data collected during the Algerian Basin Cir-
ments and BEC SMOS Regional Products, Remote Sens., 11, culation Unmanned Survey, Earth Syst. Sci. Data, 11, 147–161,
1361, https://doi.org/10.3390/rs11111361, 2019. https://doi.org/10.5194/essd-11-147-2019, 2019.
Barceló-Llull, B., Pascual, A., Díaz Barroso, L., Sánchez-Román, de Verneil, A., Rousselet, L., Doglioli, A. M., Petrenko, A. A., and
A., Casas, B., Muñoz, C., Torner, M., Alou, E., Cutolo, E., Moutin, T.: The fate of a southwest Pacific bloom: gauging the
Mourre, B., Allen, J., Aulicino, G., Cabornero, A., Calafat, impact of submesoscale vs. mesoscale circulation on biologi-
N., Capó, E., Cotroneo, Y., Cyr, F., Doglioli, A., d’Ovidio, cal gradients in the subtropics, Biogeosciences, 14, 3471–3486,
F., Dumas, F., Fernández, J.G., Gómez, Navarro, L., Gre- https://doi.org/10.5194/bg-14-3471-2017, 2017.
gori, G., Hernández-Lasheras, J., Mahadevan, A., Mason, d’Ovidio, F., Fernández, V., Hernández-García, E., and López,
E., Miralles, A., Roque, D., Rubio, M., Ruiz, I., Ruiz, S., C.: Mixing structures in the Mediterranean Sea from finite-
Ser-Giacomi, E., and Toomey, T.: PRE-SWOT Cruise Re- size Lyapunov exponents, Geophys. Res. Lett., 31, L17203,
port. Mesoscale and sub-mesoscale vertical exchanges from https://doi.org/10.1029/2004GL020328, 2004.
multi-platform experiments and supporting modeling simula- d’Ovidio, F., Pascual, A., Wang, J., Doglioli, A. M., Jing,
tions: anticipating SWOT launch (CTM2016-78607-P), 138 pp., Z., Moreau, S., Grégori, G., Swart, S., Speich, S., Cyr, F.,
https://digital.csic.es/handle/10261/172644, 2019. Legresy, B., Chao, Y., Fu, L., and Morrow, R. A.: Fron-
Borrione, I., Falchetti, S., and Alvarez, A.: Physical and dynamical tiers in Fine-Scale in situ Studies: Opportunities During
characteristics of a 300m-deep anticyclonic eddy in the Ligurian the SWOT Fast Sampling Phase, Front. Mar. Sci., 6, 168,
Sea (Northwest Mediterranean Sea): Evidence from a multi- https://doi.org/10.3389/fmars.2019.00168, 2019.
platform sampling strategy, Deep-Sea Res. Pt. I, 116, 145–164, Dumas, F., Garreau, P., Louazel, S., Correard, S., Fercoq, S.,
https://doi.org/10.1016/j.dsr.2016.07.013, 2016. Le Menn, M., Serpette, A., Garnier, V., Stegner, A., Le
Bosse, A., Testor, P., Mortier, L., Prieur, L., Taillandier, Vu, B., Doglioli, A., and Gregori, G.: PROTEVS-MED
V., d’Ortenzio, F., and Coppola, L.: Spreading of Lev- field experiments: Very High Resolution Hydrographic
antine Intermediate Waters by submesoscale coherent vor- Surveys in the Western Mediterranean Sea, SEANOE,
tices in the northwestern Mediterranean Sea as observed https://doi.org/10.17882/62352, 2018.
with gliders, J. Geophys. Res.-Oceans, 120, 1599–1622, Durrieu de Madron, X., Houpert, L., Puig, P., Sanchez-Vidal, A.,
https://doi.org/10.1002/2014JC010263, 2015. Testor, P., Bosse, A., Estournel, C., Somot, S., Bourrin, F., Bouin,
Bosse, A., Testor, P., Houpert, L., Damien, P., Prieur, L., Hayes, D., M.N., Beauverger, M., Beguery, L., Calafat, A., Canals, M.,
Taillandier, V., Durrieu de Madron, X., d’Ortenzio, F., Coppola, Cassou, C., Coppola, L., Dausse, D., D’Ortenzio, F., Font, J.,
L., Karstensen, J., and Mortier, L.: Scales and dynamics of Sub- Heussner, S., Kunesch, S., Lefevre, D., Le Goff, H., Martiìn,
mesoscale Coherent Vortices formed by deep convection in the J., Mortier, L., Palanques, A., and Raimbault, P.: Interaction
northwestern Mediterranean Sea, J. Geophys. Res.-Oceans, 121, of dense shelf water cascading and open-sea convection in the
7716–7742, https://doi.org/10.1002/2016JC012144, 2016. northwestern Mediterranean during winter 2012, Geophys. Res.
Bosse, A., Testor, P., Mayot, N., Prieur, L., D’Ortenzio, F., Lett., 40, 1379–1385, 2013.
Mortier, L., Goff, H.L., Gourcuff, C., Coppola, L., Lavi- Escudier, R., Mourre, B., Juza, M., and Tintoré, J.: Subsurface cir-
gne, H., and Raimbault, P.: A submesoscale coherent vor- culation and mesoscale variability in the Algerian subbasin from
tex in the Ligurian Sea: From dynamical barriers to biolog- altimeter-derived eddy trajectories, J. Geophys. Res.-Oceans,
ical implications, J. Geophys. Res.-Oceans, 122, 6196–6217, 121, 6310–6322, https://doi.org/10.1002/2016JC011760, 2016a.
https://doi.org/10.1002/2016JC012634, 2017. Escudier, R., Renault, L., Pascual, A., Brasseur, P., Chel-
Cabanes, C., Grouazel, A., von Schuckmann, K., Hamon, M., ton, D., and Beuvier, J.: Eddy properties in the Western
Turpin, V., Coatanoan, C., Paris, F., Guinehut, S., Boone, C., Mediterranean Sea from satellite altimetry and a numeri-
Ferry, N., de Boyer Montégut, C., Carval, T., Reverdin, G.,
www.earth-syst-sci-data.net/12/441/2020/ Earth Syst. Sci. Data, 12, 441–456, 2020454 P. Garreau et al.: PROTEVS-MED field experiments cal simulation, J. Geophys. Res.-Oceans, 121, 3990–4006, tion to Coastal Eddy Formation, J. Atmos. Ocean. Tech., 35, https://doi.org/10.1002/2015JC011371, 2016b. 739–762, https://doi.org/10.1175/JTECH-D-17-0010.1, 2017. Estournel, C., Testor, P., Taupier-Letage, I., Bouin, M.-N., Coppola, Lévy, M., Ferrari, R., Franks, P. J. S., Martin, A. P., and Rivière, P.: L., Durand, P., Conan, P., Bosse, A., Brilouet, P.-E., Beguery, Bringing physics to life at the submesoscale, Geophys. Res. Lett., L., Belamari, S., Béranger, K., Beuvier, J., Bourras, D., Canut, 39, L14602, https://doi.org/10.1029/2012GL052756, 2012. G., Doerenbecher, A., Durrieu de Madron, X., D’Ortenzio, F., Lévy, M., Franks, P. J., and Smith, K. S.: The role of submesoscale Drobinski, P., Ducrocq, V., Fourrié, N., Giordani, H., Houpert, currents in structuring marine ecosystems, Nat. Commun., 9, 1– L., Labatut, L., Lebeaupin Brossier, C., Nuret, M., Prieur, 15, 2018. L., Roussot, O., Seyfried, L., and Somot, S.: HyMeX-SOP2: Marshall, J. and Schott, F.: Open-ocean convection: Ob- The Field Campaign Dedicated to Dense Water Formation in servations, theory, and models, Rev. Geophys. 37, 1–64, the Northwestern Mediterranean, Oceanography 29, 196–206, https://doi.org/10.1029/98RG02739, 1999. https://doi.org/10.5670/oceanog.2016.94, 2016. McWilliams, J. C.: Submesoscale, coherent vor- Gaillard, F., Diverres, D., Jacquin, S., Gouriou, Y., Grelet, J., Menn, tices in the ocean, Rev. Geophys., 23, 165–182, M. L., Tassel, J., and Reverdin, G.: Sea surface temperature https://doi.org/10.1029/RG023i002p00165, 1985. and salinity from French research vessels, 2001–2013, Scientific McWilliams, J. C.: Submesoscale currents in the ocean, P. R. Data, 2, 150054, https://doi.org/10.1038/sdata.2015.54, 2015. Soc. A, 472, 20160117, https://doi.org/10.1098/rspa.2016.0117, Garreau, P., Dumas, F., Louazel, S., Stegner, A., and Le Vu, B.: 2016. High-Resolution Observations and Tracking of a Dual-Core An- Medoc Group: Observation of Formation of Deep Water ticyclonic Eddy in the Algerian Basin, J.Geophys. Res.-Oceans, in the Mediterranean Sea1969, Nature, 227, 1037–1040, 123, 9320–9339, https://doi.org/10.1029/2017JC013667, 2018. https://doi.org/10.1038/2271037a0, 1970. Giordani, H., Lebeaupin-Brossier, C., Léger, F., and Caniaux, G.: A Meloni, M., Bouffard, J., Doglioli, A. M., Petrenko, A. A., and PV-approach for dense water formation along fronts: Application Valladeau, G.: Toward science-oriented validations of coastal al- to the Northwestern Mediterranean, J. Geophys. Res.-Oceans, timetry: application to the Ligurian Sea, Remote Sens. Environ., 122, 995–1015, https://doi.org/10.1002/2016JC012019, 2017. 224, 275–288, https://doi.org/10.1016/j.rse.2019.01.028, 2019. Gosud: GOSUD-Global Ocean Surface Underway data, SEANOE, Margirier, F., Bosse, A., Testor, P., L’Hévéder, B., Mortier, L., https://doi.org/10.17882/47403, 2016. and Smeed, D.: Characterization of Convective Plumes As- Heslop, E. E., Sánchez-Román, A., Pascual, A., Rodríguez, sociated With Oceanic Deep Convection in the Northwest- D., Reeve, K. A., Faugère, Y., and Raynal, M.: Sentinel- ern Mediterranean From High-Resolution In Situ Data Col- 3A Views Ocean Variability More Accurately at Finer lected by Gliders, J. Geophys. Res.-Oceans, 122, 9814–9826, Resolution, Geophys. Res. Lett., 44, 12367–12374, https://doi.org/10.1002/2016JC012633, 2017. https://doi.org/10.1002/2017GL076244, 2017. Marrec, P., Grégori, G., Doglioli, A. M., Dugenne, M., Della Penna, Houpert, L., Durrieu de Madron, X., Testor, P., Bosse, A., A., Bhairy, N., Cariou, T., Hélias Nunige, S., Lahbib, S., Rougier, D’Ortenzio, F., Bouin, M. N., Dausse, D., Le Goff, H., G., Wagener, T., and Thyssen, M.: Coupling physics and biogeo- Kunesch, S., Labaste, M., Coppola, L., Mortier, L., and chemistry thanks to high-resolution observations of the phyto- Raimbault, P.: Observations of open-ocean deep convection plankton community structure in the northwestern Mediterranean in the northwestern Mediterranean Sea: Seasonal and inter- Sea, Biogeosciences, 15, 1579–1606, https://doi.org/10.5194/bg- annual variability of mixing and deep water masses for the 15-1579-2018, 2018. 2007–2013 Period, J. Geophys. Res.-Oceans, 121, 8139–8171, Millot, C.: Circulation in the Western Mediterranean Sea, https://doi.org/10.1002/2016JC011857, 2016. J. Marine Syst., 20, 423–442, https://doi.org/10.1016/S0924- JCOMM: Pilot intercomparison project for seawater salinity 7963(98)00078-5, 1999. measurements, final report. World Meteorological Organiza- Millot, C. and Taupier-Letage, I.: Circulation in the Mediterranean tion (WMO), Intergovernmental Oceanographic Commission: Sea, in: The Mediterranean Sea, Handbook of Environmental JCOMM technical report, no. 84, 2015. Chemistry, edited by: Saliot, A., Springer, Berlin, Heidelberg, Jones, H. and Marshall, J.: Convection with Rotation in a Neu- 29–66, https://doi.org/10.1007/b107143, 2005. tral Ocean: A Study of Open-Ocean Deep Convection, J. Millot, C., Taupierletage, I., and Benzohra, M.: The Algerian Ed- Phys. Oceanogr., 23, 1009–1039, https://doi.org/10.1175/1520- dies, Earth-Sci. Rev., 27, 203–219, https://doi.org/10.1016/0012- 0485(1993)0232.0.CO;2, 1993. 8252(90)90003-E, 1990. Jones, H. and Marshall, J.: Restratification after Deep Convection, J. Nencioli, F., d’Ovidio, F., Doglioli, A. M., and Petrenko, A. A.: Phys. Oceanogr., 27, 2276–2287, https://doi.org/10.1175/1520- Surface coastal circulation patterns by in-situ detection of La- 0485(1997)0272.0.CO;2, 1997. grangian coherent structures, Geophys. Res. Lett., 38, L17604, Knoll, M., Borrione, I., Fiekas, H.-V., Funk, A., Hemming, M. P., https://doi.org/10.1029/2011GL048815, 2011. Kaiser, J., Onken, R., Queste, B., and Russo, A.: Hydrography Niewiadomska, K., Claustre, H., Prieur, L., and d’Ortenzio, and circulation west of Sardinia in June 2014, Ocean Sci., 13, F.: Submesoscale physical-biogeochemical coupling across 889–904, https://doi.org/10.5194/os-13-889-2017, 2017. the Ligurian current (northwestern Mediterranean) using Le Menn, M.: About uncertainties in practical salinity calculations, a bio-optical glider, Limnol. Oceanogr., 53, 2210–2225, Ocean Sci., 7, 651–659, https://doi.org/10.5194/os-7-651-2011, https://doi.org/10.4319/lo.2008.53.5_part_2.2210, 2008. 2011. Onken, R. and Brambilla, E.: Double diffusion in the Mediter- Le Vu, B., Stegner, A., and Arsouze, T.: Angular Momentum Eddy ranean Sea: Observation and parameterization of salt Detection and Tracking Algorithm (AMEDA) and Its Applica- Earth Syst. Sci. Data, 12, 441–456, 2020 www.earth-syst-sci-data.net/12/441/2020/
You can also read