Reduced light absorption of black carbon (BC) and its influence on BC-boundary-layer interactions during "APEC Blue"
←
→
Page content transcription
If your browser does not render page correctly, please read the page content below
Atmos. Chem. Phys., 21, 11405–11421, 2021
https://doi.org/10.5194/acp-21-11405-2021
© Author(s) 2021. This work is distributed under
the Creative Commons Attribution 4.0 License.

Reduced light absorption of black carbon (BC) and its influence on
BC-boundary-layer interactions during “APEC Blue”
Meng Gao1,2,9 , Yang Yang1 , Hong Liao1 , Bin Zhu3 , Yuxuan Zhang4 , Zirui Liu5 , Xiao Lu6 , Chen Wang7 ,
Qiming Zhou2 , Yuesi Wang5 , Qiang Zhang8 , Gregory R. Carmichael7 , and Jianlin Hu1
1 Collaborative Innovation Center of Atmospheric Environment and Equipment Technology, Jiangsu Key Laboratory of
Atmospheric Environment Monitoring and Pollution Control (AEMPC), Nanjing University of Information Science &
Technology, Nanjing, 210044, China
2 Department of Geography, State Key Laboratory of Environmental and Biological Analysis,

Hong Kong Baptist University, Hong Kong SAR, 999077, China
3 Key Laboratory for Aerosol-Cloud-Precipitation of China Meteorological Administration,

Nanjing University of Information Science & Technology, Nanjing, 210044, China
4 School of Atmospheric Sciences, Nanjing University, Nanjing, 210023, China
5 State Key Laboratory of Atmospheric Boundary Layer Physics and Atmospheric Chemistry,

Institute of Atmospheric Physics, Chinese Academy of Sciences, Beijing, 100029, China
6 School of Atmospheric Sciences, Sun Yat-Sen University, Zhuhai 519082, China
7 Department of Chemical and Biochemical Engineering, The University of Iowa, Iowa City, IA 52242, USA
8 Ministry of Education Key Laboratory for Earth System Modeling, Department of Earth System Science,

Tsinghua University, Beijing, 100084, China
9 Hong Kong Branch of Southern Marine Science and Engineering Guangdong Laboratory (Guangzhou),

Hong Kong SAR, 999077, China

Correspondence: Meng Gao (mmgao2@hkbu.edu.hk) and Jianlin Hu (jianlinhu@nuist.edu.cn)

Received: 25 February 2021 – Discussion started: 17 March 2021
Revised: 22 June 2021 – Accepted: 24 June 2021 – Published: 29 July 2021

Abstract. Light absorption and radiative forcing of black         decline in the mass concentration of BC itself (52.0 %), and
carbon (BC) is influenced by both BC itself and its inter-        the lensing effect of BC (48.0 %). The reduction in coating
actions with other aerosol chemical compositions. Although        materials (39.4 %) contributed the most to the influence of
the changes in BC concentrations in response to emission          the lensing effect, and the reduced light absorption capability
reduction measures have been well documented, the influ-          (Eab ) contributed 3.2 % to the total reduction in AAOD. Re-
ence of emission reductions on the light absorption proper-       duced light absorption of BC due to emission control during
ties of BC and its influence on BC-boundary-layer interac-        APEC enhanced planetary boundary layer height (PBLH) by
tions has been less explored. In this study, we used the online   8.2 m. PM2.5 and O3 were found to have different responses
coupled WRF-Chem model to examine how emission con-               to the changes in the light absorption of BC. Reduced light
trol measures during the Asia-Pacific Economic Cooperation        absorption of BC due to emission reductions decreased near-
(APEC) summit affect the mixing state and light absorption        surface PM2.5 concentrations but near-surface O3 concen-
of BC, and the associated implications for BC-PBL interac-        trations were enhanced in the North China Plain. These re-
tions. We found that both the mass concentration of BC and        sults suggest that current measures to control SO2 , NOx , etc.
the BC coating materials declined during the APEC week,           would be effective in reducing the absorption enhancement
which reduced the light absorption and light absorption en-       of BC and in inhibiting the feedback of BC on the boundary
hancement (Eab ) of BC. The reduced absorption aerosol op-        layer. However, enhanced ground O3 might be a side effect of
tical depth (AAOD) during APEC was caused by both the             current emission control strategies. How to control emissions

Published by Copernicus Publications on behalf of the European Geosciences Union.
11406                                                               M. Gao et al.: Reduced light absorption of black carbon (BC)

to offset this side effect of current emission control measures         Although BC is mixed internally with other components, it is
on O3 should be an area of further focus.                               impossible for the system to be well-mixed, due to the irreg-
                                                                        ular shape of BC (Jacobson, 2001). A core-shell morphol-
                                                                        ogy is commonly established, with BC as the core and the
                                                                        coating materials (organics, sulfate, etc.) as the shell (Jacob-
1   Introduction                                                        son, 2001; Zhang et al., 2018). Numerous efforts have been
                                                                        made to explore the influence of aerosol components on in-
Black carbon (BC) in the atmosphere is produced both natu-              ternally mixed BC absorption (Cappa et al., 2012; Chen et
rally and by human activities, attributable to the incomplete           al., 2021; Bond et al., 2006; Fuller et al., 1999; Jacobson,
combustion of hydrocarbons (Bond et al., 2013; Ramanathan               2001; D. Liu et al., 2017; Onasch et al., 2012; Peng et al.,
and Carmichael, 2008). In addition to contributing to partic-           2016). It was proposed that the coating components (shell)
ulate matter and degraded air quality, it is the dominant ab-           could act as a lens to focus more photons onto the core to en-
sorber of visible solar radiation, playing a unique and pivotal         hance the light absorption of BC (Fuller et al., 1999). Bond
role in the Earth’s climate system (Bond et al., 2013; Menon            et al. (2006) estimated that this lensing effect would increase
et al., 2002; Ramanathan and Carmichael, 2008; Yang et al.,             the light absorption of BC by 50 %–100 %. Jacobson (2001)
2019). The absorption of BC occurs not only in the atmo-                reported a global average BC absorption enhancement fac-
sphere, but also when it is deposited over snow or ice, and it          tor of 2, whereas other values, from negligible (Cappa et al.,
triggers positive feedback and exerts positive radiative forc-          2012) to as high as 2.4 (Peng et al., 2016) have also been
ing (Flanner et la., 2007; Grieshop et al., 2009). The direct ra-       previously found. This lensing effect has also been recog-
diative forcing of atmospheric black carbon was estimated to            nized as an important factor affecting the radiative forcing
be 0.4 W m−2 (0.05–0.8 W m−2 ) (IPCC, 2014), and BC has                 of BC (Jacobson, 2001). In the last decade, efforts were also
been targeted in emission control policies to mitigate both air         made to develop models to predict the dynamic evolution of
pollution and global warming (Grieshop et al., 2009).                   aerosol mixing states (Ching et al., 2016; Curtis et al., 2017;
   Before the 1950s, intense emissions of BC were con-                  Matsui et al., 2013; Tian et al., 2014). For example, Mat-
centrated in North America and Western Europe. In recent                sui et al. (2013) developed a 2D aerosol bin scheme that can
decades, South and East Asia have emerged to become ma-                 resolve BC mixing state and BC aging processes. However,
jor source regions (Ramanathan and Carmichael, 2008). BC                these approaches are far too computationally expensive for
emitted from China is responsible for a quarter of total global         use in regional 3D models (Barnard et al., 2010).
emissions (Bond et al., 2004). Chemical transport model                    Over the past several years, the State Council of China has
simulations suggest that the residential sector is the leading          issued a comprehensive Air Pollution Prevention and Con-
source for mass concentration of BC in China, followed by               trol Action Plan (APPCAP), covering major emission sectors
the industrial sector (Li et al., 2016). Mean BC direct radia-          (Liang et al., 2017; Q. Zhang et al., 2019). Long-term obser-
tive forcing in China is ∼ 1.22 W m−2 , more than three times           vations of aerosol chemical composition indicate that both
the global mean forcing (Li et al., 2016), two-thirds to three-         concentrations of BC and other coating components have de-
fourths of which were contributed by local emissions of BC              clined rapidly (Gao et al., 2020b; Ji et al., 2019b; Zhou et
in China, and the rest by emissions in other countries (Li et           al., 2019). Although the changes in BC concentrations in
al., 2016; Yang et al., 2017).                                          response to emission reduction measures have been docu-
   Specific policies to address BC emissions have not been              mented (Ji et al., 2019b; Gao et al., 2020b), the influence of
implemented in China, yet multiple measures targeting                   emission reductions on the aging processes and light absorp-
PM2.5 reduction have resulted in declines in BC (Gao et al.,            tion of BC has been less explored (Y. Zhang et al., 2019b).
2018b; Yamineva and Liu, 2019). A number of observational               Zhang et al. (2018) observed that the declines in absorption
studies have revealed the declining trend of BC concentra-              of BC was mainly due to decreases in BC mass concentra-
tions in China in recent years (Ji et al., 2018, 2019a, b; Qin          tion (86 %), and that the weakening of BC light absorption
et al., 2019). From 2013 to 2018, the annual mean BC con-               capability also played a role (14 %). However, this finding
centrations in Beijing declined from 4.0 to 2.6 µg m−3 (Ji et           was formulated based on surface observations; little is known
al., 2019b). Associated changes in BC radiative forcing can             about the changes at upper layers. Given the importance of
be expected from declines in mass concentration of BC in                BC absorption in the upper boundary layer to the buildup of
China, while the radiative forcing of BC is influenced also             pollution (Ding et al., 2016), the impact of emission reduc-
by the changes in other aerosol components.                             tions on the light absorption of BC, and its implications for
   BC absorption is closely connected with the aging pro-               the development of boundary layer and pollution episodes, it
cess, which is defined as the interaction between BC and                needs further investigation. On 5–11 November 2014, Bei-
other aerosol chemical compositions (Jacobson, 2001). After             jing, China hosted the Asia-Pacific Economic Cooperation
being emitted from combustion processes, BC particles can               (APEC) conference, during which Beijing and surrounding
coagulate and grow by condensation, during which both self-             regions cooperated to implement short-term emission con-
coagulation and heterocoagulation happen (Jacobson, 2001).              trol measures to ensure good air quality. This event offers a

Atmos. Chem. Phys., 21, 11405–11421, 2021                                               https://doi.org/10.5194/acp-21-11405-2021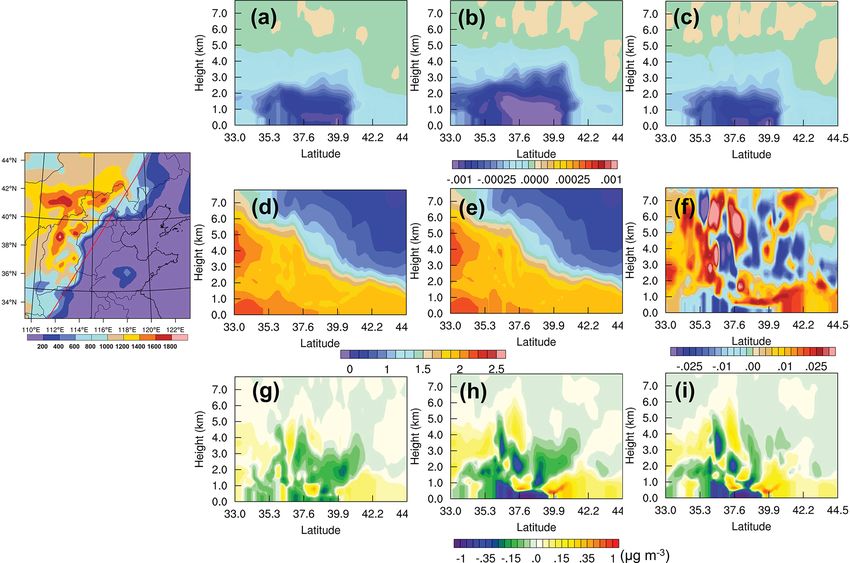
M. Gao et al.: Reduced light absorption of black carbon (BC)                                                              11407

great opportunity to study atmospheric composition and its            Anthropogenic emissions of particles and gases in China
physical and chemical responses to emission reductions.            in the model were taken from the multiresolution emission
   In this study, we address the following questions using the     inventory for China (MEIC) for year 2014 developed by
APEC event as a case study: (1) how did emission reductions        Tsinghua University (Zheng et al., 2018). Anthropogenic
affect the aging processes and light absorption of BC during       emissions for areas outside China were obtained from the
APEC; (2) what were the relative contributions of reduced          MIX Asian emission inventory developed for MICS-Asia
mass concentrations of BC, aging processes of BC, and the          and HTAP, which combines five emission inventories for
reshaped mixing state of BC to the changes in light absorp-        Asia (Li et al., 2017). Both MEIC and MIX data sets provide
tion of BC during APEC; and (3) how did these processes af-        monthly emissions of air pollutants at 0.25◦ × 0.25◦ grids,
fect BC-PBL interactions and the formation of air pollution?       which were interpolated to WRF-Chem modeling domains
In Sect. 2, we describe the WRF-Chem model configurations          in this study. We adopted the MEGAN model version 2.04
and the observational data sets used in this study. Results are    to estimate biogenic emissions of gases and particles online
presented in Sect. 3, and conclusions and discussions are pro-     (Guenther et al., 2006). The global fire emissions database
vided in Sect. 4.                                                  version 4 (GFEDv4) (Giglio et al., 2013) was used for open
                                                                   fire emissions.
                                                                      We simulated the period from 16 October to 13 Novem-
2     Methods and data                                             ber and discarded the first seven days as spin-up to avoid
                                                                   the influence of initial conditions. To explore the influ-
2.1    WRF-Chem model configuration
                                                                   ences of coordinated emission control measures on BC ab-
Version 3.8.1 of the WRF-Chem model (Grell et al., 2005)           sorption, we conducted multiple sets of simulations, as de-
was adopted in this study to simulate the emission, chem-          scribed in Table 1. For the NOCTL experiments, simulations
ical transformation, and deposition of aerosols, as well as        were conducted with no perturbations in emissions. For the
their interactions with radiation. We demonstrated in previ-       CTL experiments, emissions of SO2 , NOx , PM10 , PM2.5 ,
ous studies (Gao et al., 2016a, b, 2020b, c) that the spatiotem-   VOCs, and other species in Beijing were reduced by 39.2 %,
poral variations of air pollutants over China could be repro-      49.6 %, 66.6 %, 61.6 %, 33.6 %, and 50 %, respectively, over
duced effectively by WRF-Chem. WRF-Chem enables mul-               the November 3-11 period. Emissions in Inner Mongolia,
tiple options for gas phase chemistry and aerosol modules          Shanxi, Hebei, Tianjin, and Shandong were reduced by 35 %.
(Grell et al., 2005). We employed the carbon bond mech-            These perturbation factors were taken from the BMEPB re-
anism version Z (CBMZ) gas phase chemistry (Zaveri and             ports (Gao et al., 2017). The locations of these provinces are
Peters, 1999) coupled with the model for simulating aerosol        marked in Fig. 1 in Gao et al. (2017).
interactions and chemistry (MOSAIC) (Zaveri et al., 2008)             The influence of BC absorption under different assump-
aerosol module in this study. MOSAIC treats size-resolved          tions, including external and core-shell mixing and with or
aerosol species, and we used 8 bins version in this study, cor-    without emission reductions (1BC-Ext-NOCTL , 1BC-Ext-CTL ,
responding to the particle diameter ranges of 0.039–0.078,         1BC-CS-NOCTL , 1BC-CS-CTL , and 1BC-CYSN-CS ), can be de-
0.078–0.156, 0.156–0.312, 0.312–0.625, 0.625–1.25, 1.25–           rived with Eqs. (1)–(5) below. The description of each simu-
2.5, 2.5–5.0, 5.0–10.0 µm, respectively. Secondary organic         lation is documented in Table 1.
aerosol (SOA) formation in MOSAIC was simulated with a
volatility basis set (VBS) (Shrivastava et al., 2011). We con-     1BC-Ext-NOCTL = NOCTLExt − NOCTLExt-nobc                   (1)
figured two nested domains with horizontal resolutions of 81       1BC-Ext-CTL = CTLExt − CTLExt-nobc                         (2)
and 27 km, and 31 vertical layers up to a pressure level of        1BC-CS-NOCTL = NOCTLCS − NOCTLCS-nobc                      (3)
50 hPa. The configured domains cover most areas of East
                                                                   1BC-CS-CTL = CTLCS − CTLCS-nobc                            (4)
Asia and focus on the North China region (same as Fig. 1
in Gao et al., 2017). Other chosen options for key physi-          1BC-CS-CYSN = CYSNCS − CYSNCS-nobc                         (5)
cal parameterizations follow Gao et al. (2016b). Meteoro-
logical initial and boundary conditions were provided by the       The influence of emission reductions during APEC on
NCEP 1◦ × 1◦ degree final reanalysis data set (FNL), and           changes in the light absorption of BC and associated changes
chemical initial and boundary conditions were obtained from        in meteorological and pollution conditions under exter-
the MOZART global chemistry simulations (Emmons et al.,            nal and core-shell mixing assumptions (1emission-Ext and
2010). We used the YSU scheme in WRF-Chem to simu-                 1emission-CS ) can be inferred with Eqs. (6)–(7) below. We use
late the evolution of boundary layer, and the YSU scheme           Eq. (8) to derive the impact of changed BC aging processes
defines the top of the boundary layer using the Richardson         by comparing the differences between core-shell simulation
number (Hong et al., 2010). To allow the effects of aerosol        and external mixing simulation. The influences of reduced
on meteorological conditions in the model, we did not apply        coating due to emission control measures during APEC are
observational nudging or reanalysis nudging.                       calculated with Eq. (9). We use Eq. (10) to derive the influ-
                                                                   ence of changes in the light absorption enhancement (Eab ) of

https://doi.org/10.5194/acp-21-11405-2021                                        Atmos. Chem. Phys., 21, 11405–11421, 2021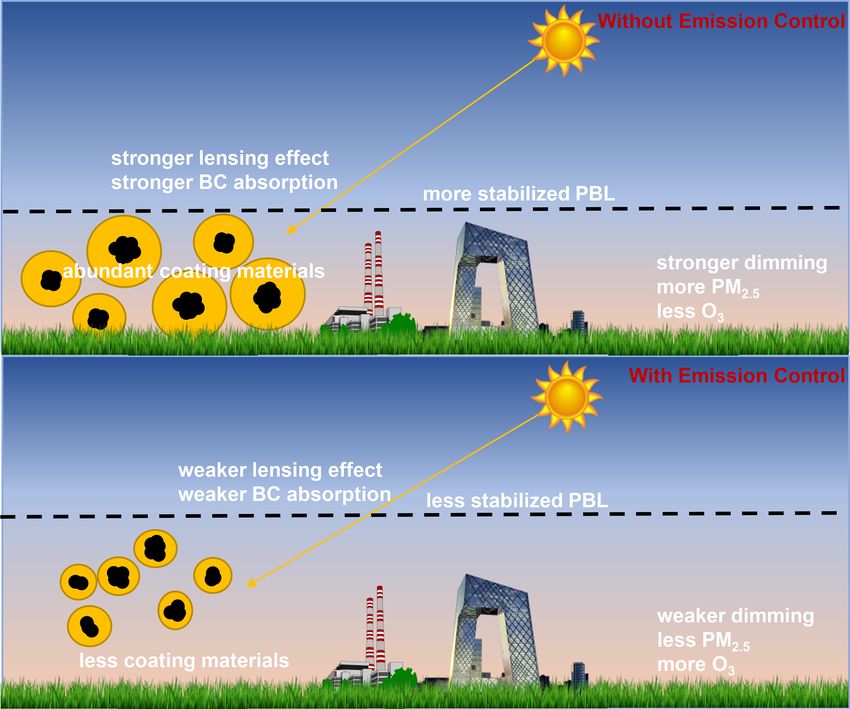
11408                                                              M. Gao et al.: Reduced light absorption of black carbon (BC)

Figure 1. Scatter plots of modeled and observed near-surface meteorological variables (a: T , b: RH, c: wind speed); modeled AAOD with
the core-shell model and an external mixing assumption, and the comparisons against observations (d); modeled and observed AOD (e).

BC.                                                                    with Eq. (12) using σa (λ) and σs (λ).
                                                                                Z rmax
                                                                       σe (λ) =        Qe π r 2 n(r)dr                            (11)
1emission-Ext = 1BC-Ext-CTL − 1BC-Ext-NOCTL                  (6)                 rmin
1emission-CS = 1BC-CS-CTL − 1BC-CS-NOCTL                     (7)                       σs (λ)
                                                                       SSA(λ) =                                                   (12)
1aging = 1emission-CS − 1emission-Ext                        (8)                  σs (λ) + σa (λ)
1coating = 1BC-CS-CYSN − 1BC-CS-CTL                          (9)       The calculated optical properties vary with the assumption of
          1emission-CS        1emission-Ext                            mixing state of aerosols. For external mixing, each particle
         1BC-CS-NOCTL − 1BC-Ext-NOCTL
1Eab =              1emission-CS
                                                           (10)        is assumed to be a single chemical species. There are sev-
                  1BC-CS-NOCTL                                         eral models proposed for internal mixing, and the commonly
                                                                       used ones include the volume averaging model and core-shell
                                                                       model. In the volume averaging model, all species are as-
                                                                       sumed to be well mixed, while the core-shell model assumes
2.2   Calculation of aerosol optical properties in                     that BC is coated by a well-mixed shell of another species
      WRF-Chem                                                         (Jacobson, 2001). The volume-weighted refractive index m
                                                                       is obtained with the equation below:
WRF-Chem uses Mie theory to calculate layer aerosol opti-
                                                                             P
                                                                                i Vi mi
cal depth (AOD), single scattering albedo (SSA), and asym-             m= P                                                     (13)
                                                                                  i Vi
metry factor (g). First, the size parameter and spectral refrac-
tive index are used to calculate the Mie extinction efficiency         In Eq. (13), Vi denotes the volume of species i and mi repre-
Qe . Then, the extinction coefficient σe (λ) is provided by the        sents the refractive index of species i. For core-shell internal
integral of Qe with consideration of the geometric size of             mixing, similar averaging processes are applied to the core
the particle (π r 2 ) and the particle number size distribution        and shell separately. The scattering efficiency, absorption
n(r) (Eq. 11). σe (λ) is a equation of wavelength λ. Similarly,        efficiency, and asymmetry parameter are then obtained us-
absorption coefficient σa (λ) and scattering coefficient σs (λ)        ing the core-shell Mie theory documented in Ackerman and
can be obtained with Mie absorption efficiency Qa and Mie              Toon (1981). Core-shell Mie calculations request the core ra-
scattering efficiency Qs . The value of SSA can be calculated          dius, shell radius, refractive index of the core, and refractive

Atmos. Chem. Phys., 21, 11405–11421, 2021                                               https://doi.org/10.5194/acp-21-11405-2021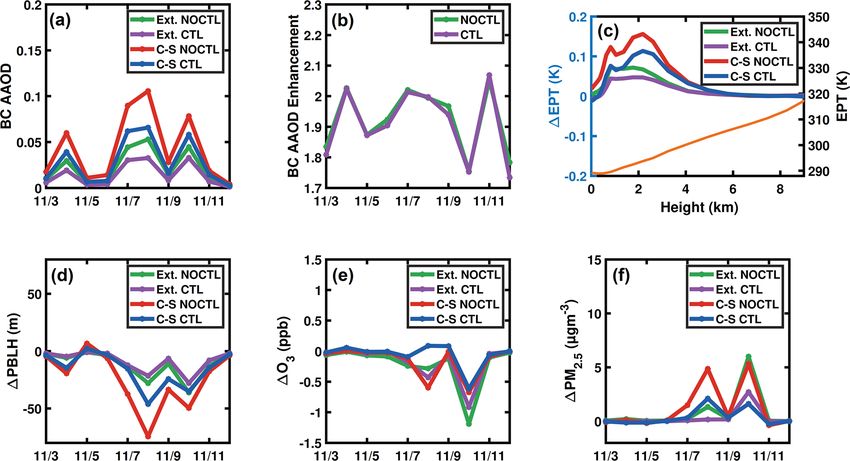
M. Gao et al.: Reduced light absorption of black carbon (BC)                                                                   11409

Table 1. Descriptions of model simulations.

         Experiments       Descriptions
         NOCTLExt          No perturbations in emissions; assuming external mixing of BC.
         NOCTLExt-nobc     No perturbations in emissions; assuming external mixing of BC; assuming no absorption of BC.
         NOCTLCS           No perturbations in emissions; calculating optical properties using core-shell assumption.
         NOCTLCS-nobc      No perturbations in emissions; calculation of optical properties using core-shell assumption;
                           assuming no absorption of BC.
         CTLExt            Emissions are reduced during APEC; assuming external mixing of BC.
         CTLExt-nobc       Emissions are reduced during APEC; assuming external mixing of BC; assuming no absorption of BC.
         CTLCS             Emissions are reduced during APEC; calculation of optical properties using core-shell assumption.
         CTLCS-nobc        Emissions are reduced during APEC; calculation of optical properties using core-shell assumption;
                           assuming no absorption of BC.
         CYSNCS            Emissions of BC are reduced while emissions of other species are not during APEC;
                           calculation of optical properties using core-shell assumption.
         CYSNCS-nobc       Emissions of BC are reduced while emissions of other species are not during APEC;
                           calculation of optical properties using core-shell assumption; assuming no absorption of BC.

index to the shell as inputs (Ackerman and Toon, 1981; Toon            2.3    Observations
and Ackerman, 1981). The official version of WRF-Chem
does not calculate the optical properties of aerosols with an          Both observations of meteorological variables and air pol-
external mixing assumption. To assess the influence of mix-            lutants were used to evaluate the performance of the model
ing with coating particles on the light absorption of BC, the          over the APEC study period in Gao et al. (2017) and in this
estimated light absorption of pure BC is required. We mod-             study. The meteorological measurements were retrieved from
ified the optical calculation module in WRF-Chem so that               the National Centers for Environmental Information web-
it does not mix BC with other chemical species in the cal-             site (https://gis.ncdc.noaa.gov/maps/ncei#app=cdo, last ac-
culation of optical properties. In the calculation of optical          cess: 22 July 2021), which includes near-surface tempera-
properties with an internal mixing assumption, the volume-             ture, relative humidity (RH), wind speed, and wind direc-
weighted refractive index are inputs of the Mie code. In the           tion. The hourly surface concentrations of PM2.5 and daily
calculation of the optical properties of BC with an external           PM2.5 chemical compositions were measured at the Insti-
mixing assumption, we only allowed BC to go through the                tute of Atmospheric Physics (IAP), Chinese Academy of Sci-
Mie code. The mass and particle number of BC, denoted in               ences (CAS) site (Z. Liu et al., 2017; Pan et al., 2012; Yang
Mi and Ni in each bin i (1 through 8) are computed first, and          et al., 2020). We also obtained absorption aerosol optical
the volume (Vi ) is obtained then by dividing by the density           depth (AAOD) from the AERONET network (Dubovik and
of BC. During the calculation of physical diameter (Eq. 14),           King, 2000; Holben et al., 1998) to evaluate model perfor-
other chemical species are not considered. Accordingly, BC             mance. We derived AAOD at 440 nm based on an angstrom
does not mix with other chemical species, and we designated            exponent relation (Schuster et al., 2006) to make it consis-
it as optical properties of BC with an external mixing as-             tent with observations. Data from more than 500 sites across
sumption here. It should be noted that this calculation is dif-        the world are provided online at the AERONET website
ferent from treatments of external mixing in other models              (http://aeronet.gsfc.nasa.gov, last access: 22 July 2021).
where all particles are separated from each other. In our cal-
culation, BC within each bin are internally mixed, although
it does not mix with other chemical species. As the purpose            3     Results
of this study is to explore how coating particles on BC would
affect the absorption of BC, this treatment would not be an            3.1    Model evaluation
issue.
                                                                       Model evaluation was conducted with surface observations
          Vi   ! 13                                                    of meteorological variables, PM2.5 , PM2.5 chemical compo-
Di = 2
          Ni
                                                             (14)      nents, and AAOD. Data at two meteorological sites in urban
          4                                                            Beijing were averaged, and were compared against the model
          3π

https://doi.org/10.5194/acp-21-11405-2021                                              Atmos. Chem. Phys., 21, 11405–11421, 2021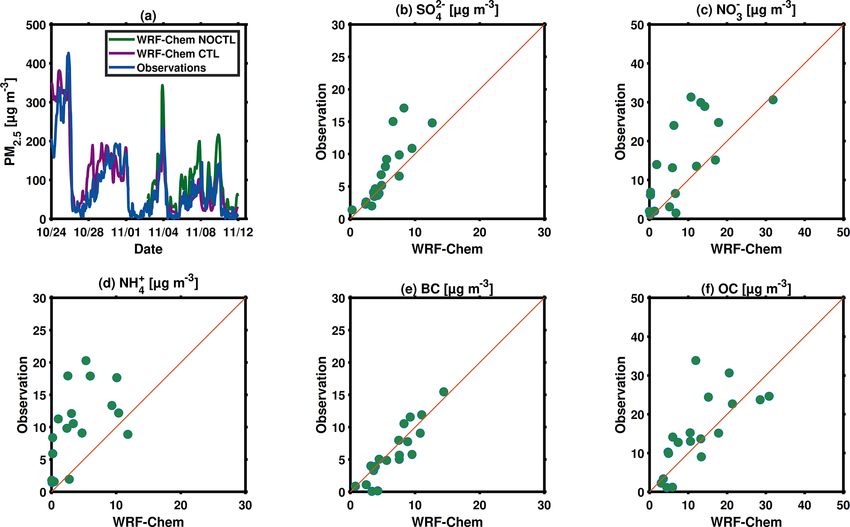
11410                                                            M. Gao et al.: Reduced light absorption of black carbon (BC)

values for the domain grid cell containing the monitoring            tober can be two times of those during 26–27 October, al-
site. Figure 1 indicates that the daily mean temperature and         though no emission reduction measures were implemented.
relative humidity (RH) are captured well by the model. Ob-           Previously, we concluded that the meteorological conditions
served strong wind conditions are slightly underestimated,           during the APEC week were generally favorable for good
which is a common issue due to inaccurate land use inputs            air quality compared to it during the week before the APEC
or other problems in the model (Gao et al., 2018a). Our pre-         week (Gao et al., 2017). Thus, we perturbed emissions in
vious investigation (Gao et al., 2017) suggested that temper-        this study to examine how it would affect concentrations of
ature and RH were lower, and northerly winds became more             air pollutants, including both BC and its coating pollutants.
frequent from before APEC compared with during APEC                  As displayed in Fig. 3a–b, mean concentrations of SO2 and
periods, contributing to pleasant air quality. Figure 2a dis-        NO2 in urban Beijing declined by 38.7 % and 36.3 %, respec-
plays the simulated and observed hourly PM2.5 concentra-             tively, in response to short-term emission control measures.
tions in urban Beijing. Before APEC, observed high PM2.5             Based on observations, Zhang et al. (2018) reported that SO2
concentration is captured well by our model. During APEC,            concentrations decreased by 35 % (67 %), and NO2 concen-
the NOCTL case overestimates PM2.5 concentrations, while             trations decreased by 34 % (45 %) compared with that before
the CTL case exhibits better agreement with observations.            (after) APEC. These declines in aerosol precursors would
Implementing emission reductions in the model lowers the             have modified secondary aerosol formation during the APEC
mean bias of the model from 30.8 to −4.0 µg m−3 . The per-           week. Our model indicates that sulfate and nitrate declined
formance of WRF-Chem in simulating wintertime PM2.5                  by 40.0 % and 28.2 %, respectively. Given the slight underes-
chemical compositions was explored extensively in our pre-           timation of sulfate and nitrate, these values might have been
vious investigations (Gao et al., 2016b, 2018a). Similarly,          moderately underestimated. Mass concentrations of BC de-
measured high concentrations of inorganic aerosols (sulfate,         clined by 34.6 %, while the abundance of OC in the atmo-
nitrate, and ammonium) are underestimated, which could be            sphere exhibited a larger reduction (44.2 %).
partly due to missing sulfate formation pathways (Cheng et              We used the ratio of the sum of pollutants (primary as well
al., 2016). We used the updated version with heterogeneous           as secondary) to black carbon concentrations (rBC) to track
sulfate formation (Gao et al., 2016a) to reduce the underes-         the relative abundance of BC and non-BC particles, which is
timation of sulfate in this study. Simulated BC concentra-           essential in the C-S calculation:
tion shows a high degree of consistency with observations,
while OC is slightly underestimated due to large uncertain-
ties in the current status of SOA modeling (Fig. 2f). In gen-              [sulfate] +
                                                                                      [nitrate]+ [ammonium]
eral, the temporal variations and magnitudes of air pollutants                    + organics + [dust]
are represented effectively in our model. Figure 1d compares                     + [sodium] + [chloride]
                                                                     rBC =                                    .               (15)
simulated AAOD with an external mixing assumption and a                                     [BC]
core-shell model against AERONET inferred AAOD during
the APEC study period. AAOD simulated with an external
mixing assumption exhibits much lower values than with ob-           As shown in Fig. 3c, the impacts of emission reductions dur-
servation. With the core-shell model, this underestimation is        ing APEC on rBC behave differently at different sizes. For
largely reduced. However, AAOD is still underestimated by            ultrafine particles, emission reductions generally lower the
the model, which might be caused by missing sources of ab-           aging degree of BC. This is consistent with the observational
sorbing particles in the model. Currently, the absorption of         evidence that smaller BC cores show larger reductions in ag-
organics is not treated in the WRF-Chem model, which is              ing degree as a result of emission control measures during
likely to underestimate the light-absorbing capability of car-       APEC (Zhang et al., 2018). As most secondary aerosols are
bonaceous aerosols in the atmosphere (Andreae and Gelenc-            in smaller sizes, the effect of emission reduction on BC aging
sér, 2006). Uncertainties in the aerosol size distribution in        is more significant for smaller particles. Zhang et al. (2018)
emissions may also contribute to this mismatch between the           reported only the changes in sizes below 0.2 µm, our mod-
model and observations (Matsui, 2016).                               eling results suggest, however, that the aging degree of BC
                                                                     might be enhanced under emission reductions for relatively
3.2   Reductions in the concentrations of BC and coating             larger particles (Fig. 3c). The impact of emission reductions
      pollutants and changes in BC aging degree                      on rBC behaves differently near the surface and at higher
                                                                     layers (Fig. 3d). The aging degree is lowered in the CTL case
Previously, the reductions of air pollutants were estimated by       near the surface, mainly due to reductions in coating materi-
comparing concentrations of air pollutants during the APEC           als. However, at layers higher than 200 m, the aging degree of
period with those during other periods. Given the differences        BC increases with emission reductions. In-situ near-surface
in meteorological conditions, such a comparison is not able          measurements also indicate that rBC was reduced during
to indicate the influence of emission control measures. As           APEC, and the reduction was most likely caused by lower
displayed in Fig. 2a, the concentrations during 24–25 Oc-            photochemical production (Zhang et al., 2018).

Atmos. Chem. Phys., 21, 11405–11421, 2021                                            https://doi.org/10.5194/acp-21-11405-2021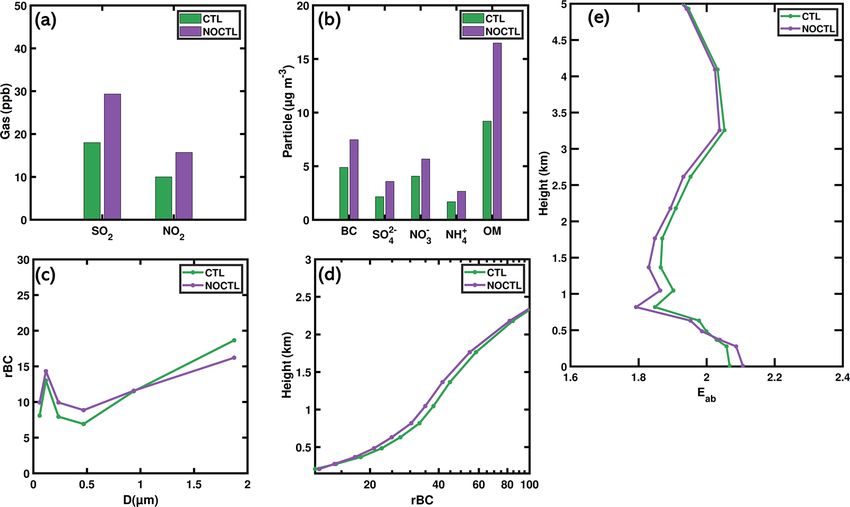
M. Gao et al.: Reduced light absorption of black carbon (BC)                                                                        11411

Figure 2. Modeled and observed time series of PM2.5 concentrations in urban Beijing (a); Scatter plots of modeled and observed near-surface
daily mean concentrations of sulfate, nitrate, ammonium, BC (black carbon), and OC (organics) in Beijing (b–f).

3.3   Changes in AAOD and the light-absorption                          range of enhancement factors have been reported, from neg-
      enhancement (Eab ) of BC during APEC                              ligible (Cappa et al., 2012) to as high as 2.4 (Peng et al.,
                                                                        2016). D. Liu et al. (2017) pointed out that the enhancement
rBC values describe the aging degree of BC, while the explo-            factors depend on the particles’ mass ratio of nonblack car-
ration of how emission reductions affect light absorption of            bon to black carbon. Our model results also indicate that the
BC requires a sophisticated calculation of optical properties           reductions in light absorption enhancement of BC are con-
of BC. Mie theory is commonly used to calculate the light               centrated at lower layers, while enhancement could happen
absorption enhancement of BC (Eab ) from the lensing effect             at higher layers (Fig. 3e). This is consistent with the vertical
with a core-shell model. Zhang et al. (2018) estimated Eab by           profile of rBC where it decreases due to emission reductions
dividing the light-absorption cross section of the whole BC-            near the surface, while increasing at higher layers (Fig. 3d).
containing particle by that of the BC core at a certain wave-              Figure 4a presents the daytime mean (defined as the mean
length. Here we follow the method in Curci et al. (2019), and           BC AAOD over the 10:00–17:00 time period) BC AAOD
calculate Eab as the ratio of BC AAOD estimated assuming                in Beijing inferred from simulations with different mixing
core-shell internal mixing to that calculated with an external          assumptions and emission perturbations. In the NOCTL sce-
mixing assumption (enhancement due to mixing with coating               narios, BC AAOD simulated with a core-shell model exhibits
non-BC particles):                                                      higher values than those with an external mixing assump-
        BC_AAOD (550 nm, core-shell mixing)                             tion (0.0220 for external and 0.0427 for core-shell). Due to
Eab =                                                                   reductions in emissions, these values decline to 0.0145 and
         BC_AAOD (550 nm, external mixing)
                                                                        0.0283, respectively. Due to emission reductions (differences
        (AAOD can be either layer or column) .                (16)      between the CTL and NOCTL scenarios), mean daytime BC
Inferred vertical profiles of layer Eab values in the CTL and           AAOD decreases by 0.0075 during the APEC week, as a re-
NOCTL scenarios are displayed in Fig. 3e. At the layers be-             sult of declines in mass concentration of BC (52.0 %, Ta-
low 5 km, mean Eab values are 1.96 and 1.95 for CTL and                 ble 2). However, the lensing effect of BC induces a further
NOCTL scenarios, respectively. Below 500 m in the tropo-                decline of 0.0069 (48.0 %, Table 2). The influence of the
sphere, emission reductions during APEC lower Eab from                  lensing effect is mostly due to the reductions in coating ma-
2.11 to 2.06. A previous study by Jacobson (2001) suggests              terials (39.4 %, Eq. 9, Table 2). The BC absorption enhance-
a global average BC absorption enhancement factor of 2,                 ment (Eab ) factor decreased by 0.003 due to reductions in
which is consistent with the current study. However, a wide             emissions (Fig. 4b). We further quantified that the reduced

https://doi.org/10.5194/acp-21-11405-2021                                              Atmos. Chem. Phys., 21, 11405–11421, 2021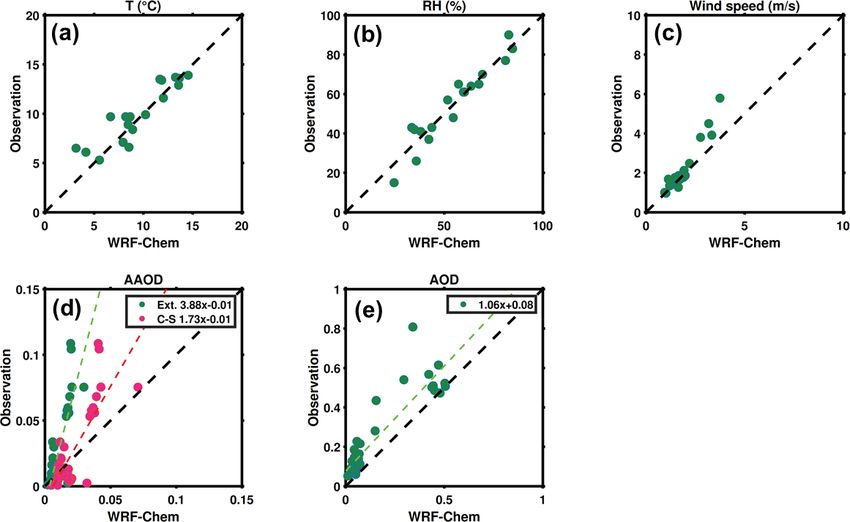
11412                                                                M. Gao et al.: Reduced light absorption of black carbon (BC)

Figure 3. Mass concentrations of gaseous and condensed pollutants in the CTL and NOCTL cases (a–b); the distribution of rBC with sizes
in the CTL and NOCTL cases (c); the distribution of rBC with height in the CTL and NOCTL cases (d) and the distribution of Eab values
with height in the CTL and NOCTL cases (e).

light absorption capability (Eab ) resulting from emission re-              In urban Beijing, BC absorption induced mean changes
ductions during APEC contributed 3.2 % to the total reduc-               of daytime planetary boundary layer height (PBLH) during
tions in AAOD (Eq. 10, Table 2).                                         the APEC week are −11.6 and −24.0 m for an external mix-
                                                                         ing and core-shell model, respectively (Fig. 4d). Under rela-
3.4   Influences on boundary layer process and air                       tively clean conditions (CTL scenarios), these values change
      pollution                                                          to −8.8 and −15.6 m for external mixing and the core-shell
                                                                         model for NOCTL emissions (Fig. 4d). Due to emission re-
The vertical distribution of BC absorption plays an impor-               ductions, the impact of BC absorption on PBL inhibition
tant role in modulating the temperature gradient and chang-              decreases by 8.2 m on average during the APEC week (re-
ing boundary layer meteorology (Ding et al., 2016). We con-              duced emissions enhance PBLH by 8.2 m). The influence of
ducted a series of numerical experiments to understand the               reduced mass concentration of BC itself accounts for 35 %
influences of reshaped BC absorption due to emission reduc-              of the total changes, while the lensing effect of BC explains
tions during APEC on boundary layer process and the forma-               the rest (65 %, Table 2). The decreased coating due to emis-
tion of air pollution. Figure 4c illustrates the vertical profiles       sion reductions greatly contributes to the lensing effect of BC
of BC absorption induced changes in the equivalent poten-                (47.4 %, Table 2).
tial temperature (EPT), which is commonly used to indicate                  The corresponding changes in daytime mean near-surface
the stability of air in the atmosphere (Obremski et al., 1989).          concentrations of O3 and PM2.5 in Beijing are displayed in
When EPT decreases with height, the atmosphere is unsta-                 Fig. 4e and f, respectively. The inhibited development of
ble, and vertical motion and convection is likely to occur.              PBL due to BC absorption results in a higher abundance
In all experiments, BC absorption induces a positive impact              of PM2.5 within the PBL (Ding et al., 2016; Gao et al.,
on EPT in the air above ground acting to enhance the stabil-             2016b). Previously, we quantified that the cobenefits of re-
ity of the atmosphere (Fig. 4c). The maximum enhancement                 duced aerosol feedback could explain ∼ 11 % of the total de-
occurs at layers close to 1–2 km (Fig. 4c). At ∼ 2.6 km, the             creases in PM2.5 in Beijing during APEC. Here we focus on
maximum ratio of changes with the core-shell model to those              the light absorption of BC, and find that the lensing effect
with an external mixing reach above 2.5, indicating the im-              of BC decreases PM2.5 concentration by 0.8 µg m−3 on av-
portant effects of mixing state of BC in the upper boundary              erage (Fig. 4f). On average, declines in BC mass concentra-
layer (Fig. 4c).                                                         tion itself account for 64.3 % of the total impact of reduced
                                                                         light absorption of BC on PM2.5 , while 35.7 % is attributed

Atmos. Chem. Phys., 21, 11405–11421, 2021                                                https://doi.org/10.5194/acp-21-11405-2021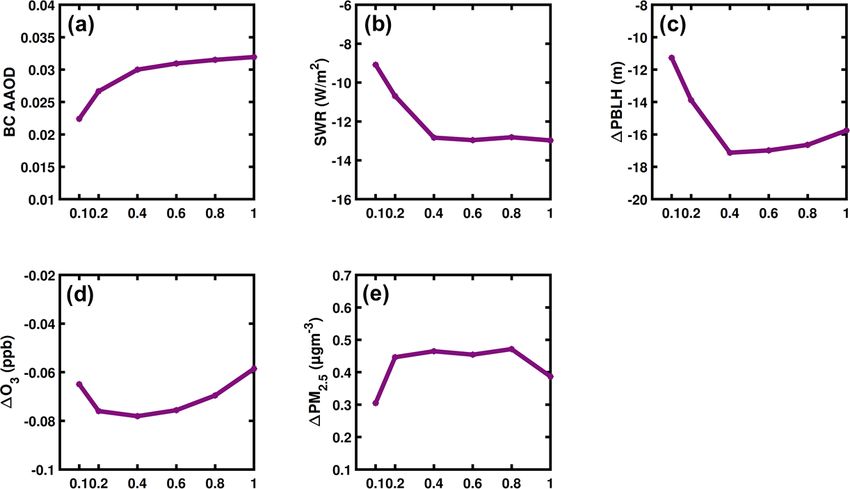
M. Gao et al.: Reduced light absorption of black carbon (BC)                                                                     11413

Figure 4. Daytime (10:00–17:00 local time) mean BC AAOD in Beijing inferred from different simulations (a) and the BC AAOD enhance-
ment in the NOCTL and CTL scenarios (b); BC absorption induced changes in EPT (orange line indicates the vertical profile of EPT) (c),
PBLH (d), O3 (e), and PM2.5 (f).

Table 2. The division of the impact of BC absorption into the impact of BC mass itself and the BC mixing state.

                     Influenced variables    BC mass itself   BC lensing effect    Reduced coating     Reduced Eab
                     AAOD                           52.0 %               48.0 %              39.4 %           3.2 %
                     PBLH                           34.9 %               65.1 %              47.4 %               –
                     PM2.5                          64.3 %               35.7 %                   –               –
                     O3                             49.1 %               50.9 %                   –               –

to the lensing effect of BC. However, inhibited PBL devel-                Figure 6a, b illustrates the cross sections in the north-
opment does not necessarily lead to enhanced levels of near-           east direction of changes in BC absorption coefficient due to
surface O3 , as the formation of O3 is also affected by changes        emission reductions, as Beijing and polluted cities in South
in aerosols and photolysis reactions above the ground (Chen            Hebei are covered. Pronounced declines are concentrated be-
et al., 2021; Lu et al., 2019). As displayed in Fig. 4e, near-         low 2 km, and the core-shell model estimates stronger reduc-
surface O3 concentrations in urban Beijing decrease in re-             tions due to lensing effects (Fig. 6c). Emission control mea-
sponse to BC absorption.                                               sures also reshaped the light absorption enhancement fac-
   The spatial distribution of 1emission-Ext and 1emission-CS in       tor of BC, as indicated in Fig. 6f. Within the lower bound-
Fig. 5 reveals that external mixing and core-shell models es-          ary layer, Eab values were reduced with emission reductions
timate similar patterns of changes in AAOD, PBLH, near-                during APEC. Light absorption of BC stabilizes boundary
surface O3 , and near-surface PM2.5 . However, the responses           layer to accumulate PM2.5 , yet this effect is inhibited at lower
of these variables are larger in the core-shell model due to           emission levels during APEC. These relationships are re-
the lensing effects of coating materials. Reduced emissions            flected in Fig. 6g and h with negative changes in PM2.5 near
of BC and its coating materials during APEC led to declined            the ground.
AAOD, less stabilized PBLH, decreased near-surface PM2.5                  The responses of O3 to reduced light absorption of BC dur-
concentrations, and enhanced near-surface O3 concentrations            ing APEC are in the opposite direction (Gao et al., 2018c),
in the North China Plain (Fig. 5). It was noted that PM2.5 con-        compared to those for PM2.5 . Strong absorption of BC tends
centrations was enhanced in northwest China, particularly              to enhance photolysis above the aerosol layer, but to reduce
when we used the C-S model. This is related to absorption-             photolysis near the ground. Figure 7d, g illustrate the changes
modulated natural emissions of windblown dust.                         in O3 1D and NO2 photolysis rates with emission reductions
                                                                       inferred from an external mixing assumption. With emission

https://doi.org/10.5194/acp-21-11405-2021                                              Atmos. Chem. Phys., 21, 11405–11421, 2021
11414 M. Gao et al.: Reduced light absorption of black carbon (BC) Figure 5. Spatial distribution of daytime (10:00–17:00 local time) mean BC AAOD (first row), and mean BC absorption induced changes after emission reductions (CTL minus NOCTL) in PBLH (second row), PM2.5 (third row), and O3 (fourth row); first, second, and third columns represent 1emission-Ext , 1emission-CS , and 1aging . Atmos. Chem. Phys., 21, 11405–11421, 2021 https://doi.org/10.5194/acp-21-11405-2021
M. Gao et al.: Reduced light absorption of black carbon (BC) 11415
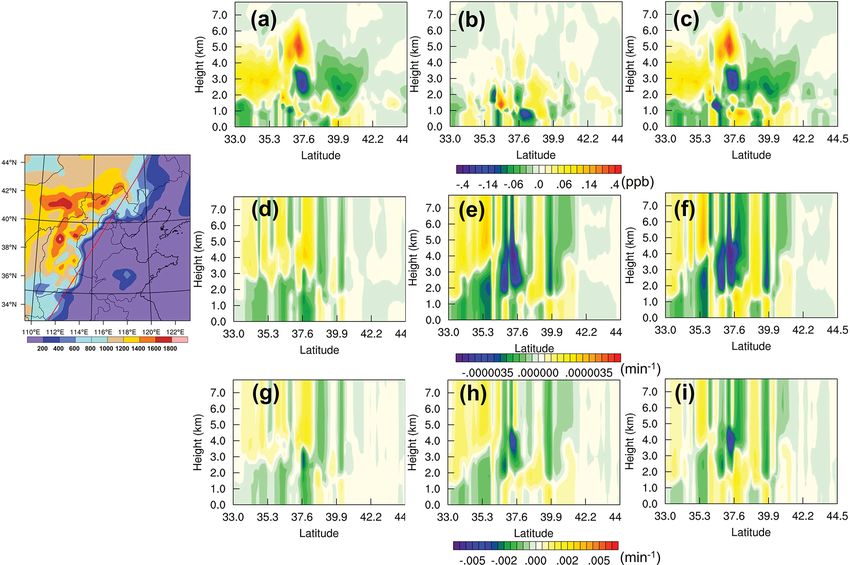
Figure 6. Cross sections of daytime (10:00–17:00 local time) mean changes in BC absorption coefficient (first row, CTL minus NOCTL),
Eab (second row), BC absorption induced changes after emission reductions (CTL minus NOCTL) in PM2.5 (third row); first, second, and
third columns represent 1emission-Ext , 1emission-CS , and 1aging .
control implemented, photolysis rates near the ground are en- mixing state of BC, to the changes in light absorption of BC
hanced due to lower light absorption of BC, while the pho- during APEC; and (3) how did these processes affect BC-
tolysis rates above the aerosol layer are reduced. Similar pat- PBL interactions and the formation of air pollution?
terns but with larger values are found using the core-shell We found that both the mass concentration of BC and the
model (Fig. 7e, h). The responses of O3 are generally in BC coating materials declined during the APEC week, which
line with the responses of O3 1D and NO2 photolysis rates reduced the light absorption and light absorption enhance-
(Fig. 7a, b). ment (Eab ) of BC. Below 500 m in the troposphere, emission
reductions during APEC lowered the absorption enhance-
ment factor Eab from 2.11 to 2.06. The column absorption
4 Summary and discussions enhancement was also reduced. The reduced AAOD during
APEC is caused by both the declines in mass concentration
In this study, we used the online coupled WRF-Chem model
of BC itself (52.0 %) and the lensing effect of BC (48.0 %).
to understand how emission control measures during the
The reductions in coating materials (39.4 %) contributed the
APEC event would affect the mixing state and light absorp-
most to the influence of the lensing effect, and the reduced
tion of BC, and the implications for BC-PBL interactions.
light absorption capability (Eab ) contributed 3.2 % to the to-
Multiple observations, including surface observations of me-
tal reductions in AAOD. Our estimate of the contribution of
teorological variables, PM2.5 , PM2.5 chemical composition,
reduced light absorption capability (Eab ) exhibits lower val-
and AAOD were used to evaluate model performance. A
ues than Zhang et al. (2016), which could be caused by the
series of numerical experiments were conducted to address
uncertainties in the assumption of the mixing state of BC in
three questions: (1) how did emission reductions affect the
the core-shell model.
aging processes and light absorption of BC during APEC;
The diminished light absorption of BC during APEC pro-
(2) what were the relative contributions of the reduced mass
motes the development of PBL, as indicated in the changes
concentrations of BC, aging processes of BC, and reshaped
https://doi.org/10.5194/acp-21-11405-2021 Atmos. Chem. Phys., 21, 11405–11421, 202111416 M. Gao et al.: Reduced light absorption of black carbon (BC)
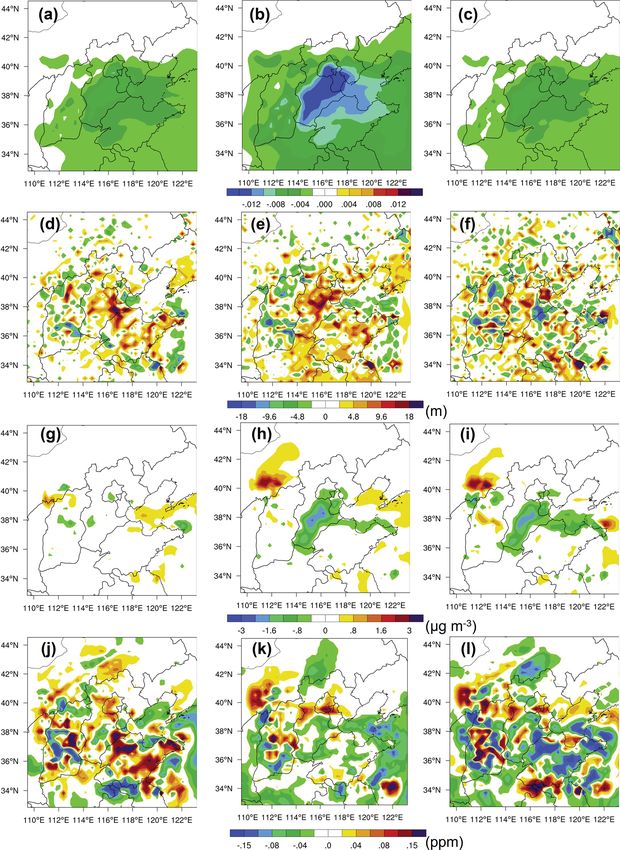
Figure 7. Cross sections of daytime (10:00–17:00 local time) mean changes in BC absorption induced changes after emission reductions
(CTL minus NOCTL) in O3 (first row), O3 1D photolysis rate (second row), and NO2 photolysis rate (third row); first, second and third
columns represent 1emission-Ext , 1emission-CS , and 1aging .
in vertical profiles of EPT. Different responses of PM2.5 and
O3 were found to the changes in the light absorption of BC.
The responses of PM2.5 follow the enhanced PBLH in de-
creasing, while O3 concentrations increase near the ground.
The enhanced levels of O3 were mainly caused by the influ-
ences of BC absorption on photolysis rates. As displayed in
the conceptual scheme plot in Fig. 8, reduced emissions of
BC and its coating materials during APEC led to declined
AAOD, less stabilized PBLH, decreased near-surface PM2.5
concentrations, and enhanced near-surface O3 concentrations
in the North China Plain.
This study with perturbations of emissions during APEC
offers important implications for the potential effects of
China’s Clean Air Act. As discussed in our previous inves-
tigation (Gao et al., 2017), emission control measures have
the cobenefits of reducing aerosol feedback to accelerate the
cleaning of air, which accounts for ∼ 11 % of the decreased
PM2.5 concentrations during APEC. In this study, we further
clarified that the ongoing measures to control SO2 , NOx , etc.
Figure 8. Conceptual scheme of the effects of emission control dur-
would be effective in reducing the absorption capability of
ing APEC on the light absorption capability of BC, PBL, and air
BC to inhibit the feedback of BC on the boundary layer. Our
quality.
results also show that near-ground O3 responds differently
Atmos. Chem. Phys., 21, 11405–11421, 2021 https://doi.org/10.5194/acp-21-11405-2021M. Gao et al.: Reduced light absorption of black carbon (BC) 11417
Figure 9. Daytime (10:00–17:00 local time) mean BC AAOD in Beijing (a) BC absorption induced changes in shortwave radiation (b),
PBLH (c), O3 (d), and PM2.5 (e) as a function of the fraction of non-BC particles mixed with BC.
from the changes in PM2.5 , which might be a side effect of keeps relatively stable when the mixing fraction is between
current emission control strategies. Ma et al. (2021) reported 0.4 and 1. The responses of near-surface shortwave radia-
that aerosol radiative effect could explain 23 % of the total tion and PBLH are in line with it, exhibiting relatively con-
change in surface summertime O3 in China. How to control stant reductions when the mixing fraction is higher than 0.4
emissions to offset this side effect of current emission control (Fig. 9). However, no significant relationships are found for
measures on O3 should be an area of further focus. In addi- BC absorption induced changes in O3 (< 10 % difference be-
tion to the influences on air quality and weather, a sudden tween fractions of 0.1 and 1) and PM2.5 (< 22 % difference
reduction in aerosol emissions may potentially affect climate between fractions of 0.1 and 1) in Beijing. These results sug-
(Ren et al., 2020; Yang et al., 2020), which warrants further gest that the findings demonstrated in this study might not
investigation. be largely affected by the assumptions in mixing fractions
Although careful validation was conducted in this study, of coating particles. Additionally, the simulated feedback of
uncertainties still remain in the current study. We concluded BC absorption on boundary layer processes are not well con-
that the core-shell model captures the variation of AAOD bet- strained. We used multiple coupled models to examine how
ter than an external mixing assumption. However, the core- these processes are represented, and we calculated the en-
shell model is an ideal scenario that assumes all non-BC ma- semble mean to optimize understanding (Gao et al., 2018a,
terials are internally mixed and coated on BC (Miyakawa et 2020a). In the future, further efforts are needed to constrain
al., 2014). Zhang et al. (2016) observed that BC particles are the uncertainties of these processes in the model.
heavily coated and are in a near-spherical shape in the North
China Plain. The usage of the core-shell model seems to be
reasonable in this study, whereas the assumption that all non- Data availability. The measurements and model simulations data
BC materials are coated on BC might not be true in real at- can be accessed by contacting the corresponding authors.
mospheric conditions. The observed ratio of coatings to PM1
was ∼ 25 %–70 % in summer in Beijing (Xu et al., 2019), and
the observed ratio of coatings to PM2.5 was ∼ 10 %–40 % Supplement. The supplement related to this article is available on-
in winter in Beijing (Wang et al., 2019). We conducted ad- line at: https://doi.org/10.5194/acp-21-11405-2021-supplement.
ditional simulations assuming 10 %, 20 %, 40 %, 60 %, and
80 % mixing fractions of coating aerosols, and explored how
Author contributions. MG and JH designed the study. MG per-
these assumptions would affect estimated BC AAOD, and its
formed model simulations and analyzed the data with help from
feedback on radiation, the boundary layer, and air pollutants.
YY, HL, BZ, YZ, XL, CW, QZ and GRC. QZ provided the emis-
As suggested in Fig. 9, modeled BC AAOD increases grad-
ually when the mixing fraction rises from 0.1 to 0.4, but it
https://doi.org/10.5194/acp-21-11405-2021 Atmos. Chem. Phys., 21, 11405–11421, 202111418 M. Gao et al.: Reduced light absorption of black carbon (BC)
sion inventory. YW and ZL provided measurements. MG and JH entific assessment, J. Geophys. Res.-Atmos., 118, 5380–5552,
wrote the paper with inputs from all the other authors. https://doi.org/10.1002/jgrd.50171, 2013.
Cappa, C. D., Onasch, T. B., Massoli, P., Worsnop, D. R., Bates, T.
S., Cross, E. S., Davidovits, P., Hakala, J., Hayden, K. L., Job-
Competing interests. The authors declare that they have no conflict son, B. T., Kolesar, K. R., Lack, D. A., Lerner, B. M., Li, S. M.,
of interest. Mellon, D., Nuaaman, I., Olfert, J. S., Petaja, T., Quinn, P. K.,
Song, C., Subramanian, R., Williams, E. J., and Zaveri, R. A.:
Radiative Absorption Enhancements Due to the Mixing State of
Disclaimer. Publisher’s note: Copernicus Publications remains Atmospheric Black Carbon, Science, 337, 1078–1081, 2012.
neutral with regard to jurisdictional claims in published maps and Chen, D., Liao, H., Yang, Y., Chen, L., and Wang, H.: Simulated ag-
institutional affiliations. ing processes of black carbon and its impact during a severe win-
ter haze event in the Beijing-Tianjin-Hebei region, Sci. Tot. Env.,
755, 142712, https://doi.org/10.1016/j.scitotenv.2020.142712,
2021.
Financial support. This work was supported by the Open fund
Chen, Y., Beig, G., Archer-Nicholls, S., Drysdale, W., Acton, J.,
by Jiangsu Key Laboratory of Atmospheric Environment Moni-
Lowe, D., Nelson, B. S., Lee, J. D., Ran, L., Wang, Y., Wu, Z.,
toring and Pollution Control (grant no. KHK1902), the National
Sahu, S. K., Sokhi, R. S., Singh, V., Gadi, R., Hewitt, C. N., Ne-
Key Research and Development Program of China (grant no.
mitz, E., Archibald, A., McFiggins, G., and Wild, O.: Avoiding
2016YFA0602003), the National Natural Science Foundation of
high ozone pollution in Delhi, India, Faraday Discuss., 226, 502–
China (no. 42005084 and no. 92044302), the Ministry of Sci-
514, https://doi.org/10.1039/D0FD00079E, 2021.
ence and Technology of the People’s Republic of China (Grant
Cheng, Y., Zheng, G., Wei, C., Mu, Q., Zheng, B., Wang, Z., Gao,
no. 2017YFC0210000), the Natural Science Foundation of Guang-
M., Zhang, Q., He, K., Carmichael, G., Pöschl, U., and Su,
dong Province (no. 2019A1515011633), and special fund of the
H.: Reactive nitrogen chemistry in aerosol water as a source
State Key Joint Laboratory of Environment Simulation and Pollu-
of sulfate during haze events in China, Sci. Adv., 2, e1601530,
tion Control (grant no. 19K03ESPCT).
https://doi.org/10.1126/sciadv.1601530, 2016.
Ching, J., Riemer, N., and West, M.: Impacts of black carbon par-
ticles mixing state on cloud microphysical properties: sensitiv-
Review statement. This paper was edited by James Allan and re- ity to environmental conditions, J. Geophys. Res.-Atmos., 121,
viewed by two anonymous referees. 5990–6013, https://doi.org/10.1002/2016JD024851, 2016.
Curci, G., Alyuz, U., Barò, R., Bianconi, R., Bieser, J., Christensen,
J. H., Colette, A., Farrow, A., Francis, X., Jiménez-guerrero, P.,
Im, U., and Liu, P.: Modelling black carbon absorption of solar
radiation: combining external and internal mixing assumptions,
References Atmos. Chem. Phys., 19, 181–204, https://doi.org/10.5194/acp-
19-181-2019, 2019.
Ackerman, T. P. and Toon, O. B.: Absorption of visible radiation in Curtis, J. H., Riemer, N., and West, M.: A single-column particle-
atmosphere containing mixtures of absorbing and non-absorbing resolved model for simulating the vertical distribution of aerosol
particles, Appl. Optics, 20, 3661–3662, 1981. mixing state: WRF-PartMC-MOSAIC-SCM v1.0, Geosci.
Andreae, M. O. and Gelencsér, A.: Black carbon or brown car- Model Dev., 10, 4057–4079, https://doi.org/10.5194/gmd-10-
bon? The nature of light-absorbing carbonaceous aerosols, At- 4057-2017, 2017.
mos. Chem. Phys., 6, 3131–3148, https://doi.org/10.5194/acp-6- Ding, A. J., Huang, X., Nie, W., Sun, J. N., Kerminen, V., Petäjä,
3131-2006, 2006. T., Su, H., Cheng, Y. F., Yang, X., Wang, M. H., Chi, X. G.,
Barnard, J. C., Fast, J. D., Paredes-Miranda, G., Arnott, W. P., Wang, J. P., Virkkula, A., Guo, W. D., Yuan, J., Wang, S. Y.,
and Laskin, A.: Technical Note: Evaluation of the WRF-Chem Zhang, R. J., Wu, Y. F., Song, Y., Zhu, T., Zilitinkevich, S., Kul-
”Aerosol Chemical to Aerosol Optical Properties” Module using mala, M., and Fu, C. B.: Enhanced haze pollution by black car-
data from the MILAGRO campaign, Atmos. Chem. Phys., 10, bon in megacities in China, Geophys. Res. Lett., 43, 2873–2879,
7325–7340, https://doi.org/10.5194/acp-10-7325-2010, 2010. https://doi.org/10.1002/2016GL067745, 2016.
Bond, T. C., Streets, D. G., Yarber, K. F., Nelson, S. M., Woo, J., and Dubovik, O. and King, M. D.: A flexible inversion algorithm
Klimont, Z.: A technology-based global inventory of black and for retrieval of aerosol optical properties from Sun and sky
organic carbon emissions from combustion, J. Geophys. Res.- radiance measurements A flexible inversion algorithm for re-
Atmos., 109, D14203, https://doi.org/10.1029/2003JD003697, trieval of aerosol optical properties from Sun and sky radiance
2004. measurements, J. Geophys. Res.-Atmos., 105 20673–20696,
Bond, T. C., Habib, G., and Bergstrom, R. W.: Limi- https://doi.org/10.1029/2000JD900282, 2000.
tations in the enhancement of visible light absorption Emmons, L. K., Walters1, S., Hess1, P. G., Lamarque, J.-F., Pfis-
due to mixing state, J. Geophys. Res., 111, D20211, ter1, G. G., Fillmore1, D., Granier, C., Guenther, A., Kinni-
https://doi.org/10.1029/2006JD007315, 2006. son, D., Laepple1, T., Orlando, J., Tie, X., Tyndall, G., Wied-
Bond, T. C., Doherty, S. J., Fahey, D. W., Forster, P. M., Berntsen, inmyer, C., Baughcum, S. L., and Kloster, S.: Description and
T., Deangelo, B. J., Flanner, M. G., Ghan, S., Kärcher, B., evaluation of the Model for Ozone and Related chemical Trac-
Koch, D., Kinne, S., Kondo, Y., and Quinn, P. K.: Bound-
ing the role of black carbon in the climate system: A sci-
Atmos. Chem. Phys., 21, 11405–11421, 2021 https://doi.org/10.5194/acp-21-11405-2021M. Gao et al.: Reduced light absorption of black carbon (BC) 11419 ers, version 4 (MOZART-4), Geosci. Model Dev., 3, 43–67, generation global fire emissions database (GFED4), J. Geophys. https://doi.org/10.5194/gmd-3-43-2010, 2010. Res.-Biogeo., 118, 317–328, https://doi.org/10.1002/jgrg.20042, Flanner, M. G., Zender, C. S., Randerson, J. T., and Rasch, P. 2013. J.: Present-day climate forcing and response from black car- Grell, G. A., Peckham, S. E., Schmitz, R., Mckeen, S. A., Frost, G., bon in snow Present-day climate forcing and response from Skamarock, W. C., and Eder, B.: Fully coupled “online” chem- black carbon in snow, J. Geophys. Res.-Atmos., 112, D11202, istry within the WRF model, Atmos. Environ., 39, 6957–6975, https://doi.org/10.1029/2006JD008003, 2007. https://doi.org/10.1016/j.atmosenv.2005.04.027, 2005. Fuller, K. A., Malm, W. C., and Kreidenweis, S. M.: Effects of mix- Grieshop, A. P., Reynolds, C. C. O., Kandlikar, M., and ing on extinction by carbonaceous particles Effects of mixing on Dowlatabadi, H.: A black-carbon mitigation wedge, Nat. Publ. extinction by carbonaceous particles, J. Geophys. Res.-Atmos., Gr., 2, 533–534, https://doi.org/10.1038/ngeo595, 2009. 104, 15941–15954, https://doi.org/10.1029/1998JD100069, Guenther, A., Karl, T., Harley, P., Wiedinmyer, C., Palmer, P. 1999. I., and Geron, C.: Estimates of global terrestrial isoprene Gao, M., Carmichael, G. R., Wang, Y., Ji, D., Liu, Z., and emissions using MEGAN (Model of Emissions of Gases and Wang, Z.: Improving simulations of sulfate aerosols during win- Aerosols from Nature), Atmos. Chem. Phys., 6, 3181–3210, ter haze over Northern China: the impacts of heterogeneous https://doi.org/10.5194/acp-6-3181-2006, 2006. oxidation by NO2 , Front. Environ. Sci. Technol., 10, 1–11, Holben, B. N., Slutsker, T. I. E. I., Tar, D., Buis, J. P., Setxerj, I. https://doi.org/10.1007/s11783-016-0878-2, 2016a. I. A., Reagan, A., J, Y., Nakajima, T., Lavenu, F., Vemte, E., Gao, M., Carmichael, G. R., Wang, Y., Saide, P. E., Yu, M., Xin, Jankowiak, I., and Smirnozjt, A.: AERONET-A Federated Instru- J., Liu, Z., and Wang, Z.: Modeling study of the 2010 regional ment Network and Data Archive for Aerosol Characterization, haze event in the North China Plain, Atmos. Chem. Phys., 16, Remote Sens. Environ., 66, 1–16, 1998. 1673–1691, https://doi.org/10.5194/acp-16-1673-2016, 2016b. Hong, S.-Y.: A new stable boundary-layer mixing scheme and its Gao, M., Liu, Z., Wang, Y., Lu, X., Ji, D., and Wang, L.: Dis- impact on the simulated East Asia summer monsoon, Q. J. Roy. tinguishing the roles of meteorology, emission control mea- Meteorol. Soc., 136, 1481–1496, 2010. sures, regional transport, and co-benefits of reduced aerosol IPCC: Climate Change 2014: Synthesis Report, Contribution of feedback in “APEC” Blue, Atmos. Environ., 167, 476–486, Working Groups I, II and III to the Fifth Assessment Report of https://doi.org/10.1016/j.atmosenv.2017.08.054, 2017. the Intergovernmental Panel on Climate Change, edited by: Core Gao, M., Han, Z., Liu, Z., Li, M., Xin, J., Tao, Z., and Li, J.: Writing Team, Pachauri, R. K., and Meyer, L. A.,151 pp., IPCC, Air Quality and Climate Change, Topic 3 of the Model Inter- Geneva, Switzerland, 2014. Comparison Study for Asia Phase III (MICS-Asia III), Part I: Jacobson, M. Z.: Strong radiative heating due to the mixing state overview and model evaluation, Atmos. Chem. Phys., 18, 4859– of black carbon in atmospheric aerosols, Nature, 409, 695–697, 4884, https://doi.org/10.5194/acp-18-4859-2018, 2018a. https://doi.org/10.1038/35055518, 2001. Gao, M., Ji, D., Liang, F., and Liu, Y.: Attribution Ji, D., He, J., Sun, Y., and Gao, M.: Two-year contin- of aerosol direct radiative forcing in China and In- uous measurements of carbonaceous aerosols in ur- dia to emitting sectors, Atmos. Environ., 190, 35–42, ban Beijing, China: Temporal variations, characteris- https://doi.org/10.1016/j.atmosenv.2018.07.011, 2018b. tics and source analyses, Chemosphere, 200, 191–200, Gao, J., Zhu, B., Xiao, H., Kang, H., Pan, C., Wang, D., and Wang, https://doi.org/10.1016/j.chemosphere.2018.02.067, 2018. H.: Effects of black carbon and boundary layer interaction on Ji, D., Gao, W., Maenhaut, W., He, J., Wang, Z., Li, J., Du, surface ozone in Nanjing, China, Atmos. Chem. Phys., 18, 7081– W., Wang, L., Sun, Y., Xin, J., Hu, B., and Wang, Y.: Im- 7094, https://doi.org/10.5194/acp-18-7081-2018, 2018c. pact of air pollution control measures and regional transport on Gao, M., Han, Z., Tao, Z., Li, J., Kang, J.-E., Huang, K., Dong, carbonaceous aerosols in fine particulate matter in urban Bei- X., Zhuang, B., Li, S., Ge, B., Wu, Q., Lee, H.-J., Kim, C.-H., jing, China: insights gained from long-term measurement, At- Fu, J. S., Wang, T., Chin, M., Li, M., Woo, J.-H., Zhang, Q., mos. Chem. Phys., 19, 8569–8590, https://doi.org/10.5194/acp- Cheng, Y., Wang, Z., and Carmichael, G. R.: Air quality and 19-8569-2019, 2019a. climate change, Topic 3 of the Model Inter-Comparison Study Ji, D., Gao, M., Maenhaut, W., He, J., Wu, C., Cheng, L., Gao, for Asia Phase III (MICS-Asia III) – Part 2: aerosol radiative ef- W., Sun, Y., Sun, J., Xin, J., Wang, L., and Wang, Y.: The car- fects and aerosol feedback, Atmos. Chem. Phys., 20, 1147–1161, bonaceous aerosol levels still remain a challenge in the Beijing- https://doi.org/10.5194/acp-20-1147-2020, 2020a. Tianjin-Hebei region of China: Insights from continuous high Gao, M., Liu, Z., Zheng, B., Ji, D., Sherman, P., Song, S., Xin, J., temporal resolution measurements in multiple cities, Environ. Liu, C., Wang, Y., Zhang, Q., Xing, J., Jiang, J., Wang, Z., and Int., 126, 171–183, https://doi.org/10.1016/j.envint.2019.02.034, Carmichael, G. R.: China’s emission control strategies have sup- 2019b. pressed unfavorable influences of climate on wintertime PM2.5 Li, K., Liao, H., Mao, Y., and Ridley, D. A.: Source sector and concentrations in Beijing since 2002, Atmos. Chem. Phys., 20, region contributions to concentration and direct radiative forc- 1497–1505, https://doi.org/10.5194/acp-20-1497-2020, 2020b. ing of black carbon in China, Atmos. Environ., 124, 351–366, Gao, M., Gao, J., Zhu, B., Kumar, R., Lu, X., Song, S., Zhang, https://doi.org/10.1016/j.atmosenv.2015.06.014, 2016. Y., and Jia, B.: Ozone pollution over China and India: sea- Li, M., Zhang, Q., Kurokawa, J., Woo, J., He, K., Lu, Z., and sonality and sources, Atmos. Chem. Phys., 20, 4399–4414, Ohara, T.: MIX: a mosaic Asian anthropogenic emission in- https://doi.org/10.5194/acp-20-4399-2020, 2020c. ventory under the international collaboration framework of the Giglio, L., Randerson, J. T., and Van Der Werf, G. R.: Analy- MICS-Asia and HTAP, Atmos. Chem. Phys., 17, 935–963, sis of daily, monthly, and annual burned area using the fourth- https://doi.org/10.5194/acp-17-935-2017, 2017. https://doi.org/10.5194/acp-21-11405-2021 Atmos. Chem. Phys., 21, 11405–11421, 2021
You can also read