Pollen observations at four EARLINET stations during the ACTRIS-COVID-19 campaign
←
→
Page content transcription
If your browser does not render page correctly, please read the page content below

Research article
Atmos. Chem. Phys., 22, 3931–3944, 2022
https://doi.org/10.5194/acp-22-3931-2022
© Author(s) 2022. This work is distributed under
the Creative Commons Attribution 4.0 License.

          Pollen observations at four EARLINET stations during
                    the ACTRIS-COVID-19 campaign
               Xiaoxia Shang1 , Holger Baars2 , Iwona S. Stachlewska3 , Ina Mattis4 , and Mika Komppula1
            1 FinnishMeteorological Institute, Atmospheric Research Centre of Eastern Finland, Kuopio, Finland
                        2 Leibniz Institute for Tropospheric Research (TROPOS), Leipzig, Germany
                                 3 Faculty of Physics, University of Warsaw, Warsaw, Poland
         4 Deutscher Wetterdienst, Meteorologisches Observatorium Hohenpeißenberg, Hohenpeißenberg, Germany

                                  Correspondence: Xiaoxia Shang (xiaoxia.shang@fmi.fi)

                                Received: 26 November 2021 – Discussion started: 2 December 2021
                            Revised: 2 March 2022 – Accepted: 9 March 2022 – Published: 28 March 2022

       Abstract. Lidar observations were analysed to characterize atmospheric pollen at four EARLINET (European
       Aerosol Research Lidar Network) stations (Hohenpeißenberg, Germany; Kuopio, Finland; Leipzig, Germany;
       and Warsaw, Poland) during the ACTRIS (Aerosol, Clouds and Trace Gases Research Infrastructure) COVID-
       19 campaign in May 2020. The reanalysis (fully quality-assured) lidar data products, after the centralized and
       automatic data processing with the Single Calculus Chain (SCC), were used in this study, focusing on particle
       backscatter coefficients at 355 and 532 nm and particle linear depolarization ratios (PDRs) at 532 nm. A novel
       method for the characterization of the pure pollen depolarization ratio was presented, based on the non-linear
       least square regression fitting using lidar-derived backscatter-related Ångström exponents (BAEs) and PDRs.
       Under the assumption that the BAE between 355 and 532 nm should be zero (±0.5) for pure pollen, the pollen
       depolarization ratios were estimated: for Kuopio and Warsaw stations, the pollen depolarization ratios at 532 nm
       were of 0.24 (0.19–0.28) during the birch-dominant pollen periods, whereas for Hohenpeißenberg and Leipzig
       stations, the pollen depolarization ratios of 0.21 (0.15–0.27) and 0.20 (0.15–0.25) were observed for periods of
       mixture of birch and grass pollen. The method was also applied for the aerosol classification, using two case
       examples from the campaign periods; the different pollen types (or pollen mixtures) were identified at Warsaw
       station, and dust and pollen were classified at Hohenpeißenberg station.

1   Introduction                                                   fiths et al., 2012; Pope, 2010; Steiner et al., 2015) and ice-
                                                                   nucleating particles (von Blohn et al., 2005; Diehl et al.,
                                                                   2001, 2002), thereby influencing climate. In favourable con-
Pollen is recognized as one of the major agents of                 ditions, pollen can be lifted into upper layers of the atmo-
allergy-related diseases, such as asthma, rhinitis, and atopic     sphere and travel thousands of kilometres from source ar-
eczema (Bousquet et al., 2008). Gilles et al. (2020) state that    eas (Rousseau et al., 2008; Skjøth et al., 2007; Szczepanek et
pollen exposure weakens the immunity against some respi-           al., 2017).
rator viruses, e.g. corona virus, by diminishing the antivi-          In 2021, there were more than 1000 active pollen-
ral interferon response. As one important type of biogenic         monitoring stations in the world (https://oteros.shinyapps.
particles, pollen has various climatic and environmental im-       io/pollen_map, last access: 1 October 2021; Buters et al.,
pacts (IPCC, 2013). They can affect the solar radiation reach-     2018). The majority of stations operate devices based on
ing Earth, thus causing a cooling effect, whereas their inter-     the Hirst principle (Hirst, 1952), e.g. Burkard pollen sam-
actions with long-wave radiation warm the atmosphere. In           ple, using manual microscopy. Automatic pollen measuring
addition, they can influence the cloud optical properties and      devices are also available, having the potential for work-
cloud lifetime by acting as cloud condensation nuclei (Grif-

Published by Copernicus Publications on behalf of the European Geosciences Union.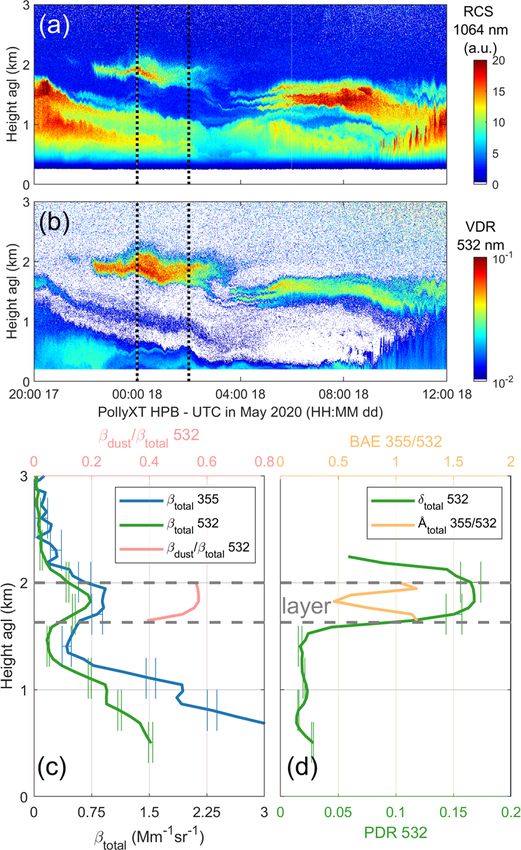
3932                                                           X. Shang et al.: Pollen observations at four EARLINET stations

load reduction and online pollen monitoring. These tech-            evaluate the pollen depolarization ratio at these stations. For
niques are based on, for example, image recognition, such as        two case examples in the campaign period, it was also used
pollen monitor BAA500 (Oteros et al., 2015); fluorescence           for the aerosol classifications.
spectra, such as the Wideband Integrated Bioaerosol Sen-               The paper is structured as follows. In Sect. 2, we introduce
sor (WIBS) (Gabey et al., 2010; Savage et al., 2017) and Plair      the campaign, stations, instrumentation, and proposed algo-
Rapid-E (Šauliene et al., 2019); digital holography, such as        rithm. In Sect. 3, the results of the pollen characterization and
Swisens Poleno (Sauvageat et al., 2020); or light scattering,       the aerosol classification are presented and discussed. The
such as pollen monitor KH-3000-01 (Miki and Kawashima,              conclusions are given in Sect. 4.
2021). Nonetheless, those pollen detections are usually on
the ground and/or at roof level.
                                                                    2     Measurements, instrumentation, and
   An increasing interest has arisen to investigate the verti-
                                                                          methodology
cal distribution of pollen in the atmosphere. Studies show
that lidar measurements can detect the presence of pollen           2.1    Stations and campaign
in the atmosphere, with a strong diurnal cycle on the pollen
backscattering, and that the non-spherical pollen grains can        The ACTRIS-COVID-19 NRT (near-real-time) lidar mea-
generate strong depolarization of laser light (Bohlmann et          surement campaign was performed between 1 to 31 May
al., 2019, 2021; Noh et al., 2013a, b; Sassen, 2008; Sicard         2020, involving 21 stations of the European Aerosol Re-
et al., 2016). Therefore, it is possible to observe pollen in       search Lidar Network (EARLINET, https://www.earlinet.
the atmosphere using the depolarization ratio in the absence        org, last access: 1 October 2021). A map with the
of other depolarizing non-spherical particles (e.g. dust). We       participating EARLINET stations can be found on the
have estimated the depolarization ratio at 532 nm of atmo-          EARLINET website (https://www.earlinet.org/index.php?
spheric birch and pine pollen as 0.24 ± 0.01 and 0.36 ± 0.01        id=covid-19, last access: 1 October 2021). This intensive ob-
under certain assumptions using a recently developed algo-          servation campaign was focused on the lidar observations of
rithm based on multi-wavelength Raman polarization lidar            aerosols during the relaxation period after the lockdown pe-
measurements (Shang et al., 2020). Using laser-induced flu-         riods.
orescence (LIF) lidars, Saito et al. (2018) and Richardson et          Based on the availability of the vertical profiles of
al. (2019) were able to detect the fluorescence spectrum of         backscatter coefficients at 355 and 532 nm and particle linear
pollen in the atmosphere. Veselovskii et al. (2021) demon-          depolarization ratios at 532 nm for dust-free pollen periods
strated that the presence of pollen in aerosol mixtures leads to    during the campaign, four lidar stations (Hohenpeißenberg,
an enhancement of the fluorescence backscattering which is          Germany; Kuopio, Finland; Leipzig, Germany; and Warsaw,
beneficial to distinguish pollen from dust particles. Aerosol       Poland; Table 1) were selected for the pollen investigation.
classification schemes are available for both spaceborne li-        These stations belong to the Raman and polarization lidar
dar observations (Groß et al., 2015; Kim et al., 2018) and          network PollyNET (Baars et al., 2016; http://polly.tropos.de,
ground-based lidar networks (Baars et al., 2017; Nicolae et         last access: 1 October 2021).
al., 2018). However, pollen (or biogenic aerosols in general)          Hohenpeißenberg station (HPB) is situated on top of
is not included and is likely misclassified as dusty mixtures.      an isolated mountain in the foothills of the Alps at Ho-
   An intensive observation campaign, the ACTRIS-COVID-             henpeißenberg in Germany. The observatory is a major
19 campaign, was organized in May 2020, within the AC-              Global Atmospheric Watch global station. This rural site
TRIS (Aerosol, Clouds and Trace Gases Research Infras-              is surrounded by spruce forests (Picea abies) mixed with
tructure, https://www.actris.eu, last access: 1 October 2021)       some common beeches (Fagus sylvatica), maple (Acer pla-
initiative for studying the changes in the atmosphere during        tanoides), and ash (Fraxinus) trees. About a third of the
the COVID-19 lockdown and early relaxation period in Eu-            area is pasture land. Kuopio station (KUO) is located ∼
rope. Pollen presence was also identified by the continuous         18 km from the city centre of Kuopio, in Eastern Finland.
lidar measurements at several stations, as spring is the typical    This is a rural site mainly surrounded by forest. Domi-
pollen season. This study was conducted at four European li-        nant tree species include silver birch (Betula pendula), Nor-
dar stations (Hohenpeißenberg, Germany; Kuopio, Finland;            way spruce (Picea abies), and Scots pine (Pinus sylvestris).
Leipzig, Germany; and Warsaw, Poland) for the pollen prop-          Leipzig station (LEI) is located in the lowlands of eastern
erty retrieval. They were selected based on the availability        Germany. The surrounding is dominated by agricultural ar-
of lidar products and the possible pollen presence from mea-        eas and some forest together with wetlands. Typical trees
surements or models for dust-free periods during the cam-           are birch, lime, beech, oak, maple, and pine among others.
paign. A novel simple method for the characterization of the        Main agricultural plants are all kinds of corn, maize, rape,
pure pollen is proposed, based on the non-linear least square       and grass. The city of Leipzig itself has a lot of parks and a
regression fitting, using lidar-measured vertical profiles of       high biodiversity. Many kinds of trees and other plants can
particle backscatter coefficients at 355 and 532 nm and par-        be found. The pollution level is medium to low, as Leipzig
ticle linear depolarization ratios at 532 nm. It was applied to     is usually well circulated by the dominant wind systems as

Atmos. Chem. Phys., 22, 3931–3944, 2022                                               https://doi.org/10.5194/acp-22-3931-2022
X. Shang et al.: Pollen observations at four EARLINET stations                                                                      3933

Table 1. Information of EARLINET lidar stations involved in this study.

   Station             ACTRIS code      Institute                                             Coordinates (lat, long, elevation a.s.l.)
   Hohenpeißenberg     HPB              Deutscher Wetterdienst (DWD), Meteorological          47.80◦ N, 11.01◦ E; 974 m
                                        Observatory Hohenpeißenberg, Germany
   Kuopio              KUO              Finnish Meteorological Institute (FMI), Atmospheric   62.74◦ N, 27.54◦ E; 190 m
                                        Research Centre of Eastern Finland Kuopio, Finland
   Leipzig             LEI              Leibniz Institute for Tropospheric Research,          51.35◦ N, 12.43◦ E; 125 m
                                        Leipzig, Germany
   Warsaw              WAW              Faculty of Physics, University of Warsaw, Poland      52.21◦ N, 20.98◦ E; 112 m

no hills or mountains are around. Besides the times of in-            accessible at the PollyNET website (http://polly.tropos.de,
tensive agricultural activity (early spring or late autumn) or        last access: 1 October 2021).
periods of Saharan dust arrival, no depolarizing aerosol is              Lidar data were processed in a centralized way using the
observed in Leipzig, leading to a background particle depo-           Single Calculus Chain (SCC) tool, with specific configura-
larization ratio of ∼ 0.01. Warsaw station (WAW) is located           tions and settings, and they were made publicly available.
in the city centre of the capital of Poland; however, in the          The SCC is a tool for the automatic analysis of aerosol li-
nearby vicinity there are several green parks. In May, typ-           dar measurements developed within EARLINET (D’Amico
ically observed pollen species are pine (Pinus), birch (Be-           et al., 2015, 2016; Mattis et al., 2016). The aerosol op-
tula), and blue grass (Poa). The fungi spores represent very          tical products after the reanalysis were used (two types
high contribution in vegetation season.                               of data were issued for the campaign: near-real-time data
   Birch pollen is recognized as one of the most important            and reanalysis data; https://www.earlinet.org/index.php?id=
allergenic sources (D’Amato et al., 2007), which has a di-            covid-19-guidelines, last access: 9 March 2022), which are
ameter around 20–30 µm and near-spherical shape with three            available on the THREDDS server (https://login.earlinet.org:
pores on the edge. Beech, maple, and ash pollen is quite              8443/thredds/catalog/covid19re/catalog.html, last access: 1
similar to birch pollen in terms of shape and size. Pine and          October 2021). Out of all available data products, this study
spruce pollen grains, belonging to the Pinaceae family, are           focused on particle backscatter coefficients (BSCs) at 355
significantly larger, with the diameter on the longest axis of        and 532 nm and particle linear depolarization ratios (PDRs)
∼ 65–80 µm or ∼ 90–110 µm, respectively (Nilsson et al.,              at 532 nm. The processing vertical resolution is ∼ 60 m, and
1977). They possess two air bladders which assist those               the integration time is of 2 h or less (depending on the cloud-
pollen grains to be dispersed by wind despite their large             free time available).
size. The Poaceae family, known as grasses, comprises over
12 000 species classified into 771 grass genera (Soreng et
al., 2015). Grass pollen grains are spheroidal to sub-oblate          2.3   Ancillary data
in shape with a single circular pore, whereas the size range          In order to make sure that there is no dust contamination in
is highly variable (García-Mozo, 2017; Joly et al., 2007;             the pollen properties retrieval, only dust-free periods were
Salgado-Labouriau and Rinaldi, 2009). Microphotographs                considered in this study, which were identified using pre-
of pollen grains can be found at PalDat – a palynologi-               diction by NMMB/BSC-Dust (Non-hydrostatic Multiscale
cal database (https://www.paldat.org, last access: 1 October          Model/Barcelona Supercomputing Center; Pérez et al., 2011;
2021; Halbritter and Heigl, 2020).                                    https://ess.bsc.es/bsc-dust-daily-forecast, last access: 1 Oc-
                                                                      tober 2021). NMMB/BSC-Dust is an online multi-scale at-
                                                                      mospheric dust model designed to accurately describe the
2.2   Lidars and data processing                                      dust cycle in the atmosphere, and is intended to provide
                                                                      short- to medium-range dust forecasts for both regional and
These four PollyNET stations are all equipped with                    global domains. It provides vertical profiles of dust concen-
ground-based multi-wavelength Raman polarization lidars               tration every 6 h, with a horizontal resolution of 0.3◦ × 0.3◦ .
PollyXT (Baars et al., 2016; Engelmann et al., 2016). Full            HYSPLIT (HYbrid Single-Particle Lagrangian Integrated
details on the setup and principle of PollyXT can be found in         Trajectory, https://ready.arl.noaa.gov/HYSPLIT.php, last ac-
Engelmann et al. (2016). Measurement capabilities of the li-          cess: 1 October 2021) backward trajectories were analysed
dars are somewhat different, but they all have emission wave-         to study the air mass origins.
lengths at both 355 and 532 nm and depolarization channels               Pollen types and concentrations were determined by
at 532 nm. The lidar near-real-time quick-looks are publicly          the model forecasting and/or in situ measurements at the

https://doi.org/10.5194/acp-22-3931-2022                                               Atmos. Chem. Phys., 22, 3931–3944, 2022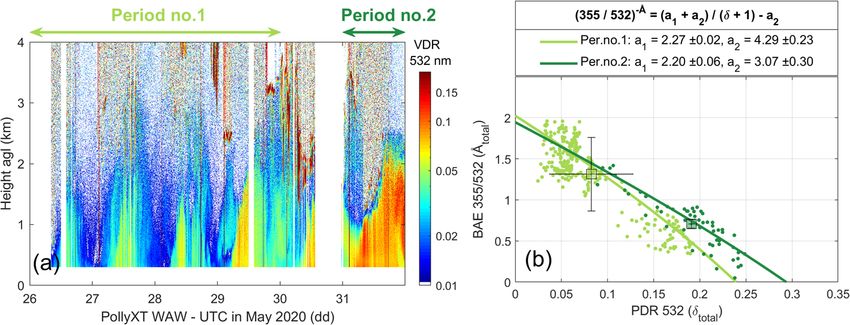
3934                                                           X. Shang et al.: Pollen observations at four EARLINET stations

ground level when available. The SILAM (System for Inte-            rameter η:
grated modeLling of Atmospheric coMposition) dispersion                                         −Åx (λ1 ,λ2 )
model (Sofiev et al., 2015a; https://silam.fmi.fi, last access:                             λ1
                                                                    ηx (λ1 , λ2 ) =                               .                                  (2)
1 October 2021) provides the forecasts of pollen distribu-                                  λ2
tion over Europe, with 10 km and 1 h as spatial and time
resolutions, respectively. Vertical profiles of pollen concen-      From now on, the wavelength pair (λ1 , λ2 ) for η and Å ex-
trations are available for 10 height levels (with layer mid-        pressions is omitted in the following derivations.
point height from 12.5 to 7725 m from the surface), includ-           Shang et al. (2020) demonstrated the power-law relation-
ing six pollen types (alder, birch, grass, mugwort, olive, and      ship between the BAE of total particles (Åtotal ) and the pollen
ragweed pollen; Siljamo et al., 2013; Sofiev, 2017; Sofiev          backscatter contribution (the ratio of the pollen backscatter
et al., 2013, 2015b). A Hirst-type Burkard pollen sampler           coefficient and the total particle backscatter coefficient) (see
was placed ∼ 4 m above ground level (a.g.l.) at Kuopio sta-         Eqs. 4–5 in Shang et al., 2020). Similarly, the backscatter
tion during the campaign to enable identification of pollen         contribution of depolarizing or non-depolarizing aerosols can
types and concentration microscopically with a 2 h time reso-       be expressed as:
lution (more detailed descriptions can be found in Bohlmann         (       βd (λ2 )        ηtotal −ηnd
et al., 2019 and reference therein). In Germany, the pollen            βd (λ2 )+βnd (λ2 ) = ηd −ηnd
                                                                            βnd (λ2 )       ηtotal −ηd  .                        (3)
monitoring is available online at six locations (including
                                                                       βd (λ2 )+βnd (λ2 ) = ηnd −ηd
the Leipzig station), using the fully automatic pollen moni-
tor BAA500 (Hund GmbH; https://www.hund.de/en/service/              The particle linear depolarization ratio of the total parti-
pollen-monitor, last access: 1 October 2021) that combines          cles (δtotal ), containing depolarizing and non-depolarizing
advanced computer-aided microscopy, camera, and image-              aerosols, can be calculated using the backscatter coefficients
recognition technology to determine and pollen grain count          and the depolarization ratios of each type as
with a 3 h time resolution.
                                                                                 βd ·δd  βnd ·δnd
                                                                                 δd +1 + δnd +1
                                                                    δtotal =       βd      βnd
                                                                                                     .                                               (4)
2.4    PDR vs. BAE theory                                                        δd +1 + δnd +1

Previous lidar-derived pollen studies show tendencies to-           We divide both numerator and denominator by the total par-
wards smaller Ångström exponents with increasing depolar-           ticle backscatter coefficient, i.e. (βd + βnd ), and replace the
ization ratios (Bohlmann et al., 2019, 2021; Shang et al.,          expressions in Eq. (3). Simple conversion yields
2020), indicating the increasing impact of larger and non-
spherical pollen particles. Here, we investigate, mathemat-                    ηtotal (δd − δnd ) − (ηnd δd δnd + ηnd δnd − ηd δnd δd − ηd δnd )
                                                                    δtotal =                                                                     ,   (5)
ically, the relationship of the backscatter-related Ångström                           ηtotal (δnd − δd ) − (ηnd δnd + ηnd − ηd δd − ηd )
exponent (BAE, denoted as Å) and the particle linear de-            and after further rearrangements, we obtain
polarization ratio (PDR, denoted as δ). Note that the BAE
depends on the particle size, shape, and complex refractive                      ηnd δd (δnd + 1) − ηd δnd (δd + 1) + ηnd (δnd + 1) − ηd (δd + 1)
index (e.g. Miffre et al., 2020; Mishchenko et al., 2002) and       ηtotal =
                                                                                                      (δd − δnd ) (δtotal + 1)
thus demonstrates higher sensitivity to the changes in aerosol                   ηnd (δnd + 1) − ηd (δd + 1)
mixture composition. Two aerosol populations, depolariz-                     −                               .
                                                                                          (δd − δnd )
ing (d) and non-depolarizing (nd) aerosols, are considered.                                                                                          (6)
The total particle backscatter coefficient (βtotal ) is the sum
of the backscatter coefficients of depolarizing (βd ) and non-      This equation can be expressed in a simplified way as
depolarizing (βnd ) aerosols.
                                                                             −Åtotal
   The BAE describes the wavelength dependence on the

                                                                        λ1                      a1 + a2
backscatter coefficients between two wavelengths λ1 and                                 =                      − a2 ,                                (7)
                                                                        λ2                  (δtotal (λ2 ) + 1)
λ2 (Ångström, 1964):
                                                                  with two coefficients (a1 , a2 ) defined from four characteristic
                  ln ββxx (λ 1)
                          (λ2 )
                                                                    parameters (ηnd , ηd , δnd , δd ) as
Åx (λ1 , λ2 ) = −        ,                                 (1)    (
                    ln λ2λ1
                                                                       a1 = ηnd δd (δnd (δ
                                                                                        +1)−ηd δnd (δd +1)
                                                                                           d −δnd )
                                                                            ηnd (δnd +1)−ηd (δd +1)        .                      (8)
                                                                       a2 =         (δd −δnd )
with the index x for aerosol type, which can be d (for depo-
larizing particle, e.g. pollen), nd (for non-depolarizing parti-    The relationship between lidar-derived BAE and PDR of to-
cle, e.g. background), or total (for total particles). The wave-    tal particles is fixed for the mixture of two aerosol types.
length pair (λ1 , λ2 ) was selected as (355, 532) in this study.    It can be mathematically derived if the characteristic val-
For simplicity of the later calculation, we introduce the pa-       ues of these two aerosol types (Åd , δd and Ånd , δnd ) are

Atmos. Chem. Phys., 22, 3931–3944, 2022                                                      https://doi.org/10.5194/acp-22-3931-2022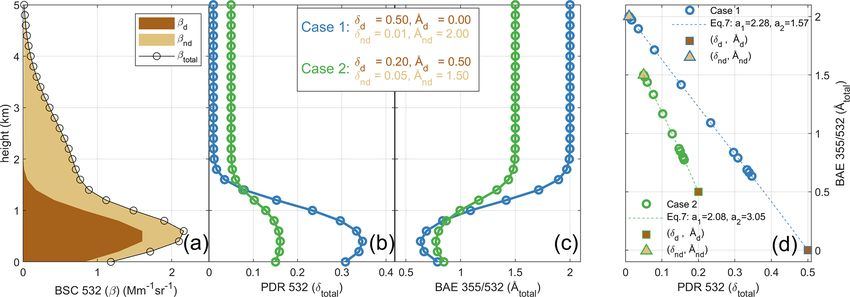
X. Shang et al.: Pollen observations at four EARLINET stations                                                                                  3935

Figure 1. (a) Synthetic vertical profile of the total particle backscatter coefficient (βtotal ) at 532 nm; the shares of depolarizing (βd ) and
non-depolarizing (βnd ) particles are given by dark brown and light brown areas. Synthetic profiles of (b) the particle linear depolarization
ratio (PDR, δtotal ) at 532 nm and (c) the backscatter-related Ångström exponent (BAE, Åtotal ) between 355 and 532 nm, under two groups of
initial values (case 1 in blue and case 2 in green) of the depolarization ratio (δ) and the BAE of depolarizing (d) and non-depolarizing (nd)
particles (δd , δnd , Åd , Ånd ; values given in the legend). (d) Scatter plot of δtotal and Åtotal for two synthetic cases. The dashed fitting line of
each case is determined by Eq. (7) with parameters (a1 and a2 ) given. The boundary points (dark brown squares and light brown triangles)
are defined by the initial values (shown in the legend in b–c). Open circles present each bin.

known. Synthetic examples are given in Fig. 1 where the                       3     Results
backscatter coefficient profiles of depolarizing (βd ), non-
depolarizing (βnd ), and total particles (βtotal ) were simulated.            3.1    Selected pollen periods
Under different initial characteristic values (case 1 or case
2) of depolarizing and non-depolarizing particles, the PDR                    The pollen periods were selected for each station in May
and BAE profile of total particles are different (e.g. Fig. 1b–c              2020 (Table 2), with the following criteria: (1) dust-free
in blue or green). The relationships between simulated Åtotal                 as indicated by the NMMB/BSC-Dust model (see Supple-
and δtotal under each assumption are shown in Fig. 1d: the                    ment) and (2) relatively high pollen concentrations (from the
bottom-right (top-left) boundary point of the fitting line is de-             SILAM model forecasting and/or in situ measurements when
termined by Å and δ of the depolarizing (non-depolarizing)                    available). Since the closest layer to the ground is assumed to
particles, shown as dark brown squares (light brown trian-                    contain the highest pollen concentration and share, the low-
gles), whereas the curve shape of fitting lines is determined                 est layers were considered the pollen layers in this study.
by Eq. (7), i.e. different values of a1 and a2 defined by                     In addition, the retrieved BSC at 532 and 355 nm should
Eq. (8). Note that the two boundary points of each fitting                    be larger than 0.05 and 0.1 Mm−1 sr−1 , respectively. These
line are independent, as they are determined separately by                    threshold values were adapted from the ones used in Baars
the characteristic values (Åx and δx ) of each aerosol type.                  et al. (2017), in which the quasi-BSC at 1064 nm below 0.01
Such a relationship is valid under two constraints: (i) only                  or 0.2 Mm−1 sr−1 was classified as “clean atmosphere” or
two aerosol populations present in the mixture, (ii) both Å                   “non-typed particles/low concentration”, respectively.
and δ of the two aerosol types should be different. These                        In Kuopio station, there was frequent rain in the first two-
two aerosol types can be dust and non-dust aerosols or pollen                 thirds of May, and almost no pollen was measured by the
and non-depolarizing background aerosols. The method ap-                      Burkard sampler. Birch pollen was observed from 23 to 31
plication for synthetic examples of three aerosol types in                    May, with the highest concentration of ∼ 4000 m−3 on 26
the mixture is present and discussed in the Supplement. For                   May. 23–26 May were selected as the pollen period, when
two (or more) types of depolarizing aerosols and one non-                     there was clear sky. During the period, quite nice diurnal cy-
depolarizing aerosol mixture, the estimated δd values repre-                  cles (see Sect. 3.3.1) were found from lidar observations with
sent a combination of two (or more) depolarizing aerosols,                    enhanced backscatter signals and volume depolarization ra-
with a value between the characteristic (pure) depolarization                 tios in the planetary boundary layer.
ratios of each type. However, the authors recommend using                        In Warsaw station, two periods were selected in this
the method under the constraints mentioned above.                             study (see Sect. 3.3.2): period no. 1, birch pollen period from
                                                                              26 to 29 May, and period no. 2, birch pollen mixture period
                                                                              on 31 May. High birch concentrations (with a median hourly
                                                                              value of 4800 m−3 at the lowest level) were indicated from
                                                                              the SILAM model for both periods, with almost 0 concentra-

https://doi.org/10.5194/acp-22-3931-2022                                                        Atmos. Chem. Phys., 22, 3931–3944, 2022
3936 X. Shang et al.: Pollen observations at four EARLINET stations
Table 2. The selected pollen periods for four stations.
Station Selected Possible Profile (bin) Layer Layer top PDR 532 BAE
period in dominant pollen number bottom (km a.g.l.) 355/532
May 2020 (dd) types (source) (km a.g.l.)
KUO 23–26 Bircha,b 9 (168) 1.16 ± 0.14 2.21 ± 0.32 0.09 ± 0.03 1.52 ± 0.42
WAW 26–29 Bircha 20 (257) 0.57 ± 0.00 1.28 ± 0.32 0.08 ± 0.05 1.31 ± 0.45
HPB 07–08 Birch, grassa 5 (39) 0.71 ± 0.03 1.12 ± 0.17 0.04 ± 0.01 1.24 ± 0.14
LEI 26–27, 30–31 Birch, grassa,c 4 (33) 0.93 ± 0.35 1.36 ± 0.42 0.07 ± 0.03 1.10 ± 0.30
Source of possible dominant pollen types: a SILAM model, b Burkard pollen sampler, c pollen monitor BAA500. Profile and bin numbers, layer heights, and
lidar-derived optical values of selected layers for each station (mean values ± standard derivation of layer-mean values of all profiles) are given (PDR – particle
linear depolarization ratio, BAE – backscatter-related Ångström exponent).
tion of the other five pollen types. In Sect. 3.2, only period
no. 1 is considered, whereas period no. 2 will be discussed in
Sect. 3.3.2.
In Hohenpeißenberg station, high birch concentrations
were found on 9 and 10 May with the highest value at
the lowest level of ∼ 180 m−3 ; however, there was dust
present (from NMMB/BSC-Dust) on these days. In order
to avoid the dust mixture impact on the pollen property re-
trieval, 2 dust-free days (7 and 8 May, see Sect. 3.3.3) were
selected as the pollen period, where nice diurnal cycles of en-
hanced backscatter signals and volume depolarization ratios
in the planetary boundary layer can be found. SILAM model
forecasts suggest the presence of birch and a small amount
of grass pollen, with the highest concentration of ∼ 60 m−3
at the lowest level.
In Leipzig station, the number of available optical profiles
was limited due to the frequent rain. From the SILAM model,
there were few occasions with the presence of pollen in May.
Pollen period was selected as 4 d (26, 27, 30, 31), when there Figure 2. Relationships of the particle linear depolarization ra-
was mainly birch and grass pollen; only four lidar-derived tio (PDR, δ) at 532 nm and the backscatter-related Ångström ex-
optical profiles of a full set were available in the period. ponent (BAE, Å) between 355 and 532 nm. All bins inside pollen
layers are shown by dots for each station with different colours.
The highest value of SILAM hourly pollen concentrations
Averaged layer-mean values are given by the square, with the vari-
is about 100 m−3 . The pollen monitor BAA500 shows mean abilities shown by bars. Fitting regression lines (Eqs. 7 and 9) are
values of the daily pollen concentration of 13 and 26 m−3 for drawn with parameter values given in the legend.
birch and grass pollen during the period.
about 0.04 to 0.09) than the background conditions, suggest-
3.2 Characteristic values ing the presence of non-spherical particles in the atmosphere.
We assumed that inside the pollen layers there are only
Due to the small number of profiles, values of all bins inside two aerosol types: pollen and non-depolarizing background
predefined pollen layers were used (see Table 2). The bot- aerosol (bg). Based on the method presented in Sect. 2.4, we
toms of the pollen layers are limited due to the overlap of the applied a simplified equation (similar to Eq. 7) here:
lidar instrument (the lowest reliable heights after the qual- a1 + a2
ity control tests are about 900, 500, 700, or 600 m a.g.l. for y= − a2 , (9)
(x + 1)
KUO, WAW, HPB, or LEI, respectively), whereas the tops
are defined as the lowest observed layers based on the gra- where x is the bin value of measured PDR at 532 nm inside
dient method applied on both BSCs and PDRs. The mean the pollen layer, i.e. δtotal (532), and y is the bin value de-
values of PDR and BAE in Table 2 are the averages of the fined from BAE calculated by the measured BSCs at 355 and
layer-mean values (in the selected layers) of all selected pro- −Åtotal (355,532)
files per each station. Averaged layer-mean values of PDRs 532 nm inside the pollen layer, i.e. y = 355532 .
in pollen layers of four stations are slightly enhanced (from
Atmos. Chem. Phys., 22, 3931–3944, 2022 https://doi.org/10.5194/acp-22-3931-2022X. Shang et al.: Pollen observations at four EARLINET stations 3937
Table 3. Characteristic values of background (bg) and pollen particles for pollen periods of four stations, derived from the regression fitting
lines in Fig. 2. δ: depolarization ratio at 532 nm. Å: backscatter-related Ångström exponent between 355 and 532 nm. “A” denotes the
assumption.
Station Background Pollen depolarization ratio (δpollen )
δbg (A) Åbg if Åpollen = 0 (A) if Åpollen : 0.5 to −0.5 (A)
KUO 0.03 2.1 0.24 0.20 to 0.27
WAW 0.02 1.9 0.24 0.19 to 0.28
HPB 0.01 1.5 0.21 0.15 to 0.27
LEI 0.01 1.6 0.20 0.15 to 0.25
Figure 3. Overview of the pollen period and a case example at Kuopio station. (a) Pollen concentrations from the Burkard sampler at the roof
level. (b) Birch pollen concentrations from the SILAM model. Time–height cross section of (c) range-corrected signal (RCS) at 1064 nm
and (d) volume depolarization ratio (VDR) at 532 nm of PollyXT . Vertical profiles of (e) particle backscatter coefficients and the pollen
backscatter contribution, (f) backscatter-related Ångström exponent (BAE) and the particle linear depolarization ratio (PDR) of the selected
time period (black dotted box in c, d). The selected pollen layer is shown between grey dashed lines in (e) and (f).
The non-linear least square regression fitting, based on the rameters (Åbg , δpollen ) can be calculated and vice versa. Final
Jacobian matrix, was applied using Eq. (9) to the dataset for estimations of characteristic parameters for all stations are
each station to evaluate the coefficients (a1 , a2 ), with val- given in Table 3. There are no values of the Ångström expo-
ues given in Fig. 2 with their standard deviations. The values nent for pure pollen in the literature; for large particles such
of the coefficients (a1 , a2 ) are different for stations, as they as dust, Mamouri and Ansmann (2014) reported extinction-
are defined (Eq. 8) from characteristic values of two aerosol related Ångström exponents between 440 and 675 nm, with
types, i.e. pollen (Åpollen , δpollen ) and non-depolarizing back- values of −0.2 for coarse dust and 0.25 for total dust. If the
ground aerosol (Åbg , δbg ). Under ideal conditions (i.e. two true value of Åpollen is assumed between −0.5 and 0.5, the
aerosol populations present in the mixture, with different possible ranges of δpollen for each station can be given; refer
mixing ratio at different height or time), the unique solution to Table 3.
can be found for the coefficients (a1 , a2 ) with a high accu- For Kuopio and Warsaw stations, the depolarization ra-
racy. But many solutions on the four characteristic values tios at 532 nm of pure pollen (birch dominant) were found
can result in the same coefficient couple (a1 , a2 ), by reason to be 0.24, which is in agreement with the birch depolariza-
of two equations with four unknowns. Regarding the fitting tion ratio of 0.24 reported in Shang et al. (2020) for lidar ob-
Eq. (9), the value couple of Åx and δx of one pure particle servations in Kuopio in 2016. The pollen depolarization ra-
type (pollen or bg) should be located on the fitting curve the- tios at Hohenpeißenberg and Leipzig stations have relatively
oretically (or under ideal conditions). Thus, with the knowl- smaller values, probably due to the mixture of birch and grass
edge of one parameter, the other can be evaluated. In real- pollen, as indicated by SILAM model. Grass pollen, depend-
ity, the depolarization ratio of the background particles (δbg ) ing on the genera, can be more spherical in shape compared
can be reasonably estimated or assumed, whereas the BAE to birch pollen; thus, smaller depolarization ratio is expected.
of pure pollen (Åpollen ) can be assumed to be 0, as pollen These measurements were not affected by extreme meteoro-
grains are quite large particles (e.g. birch pollen has a diame- logical events and represent values for pollen under ambi-
ter around 20–30 µm). Hence, the other two characteristic pa- ent atmospheric condition in the spring season (similar con-
https://doi.org/10.5194/acp-22-3931-2022 Atmos. Chem. Phys., 22, 3931–3944, 20223938 X. Shang et al.: Pollen observations at four EARLINET stations
Figure 4. (a) Time–height cross section of volume depolarization ratio (VDR) at 532 nm from PollyXT at Warsaw station on 26–31 May
2020. The two selected periods are indicated on the top. (b) Similar to Fig. 2 but for two periods at Warsaw station.
Table 4. Comparison of characteristic values of background and pollen/dust particles, for selected periods of Warsaw and Hohenpeißenberg
stations. δ: depolarization ratio at 532 nm. Å: backscatter-related Ångström exponent between 355 and 532 nm. The index d is used for the
depolarizing particles (i.e. pollen or dust).
Station Selected period Profile (bin) Background Possible depolarizing δd
in May 2020 (dd) number δbg Åbg particle types if Åd = 0 if Åd : 0.5 to −0.5
WAW Period no. 1: 26–29 20 (257) 0.02 1.9 Pollen (birch) 0.24 0.19 to 0.28
Period no. 2: 31 2 (56) 0.02 1.8 Pollen (birch mixture) 0.29 0.23 to 0.35
HPB Period no. 1: 07–08 5 (39) 0.01 1.5 Pollen (birch and grass) 0.21 0.15 to 0.27
Period no. 2: 18 3 (19) 0.01 1.7 Dust 0.32 0.24 to 0.40
clusions in Bohlmann et al., 2019). Note that different char- pollen types only accounted for ∼ 2 %. The time–height
acteristic values of pollen could be observed under extreme plot of birch pollen concentrations from the SILAM fore-
humid or extreme dry conditions: (i) pollen grains can fold cast is given in Fig. 3b, showing that birch pollen can
up and change shape while dehydrating, e.g. commercially reach up to ∼ 3 km a.g.l., with higher concentrations near
available pollen for laboratory measurements, and (ii) pollen ground. PollyXT lidar observations of the range-corrected
grains can swell by taking up water especially after reaching signal (RCS) at 1064 nm and the volume depolarization ra-
a relative humidity over 89 % (see Fig. 2 in Griffiths et al., tio (VDR) at 532 nm are presented in Fig. 3c–d. A high
2012). aerosol load was observed within the first 3 km considering
the strong backscatter signals. Enhanced VDRs were corre-
lated with higher birch concentrations, with diurnal cycles. A
3.3 Case examples
case example of lidar-derived optical profiles (time-averaged
The present method (Sect. 2.4) was used to evaluate the at 10:00–12:00 UTC on 26 May) is shown in Fig. 3e–f.
characteristic values of the pure particle type, e.g. to esti- The pollen backscatter contribution (the ratio of the pollen
mate the pure pollen depolarization ratios, and a case exam- backscatter coefficient and the total particle backscatter co-
ple for Kuopio station is presented here (Sect. 3.3.1). It can efficient) at 532 nm was calculated based on the pollen de-
also be applied for the aerosol classification. Two case exam- polarization ratio at 532 nm of 0.24 derived in Sect. 3.2. The
ples from the campaign periods are presented (Sects. 3.3.2 layer-mean value of the pollen backscatter contribution for
and 3.3.3). the selected case is ∼ 51 %. A clear tendency towards higher
pollen contribution with increasing depolarization ratios and
decreasing BAEs can be found, indicating the increasing im-
3.3.1 Kuopio – birch pollen
pact of pollen in the aerosol mixture. The assumption on the
An overview of the selected pollen period at Kuopio sta- depolarization ratio of the background particles (δbg ) can af-
tion is given in Fig. 3. Bi-hourly concentrations from the fect the pollen backscatter coefficient retrieval. An underes-
Burkard sampler (Fig. 3a) at the roof level (∼ 4 m a.g.l.) timate of the δbg will result in an overestimate of the pollen
show birch pollen presence during the period, with other backscatter coefficient. For the given case example, if δbg
Atmos. Chem. Phys., 22, 3931–3944, 2022 https://doi.org/10.5194/acp-22-3931-2022X. Shang et al.: Pollen observations at four EARLINET stations 3939
Figure 5. Case example in period no. 1 of Hohenpeißenberg sta- Figure 6. Similar to Fig. 5 but in period no. 2 of Hohenpeißenberg
tion. Time–height cross section of (a) range-corrected signal (RCS) station.
at 1064 nm and (b) volume depolarization ratio (VDR) at 532 nm
from PollyXT . Vertical profiles of (c) particle backscatter coef-
ficients and the pollen backscatter contribution; (d) backscatter- ing six pollen types, forecasts that mainly birch pollen is
related Ångström exponent (BAE) and the particle linear depolar- present for the whole period. However, stronger VDR on 31
ization ratio (PDR) of the selected time period (black dotted box in
May was observed compared to previous days. Two periods
a, b). Selected layer is shown between grey dashed lines in (c) and
were defined (Table 4) for the comparison, separated by 30
(d).
May when low clouds and/or rain occurred. For period no. 2,
i.e. 31 May, only two profiles are available due to the low
were assumed to be 0.01 instead of 0.03, a ∼ 6 % higher cloud. The non-linear least square regression fitting was ap-
pollen backscatter contribution (with a layer-mean value of plied to the dataset using Eq. (9) for two periods, separately,
56 % instead of 51 %) would be obtained. with results given in Fig. 4b and Table 4. The general de-
polarization ratio of the background particles (δbg ) at War-
saw station can be assumed as 0.02, the BAE values of the
3.3.2 Warsaw – different pollen types
background particles were thus derived as quite close val-
The time–height plot of VDRs at 532 nm from PollyXT at ues (1.9 or 1.8 for each period). Nevertheless, under the as-
Warsaw station for 26–31 May 2020 is presented in Fig. 4a. sumption of Åpollen = 0, the pollen depolarization ratio for
Nice diurnal cycles of enhanced VDRs are visible, which period no. 2 was estimated as a higher value (0.29) than the
are likely due to pollen presence in the atmosphere. The one for period no. 1 (0.24). The δpollen value of period no. 1
NMMB/BSC-Dust model suggests that no dust is present is in good agreement with the one of Kuopio station, for
below 7 km during the period. The SILAM model, includ- birch pollen. A higher δpollen value for period no. 2 suggests
https://doi.org/10.5194/acp-22-3931-2022 Atmos. Chem. Phys., 22, 3931–3944, 20223940 X. Shang et al.: Pollen observations at four EARLINET stations
lidar-derived optical profiles are shown in Figs. 5c–d and 6c–
d. The layer-mean backscatter contribution of pollen (dust)
for the selected case in period no. 1 (no. 2) was estimated
as ∼ 22 % (53 %), based on the evaluated pure depolariza-
tion ratios of 0.21 (0.32) and Åd of 0. If δbg were assumed to
be 0.03 instead of 0.01, the layer-mean backscatter contribu-
tion of pollen (dust) for the selected case would be estimated
as ∼ 11 % (49 %). Using the presented method, the dust
and pollen can clearly be classified for this case study (e.g.
Fig. 7). However, if the certain pollen type (e.g. pine pollen
with 0.36 as δpollen as reported in Shang et al. (2020)) has
a similar characteristic value as dust, the separation could
be more challenging; thus, additional information (e.g. the
fluorescence as stated in Veselovskii et al. 2021) would be
needed.
Figure 7. Similar to Fig. 2 but for two periods at Hohenpeißenberg
station. 4 Summary and conclusions
During the ACTRIS-COVID-19 campaign in May 2020,
the additional presence of more non-spherical particles, e.g. continuous lidar measurements were performed at EAR-
pine pollen (Shang et al., 2020), which is not included in the LINET stations, with data (including optical property pro-
SILAM model. files) publicly available after centralized and automatic data
processing with SCC. Four EARLINET and PollyNET li-
3.3.3 Hohenpeißenberg – pollen and dust dar stations (Hohenpeißenberg, Germany; Kuopio, Finland;
Leipzig, Germany; and Warsaw, Poland) were selected for
Two periods were defined (Table 4) for the comparison study the pollen property retrieval during dust-free pollen periods,
of pollen and dust particles observed in Hohenpeißenberg whereby we focused on vertical profiles of particle backscat-
station. In period no. 1, only lowest layers were considered ter coefficients at 355 and 532 nm and particle linear depo-
pollen layers. A case example is given in Fig. 5; pollen pres- larization ratios at 532 nm.
ence can be seen between 08:00 and 16:00 UTC close to the A novel method, based on the non-linear least square
ground with enhanced backscatter signal and VDR. In pe- regression fitting using lidar-derived backscatter-related
riod no. 2, a lofted aerosol layer with high VDRs, located at Ångström exponent (BAE) and the particle linear depolariza-
∼ 2 km at midnight and descending to ∼ 1.5 km in the morn- tion ratio (PDR), was used for the characterization of the pure
ing, was selected as the dust layer (Fig. 6). The dust fore- pollen depolarization ratio. This easy-to-apply algorithm can
cast at both Garmisch-Partenkirchen (47.47◦ N, 11.07◦ E) estimate two coefficients to determine the relationship be-
and Munich (48.15◦ N, 11.57◦ E) stations (closest to Hohen- tween PDR and BAE. Such a relationship is valid under
peißenberg station) of the NMMB/BSC-Dust model shows two constraints: (i) only two aerosol populations, depolar-
the dust layer at similar height (see the Supplement). The air izing (e.g. pollen or dust) and non-depolarizing (e.g. non-
mass sources, investigated by the backward trajectory analy- depolarizing background) aerosols, can be assumed in the
sis (HYSPLIT model), also shows that some of the particles aerosol mixture, and (ii) both the depolarization ratio and the
were transported from the Sahara region. BAE of the two aerosol types should be different. Mathe-
The non-linear least square regression fitting was applied matically (or under ideal conditions), the PDR and BAE of a
to the dataset using Eq. (9) for two periods, with results given mixture of depolarizing and non-depolarizing aerosols, with
in Fig. 7 and Table 4. Even though the profile numbers are whichever mixing rate, should follow the derived relation-
quite limited for both periods, the method was applied suc- ship. Hence, with the knowledge of one parameter (PDR or
cessfully using all bins inside the selected layers. The depo- BAE), the other can be evaluated. The characteristic values
larization ratio of the background particles (δbg ) at Hohen- of the pure aerosol type can be evaluated in this way if one
peißenberg station can be assumed as 0.01; the BAE values parameter is known or can be reasonably assumed.
of the background particles were derived as 1.5 and 1.7 for Under the assumption that the BAE between 355 and
the two periods. Such a difference may be due to the possible 532 nm should be zero for pure pollen, the pollen depolar-
change on the background aerosol nature, as these two peri- ization ratios were estimated: for Kuopio and Warsaw sta-
ods were separated by 10 d. If we assumed that BAEs of both tions, the pollen depolarization ratios at 532 nm were found
pollen and dust are equal to 0, the δd of pollen and dust were to be 0.24 during the birch-dominant pollen periods, whereas
estimated as 0.21 and 0.32, respectively. Case examples of for Hohenpeißenberg and Leipzig stations, the pollen depo-
Atmos. Chem. Phys., 22, 3931–3944, 2022 https://doi.org/10.5194/acp-22-3931-2022X. Shang et al.: Pollen observations at four EARLINET stations 3941
larization ratios were found to be 0.21 and 0.20 during the Special issue statement. This article is part of the special issue
pollen period when there was a mixture of birch and grass “Quantifying the impacts of stay-at-home policies on atmospheric
pollen. However, the uncertainty in the assumed BAE of pure composition and properties of aerosol and clouds over the Euro-
pollen will introduce non-negligible bias. If the true value of pean regions using ACTRIS related observations (ACP/AMT inter-
pollen BAE were between −0.5 and 0.5, relative uncertain- journal SI)”. It is not associated with a conference.
ties on estimated pollen depolarization ratios would be found
between 14 %–30 %. Thus, measuring the Ångström expo-
Acknowledgements. The authors acknowledge the
nent of pure pollen, e.g. in laboratory experiments (in atmo-
data and/or images from the NMMB/BSC-Dust model,
spheric conditions), would be beneficial and would certainly
operated by the Barcelona Supercomputing Center
improve the determination of pure pollen depolarization ra- (http://www.bsc.es/ess/bsc-dust-daily-forecast, last access: 1
tios. The present method was also applied for the aerosol October 2021). The authors gratefully acknowledge NOAA
classification, using two case examples from the campaign Air Resources Laboratory (ARL) for the provision of the
periods. The different pollen types (or pollen mixtures) were HYSPLIT transport and dispersion model and/or READY
identified at Warsaw station, and dust and pollen were clas- website (https://www.ready.noaa.gov, last access: 1 October
sified at Hohenpeißenberg station. 2021) used in this publication. The authors acknowledge the
This study shows that automatically retrieved lidar data Biodiversity Unit of the University of Turku and the core per-
profiles (using SCC) are suitable for pollen characteriza- sonnel Annika Saarto and Sanna Pätsi for the analysis of the
tions. The method was demonstrated for sites at which we pollen samples at Kuopio station. The authors acknowledge
the pollen data of the pollen monitor BAA500 (Hund GmbH;
have seldom or no (e.g. Warsaw and Kuopio) long-range-
https://www.hund.de/en/service/pollen-monitor, last access: 1
transported dust. Additional information, e.g. dust-free pe- October 2021). The authors acknowledge the SILAM team,
riod from dust models or fluorescence information to iden- especially Mikhail Sofiev and Rostislav Kouznetsov, for the
tify dust and pollen (Veselovskii et al., 2021), is needed to provision of the SILAM model. The authors thank Simo Heikkinen
exclude dust impact in the areas where dust is present. The for his help with the regression fitting algorithm. Warsaw lidar
proposed methodology demonstrated a first step towards au- station measurements and data evaluation are performed in a
tomated pollen detection in lidar networks. team effort; during May 2020 the core personnel involved were
Iwona S. Stachlewska, Dominika Szczepanik, Rafal Fortuna,
Lucja Janicka, and Wojciech Kumala. The team at Leipzig station
Data availability. ACTRIS aerosol remote sensing COVID-19 appreciates the contributions of all the individuals that have been
campaign data of May 2020: https://doi.org/10.21336/gen.xmbc- involved in supporting, enabling, and maintaining Polly measure-
tj86 (ACTRIS ARES Data Centre, 2020). Optical products ments and the pollen observations. The research leading to the
used in this article are available: https://doi.org/10.23728/fmi- SCC results is supported by the European Commission under the
b2share.959be96f095640578eb5a7dc335c8b46 (Shang et al., Horizon 2020 – Research and Innovation Framework Programme,
2021). H2020-INFRADEV-2019-2 (grant no. 871115).
Supplement. The supplement related to this article is available Financial support. This research has been supported by the
online at: https://doi.org/10.5194/acp-22-3931-2022-supplement. Academy of Finland (projects nos. 310312 and 329216). EAR-
LINET stations were supported by ACTRIS; ACTRIS has received
funding from the European Union’s Horizon 2020 research
Author contributions. XS analysed the data, developed the algo- and innovation programme (grant nos. 654109 (ACTRIS-
rithm, and wrote the article. HB, ISS, IM, and MK are the principal 2), 759530 (ACTRIS-PPP), 871115 (ACTRIS-IMP), and
investigators (PIs) of the LEI, WAW, HPB, and KUO stations, re- 824068 (ENVRI-FAIR)). The SCC development has been
spectively. All authors ensured the high-quality operation of the re- funded by the ACTRIS research infrastructure project by the
spective lidars. All authors reviewed and commented on the article. European Union’s Horizon 2020 research and innovation pro-
gramme (grant no. 654109) and previously (grant no. 262254) in
the Seventh Framework Programme (FP7/2007–2013). Warsaw
station (UW) was supported by of the European Space Agency,
Competing interests. The contact author has declared that nei-
POLIMOS-4000119961/16/NL/FF/mg.
ther they nor their co-authors have any competing interests.
Review statement. This paper was edited by Matthias Tesche and
Disclaimer. Publisher’s note: Copernicus Publications remains
reviewed by two anonymous referees.
neutral with regard to jurisdictional claims in published maps and
institutional affiliations.
https://doi.org/10.5194/acp-22-3931-2022 Atmos. Chem. Phys., 22, 3931–3944, 20223942 X. Shang et al.: Pollen observations at four EARLINET stations
References Mogilnicka, E., Okamoto, Y., Orru, M. P., Potter, P., Price, D.,
Stoloff, S. W., Vandenplas, O., Viegi, G., and Williams, D.: Aller-
gic Rhinitis and its Impact on Asthma (ARIA) 2008, Allergy, 63,
Ångström, A.: The parameters of atmospheric turbidity, Tellus A, 8–160, https://doi.org/10.1111/j.1398-9995.2007.01620.x, 2008.
16, 64–75, https://doi.org/10.3402/tellusa.v16i1.8885, 1964. Buters, J. T. M., Antunes, C., Galveias, A., Bergmann, K. C.,
ACTRIS ARES Data Centre: ACTRIS aerosol remote Thibaudon, M., Galán, C., Schmidt-Weber, C., and Oteros, J.:
sensing COVID-19 campaign data of May 2020, Con- Pollen and spore monitoring in the world, Clin. Transl. Allergy,
siglio Nazionale delle Ricerche – CNR [data set], 8, 9, https://doi.org/10.1186/s13601-018-0197-8, 2018.
https://doi.org/10.21336/gen.xmbc-tj86, 2020. D’Amato, G., Cecchi, L., Bonini, S., Nunes, C., Annesi-
Baars, H., Kanitz, T., Engelmann, R., Althausen, D., Heese, Maesano, I., Behrendt, H., Liccardi, G., Popov, T., and van
B., Komppula, M., Preißler, J., Tesche, M., Ansmann, A., Cauwenberge, P.: Allergenic pollen and pollen allergy in Eu-
Wandinger, U., Lim, J.-H., Ahn, J. Y., Stachlewska, I. S., rope, Allergy, 62, 976—990, https://doi.org/10.1111/j.1398-
Amiridis, V., Marinou, E., Seifert, P., Hofer, J., Skupin, A., 9995.2007.01393.x, 2007.
Schneider, F., Bohlmann, S., Foth, A., Bley, S., Pfüller, A., Gian- D’Amico, G., Amodeo, A., Baars, H., Binietoglou, I., Freuden-
nakaki, E., Lihavainen, H., Viisanen, Y., Hooda, R. K., Pereira, thaler, V., Mattis, I., Wandinger, U., and Pappalardo, G.:
S. N., Bortoli, D., Wagner, F., Mattis, I., Janicka, L., Markowicz, EARLINET Single Calculus Chain – overview on method-
K. M., Achtert, P., Artaxo, P., Pauliquevis, T., Souza, R. A. F., ology and strategy, Atmos. Meas. Tech., 8, 4891–4916,
Sharma, V. P., van Zyl, P. G., Beukes, J. P., Sun, J., Rohwer, E. https://doi.org/10.5194/amt-8-4891-2015, 2015.
G., Deng, R., Mamouri, R.-E., and Zamorano, F.: An overview of D’Amico, G., Amodeo, A., Mattis, I., Freudenthaler, V., and Pap-
the first decade of PollyNET : an emerging network of automated palardo, G.: EARLINET Single Calculus Chain – technical – Part
Raman-polarization lidars for continuous aerosol profiling, At- 1: Pre-processing of raw lidar data, Atmos. Meas. Tech., 9, 491–
mos. Chem. Phys., 16, 5111–5137, https://doi.org/10.5194/acp- 507, https://doi.org/10.5194/amt-9-491-2016, 2016.
16-5111-2016, 2016. Diehl, K., Quick, C., Matthias-Maser, S., Mitra, S. K., and Jaenicke,
Baars, H., Seifert, P., Engelmann, R., and Wandinger, U.: R.: The ice nucleating ability of pollen Part I: Laboratory studies
Target categorization of aerosol and clouds by continu- in deposition and condensation freezing modes, Atmos. Res., 58,
ous multiwavelength-polarization lidar measurements, Atmos. 75–87, https://doi.org/10.1016/S0169-8095(01)00091-6, 2001.
Meas. Tech., 10, 3175–3201, https://doi.org/10.5194/amt-10- Diehl, K., Matthias-Maser, S., Jaenicke, R., and Mitra, S. K.: The
3175-2017, 2017. ice nucleating ability of pollen: Part II. Laboratory studies in im-
Bohlmann, S., Shang, X., Giannakaki, E., Filioglou, M., Saarto, mersion and contact freezing modes, Atmos. Res., 61, 125–133,
A., Romakkaniemi, S., and Komppula, M.: Detection and char- https://doi.org/10.1016/S0169-8095(01)00132-6, 2002.
acterization of birch pollen in the atmosphere using a mul- Engelmann, R., Kanitz, T., Baars, H., Heese, B., Althausen, D.,
tiwavelength Raman polarization lidar and Hirst-type pollen Skupin, A., Wandinger, U., Komppula, M., Stachlewska, I. S.,
sampler in Finland, Atmos. Chem. Phys., 19, 14559–14569, Amiridis, V., Marinou, E., Mattis, I., Linné, H., and Ansmann,
https://doi.org/10.5194/acp-19-14559-2019, 2019. A.: The automated multiwavelength Raman polarization and
Bohlmann, S., Shang, X., Vakkari, V., Giannakaki, E., Leskinen, A., water-vapor lidar PollyXT : the neXT generation, Atmos. Meas.
Lehtinen, K. E. J., Pätsi, S., and Komppula, M.: Lidar depolar- Tech., 9, 1767–1784, https://doi.org/10.5194/amt-9-1767-2016,
ization ratio of atmospheric pollen at multiple wavelengths, At- 2016.
mos. Chem. Phys., 21, 7083–7097, https://doi.org/10.5194/acp- Gabey, A. M., Gallagher, M. W., Whitehead, J., Dorsey, J. R.,
21-7083-2021, 2021. Kaye, P. H., and Stanley, W. R.: Measurements and comparison
Bousquet, J., Khaltaev, N., Cruz, A. A., Denburg, J., Fokkens, of primary biological aerosol above and below a tropical for-
W. J., Togias, A., Zuberbier, T., Baena-Cagnani, C. E., Canon- est canopy using a dual channel fluorescence spectrometer, At-
ica, G. W., Van Weel, C., Agache, I., Aït-Khaled, N., Bachert, mos. Chem. Phys., 10, 4453–4466, https://doi.org/10.5194/acp-
C., Blaiss, M. S., Bonini, S., Boulet, L.-P., Bousquet, P.-J., Ca- 10-4453-2010, 2010.
margos, P., Carlsen, K.-H., Chen, Y., Custovic, A., Dahl, R., García-Mozo, H.: Poaceae pollen as the leading aeroal-
Demoly, P., Douagui, H., Durham, S. R., Van Wijk, R. G., lergen worldwide: A review, Allergy, 72, 1849–1858,
Kalayci, O., Kaliner, M. A., Kim, Y.-Y., Kowalski, M. L., Kuna, https://doi.org/10.1111/ALL.13210, 2017.
P., Le, L. T. T., Lemiere, C., Li, J., Lockey, R. F., Mavale- Gilles, S., Blume, C., Wimmer, M., Damialis, A., Meulenbroek, L.,
Manuel, S., Meltzer, E. O., Mohammad, Y., Mullol, J., Na- Gökkaya, M., Bergougnan, C., Eisenbart, S., Sundell, N., Lindh,
clerio, R., O’Hehir, R. E., Ohta, K., Ouedraogo, S., Palkonen, M., Andersson, L. M., Dahl, Å., Chaker, A., Kolek, F., Wagner,
S., Papadopoulos, N., Passalacqua, G., Pawankar, R., Popov, T. S., Neumann, A. U., Akdis, C. A., Garssen, J., Westin, J., van’t
A., Rabe, K. F., Rosado-Pinto, J., Scadding, G. K., Simons, F. Land, B., Davies, D. E., and Traidl-Hoffmann, C.: Pollen expo-
E. R., Toskala, E., Valovirta, E., Van Cauwenberge, P., Wang, sure weakens innate defense against respiratory viruses, Allergy,
D.-Y., Wickman, M., Yawn, B. P., Yorgancioglu, A., Yusuf, 75, 576–587, https://doi.org/10.1111/all.14047, 2020.
O. M., Zar, H., Annesi-Maesano, I., Bateman, E. D., Kheder, Griffiths, P. T., Borlace, J.-S., Gallimore, P. J., Kalberer, M., Herzog,
A. Ben, Boakye, D. A., Bouchard, J., Burney, P., Busse, W. M., and Pope, F. D.: Hygroscopic growth and cloud activation of
W., Chan-Yeung, M., Chavannes, N. H., Chuchalin, A., Dolen, pollen: a laboratory and modelling study, Atmos. Sci. Lett., 13,
W. K., Emuzyte, R., Grouse, L., Humbert, M., Jackson, C., 289–295, https://doi.org/10.1002/asl.397, 2012.
Johnston, S. L., Keith, P. K., Kemp, J. P., Klossek, J.-M., Groß, S., Freudenthaler, V., Wirth, M., and Weinzierl, B.: Towards
Larenas-Linnemann, D., Lipworth, B., Malo, J.-L., Marshall, an aerosol classification scheme for future EarthCARE lidar ob-
G. D., Naspitz, C., Nekam, K., Niggemann, B., Nizankowska-
Atmos. Chem. Phys., 22, 3931–3944, 2022 https://doi.org/10.5194/acp-22-3931-2022You can also read


