REALTOR SACRAMENTO - FAIR HOUSING MONTH

Page created by Floyd Sandoval
 
CONTINUE READING
REALTOR SACRAMENTO - FAIR HOUSING MONTH
SACRAMENTO
             REALTOR
             Making Sacramento a Better Place to Call Home for Over 100 Years
                                                                                     ®
APRIL 2021               A PUBLICATION OF THE SACRAMENTO ASSOCIATION OF REALTORS ®

 FAIR HOUSING
 MONTH
REALTOR SACRAMENTO - FAIR HOUSING MONTH
2

    INSIDE THIS ISSUE                                                                                        APRIL 2021
    4    President’s Message
                                      SPONSORS
    6    CEO Corner
                                      SUPPORT THOSE THAT SUPPORT YOU.
                                      This edition of the Sacramento REALTOR® is made possible by the following businesses:
10       2020 SAR Awards
                                      Mason McDuffie Mortgage		            page 3 Personal Express Insurance		            page 5

                                                                                              Thank you for your continued support!
12 Legal Update

15       May Calendar

20       MLS Statistics

    14           Government Affairs

        ARE YOU GETTING IT?
        We send out the SAR
        Weekly Docket every
        Wednesday evening -
        are you receiving it? If
        you would like to keep
        up to date with what’s
        happening at SAR, send
        a subscription request to
        tvicari@sacrealtor.org.
REALTOR SACRAMENTO - FAIR HOUSING MONTH
STABILITY SINCE 1887
Change is constantly happening all around us every day. It’s nice to know that the lender
you start your loan with today will be here to fund it at your closing...And be on time!

            David Heard             Thomas Engwer                     Scott Short                      David Whiteside
            NMLS# 244146            NMLS# 240643                      NMLS#225998                      NMLS# 247866
            Branch Manager          Branch Manager                    Loan Officer                     Loan Officer
            530.902.3725            916.532.8263                      916.997.4828                     916.730.8282

                        Jerry Hernandez        Matt Miller                                   Wally Borland
                        NMLS# 545489           NMLS# 332535                                  NMLS# 219570
                        Hablo Espanol          Loan Officer - Sacramento                     Loan Officer
                        Loan Officer           916-548-9278                                  916.955.6267
                        916.549.2694

             FHA, FHA 203K, VA, USDA 100% Financing, CalHFA,
                       CONVENTIONAL and JUMBOS
                    We have over 124 Years of combined lending experience

                             916.929.2333
                                   2033 Howe Avenue, Suite 110
                                      Sacramento, CA 95825
                                                Licensed by the Department of Corporations under
                                                the California Residential Lending Act NMLS# 1141
REALTOR SACRAMENTO - FAIR HOUSING MONTH
4

           SAR LEADERSHIP MESSAGE
                                 Time for Action
                                   Each April, we celebrate the passage of the Fair Housing Act of 1968 which put
                                 laws in place to end discriminatory practices in housing. But, REALTORS must do
                                 more than celebrate these critical policy changes. First, we must understand and
                                 acknowledge that our industry played a part in discrimination in housing for too
                                 long. Second, we must continue to advance policy – like the Fair Housing Act – that
                                 supports diversity and inclusion in housing. Finally, we must do more than celebrate
                                 and discuss these important policies…we must act within our own community. Ask
KELLIE SWAYNE

                                 yourself how you can further Fair Housing here in Sacramento. What can you do to
                                 advance equality in housing and in your business every day? Then, do it.
                                    How can you get started? C.A.R. and NAR have put together an incredible
                                 library of resources for REALTORS. I would encourage every SAR member to
                                 begin with implicit bias training. Seek to understand how your experiences have
                                 impacted the way in which you view the world. And, how that view may impact
                2021 PRESIDENT   your business. Watch this video from NAR: https://www.nar.realtor/videos/bias-
                                 override-overcoming-barriers-to-fair-housing.
                                   Consider walking through Fairhaven, where NAR has created a virtual world
                                 designed to educate members about Fair Housing. In Fairhaven, we are challenged
                                 with real world situations and scenarios that help us better understand discrimination
                                 in housing. In this exercise, you will be presented with different forms of discrimination
                                 as you navigate through deals and will receive feedback about your performance and
                                 choices. Check it out here: https://fairhaven.realtor/home.
                                   How about obtaining the At Home with Diversity (AHWD) designation from
                                 NAR? This course is designed to give you the background you need to be more
                                 aware of bias in our business. It will offer you insights into more inclusive
                                 practices and can assist you in adding strategies to your own business plan that
                                 will help you be a part of the solution to end housing discrimination. Learn more
                                 here: https://www.nar.realtor/at-home-with-diversity.
                                   Locally, we would love for you to get involved at SAR as well. The Sacramento
                                 Association of Realtors is committed to advancing Fair Housing and diversity within
                                 our community. Many of our committees at SAR help to advance diversity, equity,
                                 and inclusion every day: Cultural Diversity and Fair Housing committee, Education
                                 committee, Government Relations committee – just to name a few. Bring your
                                 voice and your ideas to help us be a driving force for positive changes in our region.
                                   I challenge each of us to seek actions, however big or small, that we can take
                                 every day to make Fair Housing in Sacramento – and beyond – a reality for every
                                 member of our diverse community.
REALTOR SACRAMENTO - FAIR HOUSING MONTH
6

              CEO CORNER
                           Fair Housing
                            April is Fair Housing month every year. So why have we not achieved equity in
                           housing? We need to take a long hard look at that aspect of the Fair Housing picture.

                             In our recent class entitled Race in Real Estate – How Did We Get Here, available
                           online at our On Demand Education portal or at the following link, we discussed
                           many reasons that equity in housing has not been achieved. We looked at deliberate
                           actions by the government at all levels, federal, state and local, as well as lending
DAVE TANNER

                           institutions, and REALTORS® both as individuals and as organizations. You should
                           view this class and get a picture not of who we are, but of who we have been. Our
                           industry has been far from the model for Fair Housing in our shameful past.

                             This must change. Not only do we need to change our ways of the past but we
                           need to find ways to be proactive in righting the wrongs that our past actions
                           have caused. A well-documented look at the wrongs of the past is contained in
                           the book entitled The Color of Law – A Forgotten History of How Our Government
                           Segregated America, written by Richard Rothstein. It has been a best seller and is
                           readily available both online and in local bookstores. This book needs to be read
                           cover-to-cover by anyone that is sincerely interested in the topic of Fair Housing.

                             There is another great book on the sordid history of Fair Housing entitled Race For
                           Profit – How Banks and The Real Estate Industry Undermined Black Homeownership,
                           written by Keeanga-Yamahtta Taylor. It documents how, with the stated purpose of
                           enhancing Black homeownership, we developed programs that actually worsened
                           the situation for Black homeowners just trying to get their share of the American
                           Dream of homeownership. In my CEO Corner in April 2017 I talked about REALTORS®
                           not being a part of the solution and not exhibiting Fair Housing when they help
                           families buy properties that any reasonable person knows they cannot afford and
                           will not be able to keep.

                             The third book I would like to mention is Caste – The Origins of Our Discontent,
                           written by Isabel Wilkerson. In this book she documents not only the explicit bias
                           in America as documented in the first two books but also the implicit bias that
                           ties us, even in the absence of laws requiring segregation, to continue to impose
                           segregation through the application of implicit bias. She also expresses some hope
                           and ideas for our ability to move beyond where we are and hopefully at some point
                           in the not too distant future to beginning to see the reality of actual Fair Housing.

                             I encourage you to view the SAR class and read the three books mentioned above.
                           But above all I encourage you to remember that Fair Housing is not just a law, it is
                           an ideal, and every member of organized real estate has an obligation to place the
                           achievement of that ideal above all else. We must be better than we have been.
REALTOR SACRAMENTO - FAIR HOUSING MONTH
7

                         APRIL SPECIALS
    CLOSE OUT STICKERS                                   MEMBER SPECIAL*
  STARBURST 250 COUNT / HEARTS 500 COUNT                      6” x 24” SINGLE COLOR RIDER

                         Buy One For $0.50                                 $10.00 each
                         & Get One FREE*                                   (Originally $14.00 each)
                                                                                Item #5002-NMS
                         (Originally $1.99 each)
 Item #10195-STARBURST                                                    * Normally for New Members
 Item #10196-HEART
                                                                         only, but this April, all Members
              *IN STORE OFFER ONLY                                           get to enjoy the savings!

     BROCHURE HOLDERS                              ZIP UP SHOE COVER BAGS
     $0.75 each                                                 $2.25 each
   (Originally $4.99 each)                                     (Originally $6.99 each)

                                                   ITEM #1090-GREEN
                                                   ITEM #1090-BLUE
                              ITEM #7”T x 6.5”W
  ITEM #1238-3.5”T x 6”W

  FAIR HOUSING POSTERS                             “INITIAL HERE” STAMPER
             $0.19 each
             (Originally $0.99 each)
                                                                             Buy One For $0.10
                                                                             & Get One FREE*
                          ITEM #1486-ENGLISH                                 (Originally $1.99 each)
                          ITEM #1486-SPANISH       ITEM #10159-INITIAL

                                                                 *IN STORE OFFER ONLY

Contact the Retail Center for details | store1@sacrealtor.org | 916.437.1222 / 844.237.3957
REALTOR SACRAMENTO - FAIR HOUSING MONTH
8

    FA I R H O U S I N G M O N T H

     April 2021
       Every April, REALTORS® commemorate the passage of the Fair Housing Act of 1968 with events and education
     that shine a light on housing discrimination and segregation. Fair Housing Month signifies a recommitment to
     expanding equal access to housing.
      Implicit bias is often a manifestation of muscle memory. A go-with-your-gut unconscious choice, act, or opinion
     with immeasurable consequences that can–and have–impacted generations.
       Slow down, course correct, and take action. Throughout the year we must remain steadfast in our commitment
     breaking down biases, holding ourselves accountable, and upholding the letter of the law.
       So, refresh your memory, and open your mind. There’s always more to know, and we can all do better.

     Fair Housing Month Toolkit
       Check out the Fair Housing Month Toolkit to download the poster and get additional resources to help state
     and local associations commemorate Fair Housing Month.

     Fair Housing Book Recommendations
       Residential segregation in America didn’t happen by accident. Americans of different racial backgrounds live
     apart because of deliberate actions by public and private actors. NAR’s Vice President of Policy Advocacy, Bryan
     Greene, compiled a collection of fair housing titles to help NAR members deepen their understanding of how we
     became divided, and of the ramifications of living in a segregated society.

       Don’t have time to read an entire book? Each recommendation also includes book reviews, interviews, videos
     and other tools to give you a quick recap.

     Fair Housing Film and Video Recommendations
       Short videos, documentaries, and a featured length major motion picture help educate about housing
     discrimination, segregation, and the people working to correct these social and economic wrongs.

     Fair Housing Podcasts
      Like to learn about the world from podcasts? We’ve got you covered. From This American Life to The Bowery
     Boys, NAR presents podcasts that will educate you on Fair Housing.

     Fair Housing Journalism
       A compilation of articles featuring the work of investigative journalists who have uncovered critical fair housing
     stories, along with civil rights scholars who have condensed their books into a shorter form. They’ll help you
     deepen your understanding of fair housing in less time than it takes to read an entire book.

     Spotlight on Local and National Fair Organizations
       Fair housing organizations work in communities across the country, as well as at the state and national levels,
     to educate the public about fair housing, investigate claims of discrimination, and push for policies that promote
     housing rights. They work in partnership with governments and private housing providers to promote best
     practices to prevent discrimination and foster diverse, inclusive communities.

     Source: https://www.nar.realtor/fair-housing/fair-housing-month
REALTOR SACRAMENTO - FAIR HOUSING MONTH
APRIL IS
FAIR HOUSING MONTH

Rolling through your day on autopilot? Just because it’s second
nature, doesn’t mean it’s right. Slow down and make sure you’re
providing equal service to all.

April is Fair Housing Month and a great time to affirm you’re
helping to build thriving, inclusive communities. Fair housing
impacts all NAR members, all markets, and all neighborhoods.

Check yourself. Educate yourself. Hold yourself accountable.
Because That’s Who We R®.

Visit nar.realtor/FHM to access tools to help you
prevent discrimination in real estate.
REALTOR SACRAMENTO - FAIR HOUSING MONTH
10

     2 0 2 0 S A R AWA R D S C E R E M O N Y
         Each year, the current SAR President acknowledges the volunteers that contribute exceptional time and effort
       to our Association. Our 2020 President Judy Covington presented these awards in a video ceremony at a recent
       weekly Regional Meeting.
         The dictionary defines a volunteer as “someone who performs or gives their services of their own free will.” That
       truly describes our group category award winners for the year 2020. Not only do they give their time freely, but
       we can always count on them to perform tasks with smiles and good cheer.
         Category awards are given in recognition of outstanding service by the recipient during the award year.
       Preferably only one, but not more than three individuals shall be recognized in a Category. No individual shall
       receive more than two Category Awards in any given year.

       Congratulations to our winners!
       Political Involvement                                      National Association Activities
       • Doug Covill                                              • Judy Covington
       • Kevin Cooper                                             • Chris Little
       • Kellie Swayne
                                                                  Rising Star Award
       Educational Excellence                                     Nathaniel Perez
       • John Jennings
       • Paula Swayne                                             Lifetime Service Award
                                                                  Doug Covill
       Community Service
       • Karen Berkovitz                                          Affiliate of the Year
       • Preston Collier                                          Theresa Gorham
       • Jeff Slodowitz                                           REALTOR® of the Year
       Local Association Activities                               Deniece Ross-Francom
       • Karen Berkovitz                                          President’s Award
       • Rossana Garcia                                           SAR Staff
       • Dan Morasci

       State Association Activities
       • Judy Covington                               Please view the awards ceremony in full in the video below.
       • Erin Stumpf                                    (Also - the recipients in the videos were told they were
       • Paula Swayne                                participating in a video for another reason and did not know
                                                                 they were going to receive the awards!)
                                                                       CLICK HERE TO SEE VIDEO
11

As Lease Addendums Rise, Marijuana Businesses Adapt
by Purchasing Commercial Property
Key Highlights
• Members residing in states with legalized marijuana saw an increase in demand for warehouses.
• Nearly half of those in states that legalized marijuana prior to 2016 have seen addendums added to leases restricting
  growing on properties.
• There is an increase in purchasing properties for marijuana-related businesses instead of leasing.
WASHINGTON (April 16, 2021) – As marijuana becomes legalized in more parts of the country and as an increasing number
of states grow, harvest, store, sell and allow consumption, the nation’s real estate industry has felt the effects.
  According to a new report from the National Association of Realtors®, there has been a noticeable rise in demand for
warehouses, land and store fronts used for marijuana. The 2021 survey, Marijuana and Real Estate: A Budding Issue,
examines the legality of marijuana in terms of medical only, legalized medical and recreational prior to or after 2016.
  More than one-third of respondents in states where marijuana has been legalized the longest said inventory was tight
for multiple reasons and cited the marijuana industry as one of the factors. This is also true for those in areas where
marijuana was more recently legalized, as 23% of Realtors® also partially blamed the marijuana industry for the limited
inventory.
  “The dynamics of marijuana have been far-reaching over the past year, which is evident when you see how it has
impacted real estate,” said Jessica Lautz, vice president of demographics and behavioral insights for NAR. “As the
marijuana laws continue to evolve, Realtors® have witnessed increased demand for commercial properties to store, grow
and sell marijuana.”
  Additionally, 29% of commercial members in states that legalized recreational marijuana during the past four years
reported growth in property purchasing over leasing in the last year. Nearly half of those in states that legalized both
medical and recreational marijuana before 2016 have experienced addendums added to residential leases restricting
growing on properties, compared to one quarter or less in other states. Sixty-nine percent of commercial members in
states where only medical marijuana is lawful said that no additional addendums were inserted to their leases concerning
marijuana plants. This is compared to 45% to 55% of those where medical and recreational use are legal.
  Possibly in an effort to steer clear of landlord addendums, some business owners outright bought property rather than
leasing. In these cases, business owners no longer had to adhere to marijuana rules or regulations that they may have
considered burdensome. This trend was seen the most in states where marijuana is newly legal.
  Among respondents in states where recreational marijuana is legal, they more often answered that homeowner
associations regularly had some policies or restrictions in place pertaining to smoking and growing the product in
common areas or exposed areas. Nearly half of homeowner associations were against smoking in common areas, while
about two-fifths prohibited growing in mutual open areas, such as a private yard without fences.
  Those surveyed within states with only prescription marijuana said there often were not any homeowner association
rules and regulations related to marijuana.
  “We saw that a number of property owners at some point in the past had difficulty leasing their property after a
previous tenant consumed marijuana there over an extended period,” said Lautz. “To avoid repeats of those issues,
landlords have implemented various guidelines that place numerous restrictions on the use of marijuana.”
  Lautz says property owners who have imposed such constraints tend to reside or own property in states where
marijuana has been legal the longest.
   “As the marijuana industry evolves, both commercial and residential landlords are balancing efforts to profit from the
progressions, while also ensuring that their property remains desirable and at a high value,” Lautz continued.

Methodology
  The 2021 Marijuana and Real Estate survey was sent through email in March 2021 to a random sample of 75,000 NAR
members who practice residential real estate and 72,000 NAR members who practice commercial real estate. The survey
received 8,320 responses for an overall response rate of 5.7%.
         The National Association of Realtors® is America’s largest trade association, representing more than 1.4 million
members involved in all aspects of the residential and commercial real estate industries.

                                                                             ###

Information about NAR is available at www.nar.realtor. This and other news releases are posted in the newsroom under the “About NAR” tab. Statistical data in this
release, as well as other tables and surveys, are posted in the “Research and Statistics” tab.
12

                          L E G A L U P D AT E
                         BPE LAW GROUP PC
     ATTORNEY KEITH B. DUNNAGAN

                                               Amongst the fluctuating atmosphere of landlord tenant law during the COVID-19
                                            pandemic, today we will discuss the options available to property owners who want
                                            to take their properties off the rental market and sell them instead. These owners are
                                            faced with a maze of restrictions when it comes to terminating the tenancy of the tenant
                                            occupying the property. However, if done correctly, landlords can successfully evict their
                                            tenants despite the eviction moratorium currently in place in California.
                                               As many know, on January 29, 2021, the California legislature passed Senate Bill 91 which
                                            extended the state’s eviction moratorium through June 30, 2021. Under SB-91, a tenant
                                            may only be found guilty of an unlawful detainer for certain reasons which are listed in the
                                            law. Essentially, the law extends the “just cause” eviction requirements contained within
                                            the 2019 Tenant Protections and Relief Act to nearly all rental property owners. Typically,
                                            owners of single-family residences were not subject to this law and did not need to give
                                            a reason for terminating the tenancy of a tenant outside of a termed lease. Under SB-91,
                                            a property owner must give their tenant a notice of termination of tenancy that lists one
                                            of the “just cause” requirements found in the law in order for a Court to find that tenant
                                            guilty of an unlawful detainer if the tenant refuses to leave.
                                               Many landlords mistakenly assume that simply conveying their intent to sell the
                                            property will be enough to evict their tenant during the COVID eviction moratorium.
                                            Not quite. Pursuant to California Civil Code 1179.03.5, a tenant may be found guilty of an
     ATTORNEY LAURA FERRET

                                            unlawful detainer, even during the eviction moratorium, if the owner of the property has
                                            entered a contract for the sale of that property with a buyer who intends to occupy the
                                            property. Thus, the owner’s intent to sell is not enough, the property must be sold before
                                            the notice to terminate tenancy is issued.
                                               Notices to terminate tenancy under this section should follow the procedure set forth
                                            in California Civil Code 1946.1, which states that an owner may give a tenant a 30 day
                                            notice to terminate tenancy, regardless of the length of time the tenant has occupied the
                                            property, if all of the following apply: (1) The property is a single-family residence (2) The
                                            owner has contracted to sell the dwelling or unit to a bona fide purchaser for value, and
                                            has established escrow; (3) The purchaser is a natural person or persons; (4) The notice is
                                            given no more than 120 days after the escrow has been established; (5) The tenant has not
                                            previously been served with a notice to terminate tenancy based on the same reason; and
                                            (6) The purchaser in good faith intends to reside in the property for at least one full year
                                            after the termination of the tenancy.
                                               If the landlord follows the above procedure and the tenant does not leave voluntarily
                                            before the 30-day period expires, the landlord may ask the Court to find the tenant guilty
                                            of an unlawful detainer, even during the eviction moratorium.
                                               But, how does the landlord find a buyer for the property while the tenant still occupies
                                            it? The answer lies within a little-known provision of California Civil Code Section 1954(D)
                                            (2), which states that a landlord may give the tenant a 120-day notice of the landlord’s
                                            intent to sell the property. Once this notice is given, the landlord or their agent may enter
                                            the property upon a 24-hour notice for the purpose of showing the property to actual or
                                            prospective purchasers or their agents. Section 1954 usually only permits the landlord to
                                            enter the property during normal business hours (Monday through Friday 8AM to 5PM).
                                            However, California Courts have held that as a matter of law, landlords who use this notice
                                            are able to enter the property for the purpose of holding open houses on weekends,
                                            as hours during the weekend are normal business hours in the real estate industry. See
                                            Dromy v. Lukovsky, 219 Cal. App. 4th 278, 286 (2013).
                                               It is not known at this time whether the eviction moratorium currently in place through
                                            the end of June will be extended yet again. Real estate professionals assisting owners who
                                            want to take advantage of the current market conditions and sell their property quickly
                                            should take great care in ensuring that the proper notices are given to their tenants.
                                               The information presented in this article is not to be taken as legal advice. Every
                                            situation is different. If you are facing a legal issue of any kind, get competent legal advice
                                            in your state immediately so that you can determine your best options.
                                               The attorneys at BPE law are here to help. If you would like a consultation with us, please
                                            contact our office at 916-966-2260.
13

ETHICS CORNER

 Appropriate Interpretation of Standard of Practice 10-5 and Statement
 of Professional Standards Policy 29
 Standard of Practice 10-5 prohibits REALTORS® from using harassing speech, hate speech, epithets or slurs based
 on the protected classes of Article 10. Statement of Professional Standards Policy 29 provides that REALTORS® are
 subject to disciplinary action with respect to all of their activities.
   To assist Hearing Panels in the appropriate                             “Sexual Harassment” includes not only physical acts
 interpretation and application of Standard of Practice                  but also includes verbal and non-verbal/non-physical
 10-5 of the Code of Ethics and Statement of Professional                acts.
 Standards Policy 29, the Professional Standards                         Sexual harassment can be:
 Committee of the National Association provides the
 following for consideration by Hearing Panels when                      • Verbal: Sexual innuendoes, suggestive comments,
 asked to determine whether a violation of Article 10 as                   jokes of a sexual nature, sexual propositions, or
 supported by Standard of Practice 10-5 has occurred.                      threats.
   While the overall focus of Standard of Practice 10-5                  • Non-Verbal: Sexually suggestive objects or pictures,
 is on what might be loosely termed “offensive” or                         graphic commentaries, suggestive or insulting
 “discriminatory” speech, Hearing Panels should be clear                   sounds, leering, whistling, or obscene gestures. ...
 that the Standard of Practice is narrowly limited to                      Hearing Panels should look to this existing information
 conduct related to the requirements of equal professional               on harassment to determine whether harassing speech
 service of Article 10. Hearing Panels should also be fully              has occurred and then look to determine whether the
 aware of the nature and scope of the Standards of                       harassing speech was based on one of the protected
 Practice under Article 10 and their relationship to fair                classes.
 housing law as described in Appendix III to Part Four of                  In similar fashion, Merriam Webster’s Dictionary
 the Code of Ethics and Arbitration Manual. As described                 defines “hate speech,” “epithets,” and “slurs” as follows:
 in Appendix III, Article 10 and its Standards of Practice
 fully integrate the five basic fair housing obligations                   Hate Speech: speech that is intended to insult, offend,
 that were recognized by NAR’s Code of Fair Housing                      or intimidate a person because of some trait (as race,
 Practices before it was sunset.                                         religion, sexual orientation, national origin, or disability).
   Hearing Panels should note that while all of the                      Epithet: 1a: a characterizing word or phrase accompanying
 Standards of Practice under Article 10 inform them as                   or occurring in place of the name of a person or thing; b: a
 to the interpretation and application of Standard of                    disparaging or abusive word or phrase
 Practice 10-5, Standard of Practice 10-3 is particularly                Slur: 1a: an insulting or disparaging remark or innuendo:
 analogous in its application to discriminatory speech in                ASPERSION; b: a shaming or degrading effect: STAIN,
 advertising based on the protected classes of Article 10.               STIGMA
   Standard of Practice 10-5 is not focused on types of                    Again, Hearing Panels must look to whether the hate
 speech that might be subjectively deemed “offensive”                    speech, epithet or slur is based on race, color, religion,
 or “discriminatory” by one person and not another. The                  sex, handicap, familial status, national origin, sexual
 Standard of Practice is based on very particular types                  orientation or gender identity and not on some other
 of speech that are directly connected to the protected                  non-protected characteristic.
 classes of race, color, religion, sex, handicap, familial                 Under Statement of Professional Standards Policy
 status, national origin, sexual orientation or gender                   #29, REALTORS® are subject to the Code of Ethics’
 identity under Article 10. Only the use of harassing                    standards in all of their activities. Thus, a violation of
 speech, hate speech, epithets and slurs based on                        Article 10, as supported by Standard of Practice 10-5,
 the protected classes of Article 10 are prohibited.                     can occur when a REALTOR® uses harassing speech,
 The terms “harassing speech,” “hate speech,” “epithets,”                hate speech, epithets and slurs based on the protected
 and “slurs” can be commonly understood by use of a                      classes in any media or context, regardless of whether
 dictionary as well as other easily available references.                related to their activities in the real estate business or
   For example, NAR’s Code of Conduct and Anti-                          their identification as a REALTOR®.
 Harassment Policy clearly defines “harassment” and                        (Adopted 11/20)
 “sexual harassment.”
                                                                         NAR Code of Ethics & Arbitration Manual: Part
   Harassment includes inappropriate conduct, comment,                   4, Appendix XII — Appropriate Interpretation
 display, action, or gesture based on another person’s sex, color,       of Standard of Practice 10-5 and Statement of
 race, religion, national origin, age, disability, sexual orientation,   Professional Standards Policy 29
 gender identity, and any other protected characteristic.
   Examples of harassment include, but are not limited
 to: epithets, slurs or negative stereotyping; threatening,
 intimidating or hostile acts; denigrating jokes; and the
 display or circulation of written or graphic material that
 denigrates or shows hostility toward an individual or
 group based on a protected characteristic.
14

          G O V E R N M E N T W AT C H

                                          Please join us for C.A.R.’s first ever fully virtual
                                          Legislative Day!
     CARTER NELSON

                                            C.A.R. is hosting its first-ever, fully
                                          virtual Legislative Day on Tuesday, April
                                          27th and we encourage you to join
                                          other REALTORS® from the Sacramento
                                          Association of REALTORS® in participating.

                     Government Affairs      If you’ve ever been curious about
                     Coordinator          Legislative Day but couldn’t commit to
                                          going to Sacramento to experience it
                                          live, this is a great opportunity for you to
                                          take part without leaving home!
                                            Here are some of the highlights of the
                                          content for the day:

                                          • Hear from dynamic political leaders –
                                            Senate President Pro Tem Toni Atkins
                                            and Assembly Member Blanca Rubio.

                                          • Receive a state legislative update from C.A.R.’s Sr. Vice President of Government
                                            Affairs, Sanjay Wagle.

                                          • A Fireside Chat with Legendary Political Columnist Dan Walters and C.A.R. CEO
                                            Joel Singer

                                          • The State of California’s Housing Market: An Economic Update by C.A.R.’s Chief
                                            Economist, Jordan Levine.

                                          • Fair Housing Stories: Current Challenges and a Call to Action

                                          • Virtual Meetings with individual state legislators

                                           There will plenty more to see and do!

                                            Legislative Day is important because legislators hear from REALTORS® about
                                          how policies impact real estate in their hometowns. And it also demonstrates the
                                          strength of the REALTOR® army by showing them how many of us are committed
                                          to spending time advocating for our industry and homeownership. The more of us
                                          who participate in Legislative Day, we the stronger we all are!

                                          For more information: https://www.car.org/difference/getinvolved/LegislativeDay

                                          To register: https://whova.com/web/legis_202104/

                                          Please note – you will need your NRDS ID to register. If you’re unsure of it, here’s a
                                          link to look it up: http://on.car.org/nrdslookup

                                          For more information: https://www.car.org/difference/getinvolved/LegislativeDay

                                          If you have any questions, please reach us at legislativeday@car.org
15

M AY C A L E N D A R O F E V E N T S
                                                                                PLEASE NOTE:
  SAR Calendar Subject to Change. SAR will be reevaluating the COVID-19 situation month-to-month. Unless
                        otherwise noted, all meetings/classes will be held virtually.
                                      Thank you for understanding.
      Monday                                 Tuesday                                   Wednesday                                Thursday                                    Friday
                              3                                            4                                       5                                     6                                           7
                                             Main Meeting (V)
                                              9:00 – 10:30am
                                          CanTree Committee (V)
                                             10:30am – 12noon                                                                                                          SAR Staff Meeting (V)
                                                                                    TC2: Beyond the Contract (V)       Real Estate Finance & Affiliate Forum               7:30 – 8:30am
   WCR Board Meeting (V)                                                                  9:00am – 12noon                                (V)
     12noon – 1:30pm               Volunteer Coordinating Committee (V)
                                              10:30 – 11:30am                                                                      9:00 – 10:30am                       (SAR Offices Closed)
                                                                                  Masters Club: Tacos & Tiny Homes
                                      Charity Research Committee (V)                          (Offsite)                        RENE Certification (V)                SAR Toastmasters Club (V)
                                               1:00 – 2:00pm                               11:00 – 3:00pm                        9:00am – 4:00pm                          7:30am – 9:00am
                                              Intern Class (V)
                                               2:30 – 4:30pm

                              10                                           11                                    12                                     13                                           14
                                        Virtual Regional Meeting (V)
                                                  ZOOM LINK                                                            Masters Club Steering Committee (V)
   Education Committee (V)                      9:00 – 10:30am
        9:00 – 10:30am                                                                                                            9:30 – 11:00am
                                                                                  Unlocking Power with a Reverse
                                        YPN Advisory Committee (V)                        Mortgage (V)                 Hiring the Right Virtual Assistant (V)           SAR Toastmasters Club
                                            11:00am – 12:30pm                           11:00am – 12:30pm                         10:00 – 11:30am                          7:30am – 9:00am
   Leadership Academy (V)
        1:00 – 2:30pm                          Intern Class (V)                                                         Internship Committee (V) 12noon –
                                                2:30 – 4:30pm                                                                        1:30pm

                              17                                           18                                    19                                     20                                           21
                                         SRES Designation – Day 1 (V)
                                               9:00am – 1:00pm                        SRES Designation – Day 2
                                                                                                (V)
                                         Virtual Regional Meeting (V)                     9:00am – 1:00pm                    SRES Designation – Day 3
                                                  ZOOM LINK                                                                            (V)                            SAR Toastmasters Club (V)
     No Events Scheduled                                                         Estate Planning Basics and Beyond                                                         7:30am – 9:00am
                                                9:00 – 10:30am                                                                   9:00am – 1:00pm
                                                                                                 (V)
                                         Marketing/Communications                          10:00 – 11:00am              WCR Monthly Business Meeting (V)              SAR Affiliate Task Force (V)
                                              Committee (V)                                                                    11:30am – 2:00pm                             9:00 – 10:00am
                                              10:30am – 12noon                    SAR New Member Orientation (V)
                                                                                          6:00 – 9:30pm

                              24          Virtual Regional Meeting (V)
                                                   ZOOM LINK             25                                      26                                     27                                           28
                                                9:00 – 10:30am
                                         Cultural Diversity/Fair Housing
                                                 Committee (V)                  Staying Out of Court, Advanced Level
                                              10:30am – 12noon                               Disclosures                                                              SAR Toastmasters Club
                                                                                                 (V)                                SAR BOD (V)                          7:30am – 9:00am
     No Events Scheduled                  SAR Charitable Foundation                                                                9:00 – 10:30am
                                                   BOD (V)                                10:00 – 11:00am                                                       Real Estate Resource Meeting: Topic
                                                12:30 – 2:30pm                                                                                                                 TBD (V)
                                            Scholarship Fundraising                                                                                                        9:30 – 10:30am
                                                Committee (V)
                                                 1:00 – 2:00pm
                                                Intern Class (V)
                                                 2:30 – 4:30pm

                             31

  SAR Closed – Memorial Day
16

     S A R E D U C AT I O N A L O F F E R I N G S
      PLEASE NOTE: All in-person SAR classes have been suspended indefinitely. Please contact Marcus with any questions and check
      the calendar or our online education resource page for details.

     View https://education.sacrealtor.org for registration details
                               CLASS
                                                                                                           APRIL
      Visit https://education.sacrealtor.org for registration details

        22   10am – 12noon       SOCIAL MEDIA MARKETING STRATEGIES FOR REAL ESTATE PROS

       23    10am – 11:30am      PANEL OF SUCCESSFUL BROKERS

       27    11am – 12noon       HOW TO GET LEADS AND LISTINGS FROM ONE SIMPLE EMAIL

        28   9am – 2:30pm        FUNDAMENTALS OF TRANSACTION COORDINATION

                                 CLASS
                                                                                                                MAY
      Visit https://education.sacrealtor.org for registration details

        5    9am – 12:30pm       TRANSACTION COORDINATION 2: BEYOND THE CONTRACT

        6    9am – 4pm           REAL ESTATE NEGOTIATION EXPERT (RENE)

       12    11am – 12:30pm      UNLOCKING PURCHASING POWER WITH A REVERSE MORTGAGE

        13   10am – 11:30pm      HIRING THE RIGHT VIRTUAL ASSISTANT FOR YOUR BUSINESS

        18   9am – 1pm           SENIOR REAL ESTATE SPECIALIST (SRES) DESIGNATION COURSE

       21

        19   10am – 11am         ESTATE PLANNING: BASICS AND BEYOND

        26   10am – 11am         STAYING OUT OF COURT: ADVANCED LEVEL DISCLOSURES

        27   11:30am – 12:30pm SAR’S TOP FEMALE REALTORS® SHARE THEIR SECRETS TO SUCCESS
17

 ON DEMAND WEBINARS
 THESE WEBINARS WERE RECORDED AND CAN BE VIEWED AT YOUR LEISURE. PLEASE FEEL FREE TO BROWSE THE WHOLE COLLECTION.
 YOU CAN VIEW THE ENTIRE CATALOGUE HERE.

 RACE IN REAL ESTATE                                         WHAT BUSINESS STRUCTURE IS RIGHT FOR YOU?
 THIS CLASS LOOKS AT THE ISSUE OF RACE IN REAL ESTATE FROM   DISCOVER THE DIFFERENCES BETWEEN THE GENERAL
 A HISTORICAL PERSPECTIVE. HOW DID WE GET TO WHERE           PARTNERSHIP, LIMITED PARTNERSHIPS, AND CORPORATIONS
 WE ARE TODAY? WHAT ROLE DID NAR/C.A.R., THE FEDERAL         AND ALSO LOOK AT HOW PROFESSIONALS ARE NOW USING
 GOVERNMENT, LENDERS, AND THE INDIVIDUAL REALTOR PLAY?       A BLEND OF PARTNERSHIPS AND CORPORATE ENTITIES TO
 REGISTER/MORE INFO HERE                                     MANAGE AND OPERATE THEIR BUSINESSES.
                                                             REGISTER/MORE INFO HERE
 HOW TO GROW YOUR REAL ESTATE BUSINESS
 ONLINE                                                      BROADENING YOUR SCOPE & RUNNING A
 INSTRUCTOR ULYSSES BALTAZAR, REAL ESTATE TECHNOLOGIST       SUCCESSFUL BROKERAGE
 & MARKETING STRATEGIST WILL SHOW YOU “WHAT AND WHERE”
 DOES YOUR BRAND & INFORMATION ONLINE MATTER MOST.           LEARN HOW TO CREATE A CORE GROUP AROUND YOU, HOW TO
 REGISTER/MORE INFO HERE                                     GROW YOUR BROKERAGE, DEVELOP AN ENVIRONMENT THAT IS
                                                             COLLABORATIVE, AND THE 21 ECONOMIC FUNDAMENTALS.
                                                             REGISTER/MORE INFO HERE
 RUNNING A BROKERAGE FROM A LEGAL
 PERSPECTIVE
                                                             BRANDING YOURSELF 101
 THERE ARE MANY LEGAL RISKS TO RUNNING A BROKERAGE.
 LEARN ABOUT THE FEDERAL, STATE, AND LOCAL REGULATIONS       SOCIAL MEDIA STRATEGIST ULYSSES BALTAZAR WILL TEACH YOU
 YOU NEED TO KNOW IN ORDER TO STAY IN COMPLIANCE,            THE FOUNDATION AND ESSENTIALS REQUIRED FOR A PROPER
 INCLUDING RESPA, TRUST FUND HANDLING, LICENSING, SIGN       BRAND FOR YOUR REAL ESTATE PERSONA, TEAM, OR BROKERAGE.
 ORDINANCES, AND ADVERTISING.                                REGISTER/MORE INFO HERE
 REGISTER/MORE INFO HERE

                          Please View SAR’s online portal for latest updates/webinars.

            FREE TRAINING BY METROLIST®
  MetroList® has been offering
subscribers free online training, have
you taken advantage of this subscriber
benefit? There are multiple trainings per
day ranging from 30 to 60 minutes.
Check out their online catalogue to see
which topics are covered. Click this link
for more details and don’t forget to
bookmark it!

  Looking for an
  Affiliate or REALTOR®?
  Click Here to quickly find an Affiliate or REALTOR® by
  name or category with our convenient search engine!
18

     SAR NEW MEMBERS
     March 2021
     AFFILIALTES                         Samuel Briefman
                                         Redfin Corporation
                                                                             Jason Hernandez
                                                                             Real Estate Source, Inc.
                                                                                                              Adelle Reimer Plain
                                                                                                              eXp Realty of California, Inc.
     NONE                                Charlene Butler                     Joshua Hicks                     Margaret Reszczynski
                                         eXp Realty of California, Inc.      Alexis McGee Group, Inc.         Century 21 Select Real Estate
     BROKER ASSOCIATE                    Edgar Calderon
                                         Guzman Real Estate
                                                                             Tiffany Ho
                                                                             Portfolio Real Estate
                                                                                                              Carlos Reyes
                                                                                                              Opendoor Brokerage, Inc.
     Cheri Murphy
     Redfin Corporation                  Julia Carter                        Matthew Holland                  Ryan Rinauro
                                         All Professional Realty, Inc.       eXp Realty of California, Inc.   Realty One Group Complete
                                         Tania Caster                        Maleia Hopper                    Nancy Rojas Sanchez
     DESIGNATED REALTORS®                Redfin Corporation                  All City Homes                   Re/Max Gold Midtown
     Navid Ali                           Renlan Chen                         Cristofer Ignacio                Hugo Rolon
     Realty ONE Group Future             Grand Realty Group                  Redfin Corporation               Coldwell Banker Realty
     Paul Andrus                         Man Cheng                           Tudor Isachi                     David Rye
     Mission Peak Real Estate            Capital City Real Estate            Fathom Realty Group              Century 21 Select Real Estate
     Jeffrey Becker                      Aleksandr Chernenko                 Kathleen Jamieson                Christina Salas
     Jeff Becker Broker                  Realty One Group Complete           KW Vaca Valley                   eXp Realty of California, Inc.
     Jeffrey Kremsdorf                   Wang Cho                            Rafael Jauregui                  Nayra Santos Xavier Balmediano
     Jeffrey Ryan Kremsdorf              eXp Realty of California, Inc.      Opendoor Brokerage, Inc.         eXp Realty of California, Inc.
     Kito Lewis                          Lauren Cooc                         Crystal Jones                    Ninoska Sevilla
     KC Realty                           Portfolio Real Estate               Allison James Estates & Homes    Grand Avenue Realty & Lending
     Amy Pittard                         Maria Cortes                        Ashshajuanna Jones               Chandeep Singh
     KW Vaca Valley                      Keller Williams Realty Natomas      Intrust Realty Group             Keller Williams Realty
     Gregory Reaume                      Robin Craft                         Michael Kaldani                  Douglas Skarr
     Gregory Reaume                      GTC Brokerage                       Redfin Corporation               Opendoor Brokerage, Inc.
     Kyle Wilkins                        Rachel Craft                        Erin Kennedy                     Miguel Solorio Abarca
     Universal Lending and Real Estate   Redfin Corporation                  Coldwell Banker Realty           eXp Realty of California, Inc.
                                         Shannon Culler                      Stephen Kroes                    Steve Stone
                                         Vista Oaks Realty                   Keller Williams Realty So Plac   Coldwell Banker Realty

     REALTORS®                           Xinpeng Dai
                                         Grand Realty Group
                                                                             Queenie Kurmis
                                                                             Amen Real Estate
                                                                                                              Jared Stutzman
                                                                                                              Redfin Corporation
     Djamel Adja                         Tiffanny Dang                       Yosuf Kushan
     Keller Williams Realty Natomas                                                                           Toktam Tayefeh
                                         Portfolio Real Estate               Liberty Realty Company           California Regency Realty
     Morgan Albanese                     Love Juliet Darer                   Jefferson Kwong
     John Scott Palmer Real Estate       Capital Group Realty, Inc.          Fathom Realty Group
                                                                                                              Michelle Thach
     John Alcantara
                                                                                                              Portfolio Real Estate
                                         Shayna Davis                        Nging Lau
     RE/MAX Gold Elk Grove               RE/MAX Gold Natomas                 Grand Realty Group               Avneet Toor
     William Alexander                                                                                        Direct Realty and Mortgage
                                         Edward Day                          Briana Love
     Berkshire Hathaway Homeservice      Alexis McGee Group, Inc.            eXp Realty of California, Inc.   Volha Trapashka
     Salem Alyafeai                      Dawn Diehl                          Andres Madrigal
                                                                                                              Nick Sadek Sotheby’s International
     Redfin Corporation                  Chase International                 eXp Realty of California, Inc.   Samuel Trigeiro
     Ann-Marie Attaie                    Shimei Duan                         Luz Magana Pulido                LTC Corporation
     RE/MAX Gold Sierra Oaks             Berkshire Hathaway HS Elite         Better Homes and Gardens RE      Kyle Van Dusen
     Carrie Avila                        Anna Duguid                         Caitlin McGarry                  Redfin Corporation
     Lyon RE Sierra Oaks                 Redfin Corporation                  Peter Parker Realty
                                                                                                              Keith Venneman
     Katina Barrera Downs-Naivalu
     Exquisite Real Estate, Inc.
                                         Stephen Duvall                      Daniel McMahon                   The Turtlestone Group Corp
                                         eXp Realty of California, Inc.      Lyon RE LP
     Esther Becker                                                                                            Elias Wahbeh
                                         Tammy Ellis                         Louis Miqueo                     Metropolitan R.E. & Develop.
     Jeff Becker Broker                  Burke Realty Group, Inc.            Redfin Corporation
     Kari Benton                                                                                              Kaci Walsh
                                         Jacob Falkenberg                    Alana Miyake
     Alexis McGee Group, Inc.            Tower Realty                        Better Homes and Gardens RE      Redfin Corporation
     Jennibe Bentulan                    Steven Flynn                        Stevie Mobley                    Philip Welch
     Keller Williams Realty Natomas      Keller Williams Realty So. Placer   Carlile Realty & Lending         Lyon RE Sierra Oaks
     Victor Betancourt                   Dominique Fortson                   Marques Morgan                   Leo Williams
     Opendoor Brokerage, Inc.            Premier Agent Network               Bryant Gonzalez Real Estate      Williams Landmark Real Estate
     Deana Biorn                         Tatevik Gasparyan                   Elizabeth Nguyen                 Zhibin Wu
     Massey Advantage, Inc.              Lyon RE Sierra Oaks                 Berkshire Hathaway HS Elite      Grand Realty Group
     Cherelle Bluford Craving            Nicole Gomez                        Greta Ossman
     Keller Williams Realty Natomas      Keller Williams Realty Folsom       Realty One Group Complete
                                                                                                              Brett Wyant
     Austen Bonner
                                                                                                              Consumer Plus Realty
                                         Johnathon Gonzalez                  Katherine Phillips
     Keller Williams Realty Natomas      Keller Williams Realty Natomas      eXp Realty of California, Inc.   Isabella Young
     Clarke Boomhower                    Dana Harward                        Linda Price                      Better Homes and Gardens RE
     eXp Realty of California, Inc.      Keller Williams Realty Natomas      eXp Realty of California, Inc.
     Lisa Boren                          Min Yi He                           Gerben Pulmano
     Keller Williams Realty Natomas      Sacramento Realty Services, Inc.    Realty One Group Complete
     Amy Brand                           Geoffrey Heath                      Viktor Ramos
     Century 21 Select Real Estate       eXp Realty of California, Inc.      Curve Real Estate
19

SM
 A CE RMABME R
             E NOTFO THHOE UMS O
                               I NNGT HS TAT I S T I C S
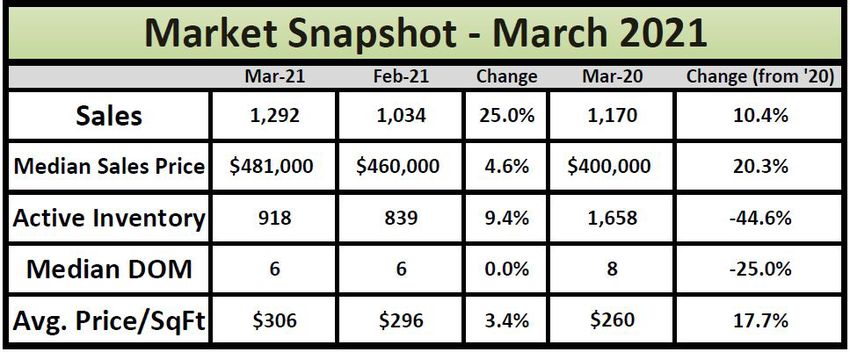
Sales volume up 25% over
Feb., sales price over $480k
   March closed with 1,292 sales, up 25% from the 1,034 sales
in February. Compared to one year ago (1,170), the current
                                                                                                            MARCH
figure is up 10.4%. Of the 1,292 sales this month, 161 (12.5%)
used cash financing, 920 (71.2%) used conventional, 134
(10.4%) used FHA, 41 (3.2%) used VA and 36 (2.8%) used
Other† types of financing.
   The median sales price increased 4.6% from $460,000 to
$481,000. This figure is up 20.3% from March 2020 ($400,000).
   The Active Listing Inventory increased 9.4% from February
to March, from 839 units to 918 units. Compared with
March 2020 (1,658), inventory is down 44.6%. The Months of
Inventory decreased from .8 Months to .7 Months. This figure
represents the amount of time (in months) it would take
for the current rate of sales to deplete the total active listing
inventory. The chart below reflects the Months of Inventory in
each price range.
   The Median DOM (days on market) remained at 6 and the
Average DOM decreased from 15 to 13. “Days on market”
represents the days between the initial listing of the home as
“active” and the day it goes “pending.” Of the 1,292 sales this
month, 91.2% (1,178) were on the market for 30 days or less
and 96.5% (1,246) were on the market for 60 days or less.
   The Average Price/SqFt of all homes sold increased from
$296 to $306. See all statistical reports compiled by the
Sacramento Association of REALTORS®.

 The Sacramento Association of REALTORS® is a professional association representing over 6,500 real
 estate professionals and commercial affiliates doing business in the greater Sacramento metropolitan
 area. All SAR statistics reports compiled by Tony Vicari, SAR Director of Communications. Statistics are
 derived from the MetroList® MLS database for Sacramento County and the City of West Sacramento.
 †Other financing includes 1031 exchange, CalVet, Farm Home Loan, Owner Financing, Contract of Sale
 or any combination of one or more.
20

     M L S S TAT I S T I C S

         March 2021
                                                                                                                   MLS STATISTICS for March 2021
                                                                                     Data for Sacramento County and the City of West Sacramento

          SINGLE FAMILY HOME RESALES
          Monthly Statistics                                                         Current Month                       % of
                                                                                                                         Total
                                                                                                                                                       Last Month          Change   % of
                                                                                                                                                                                    Total
                                                                                                                                                                                                         Last Year % of Total
                                                                                                                                                                                                                        Sales
                                                                                                                                                                                                                                   Change

                                                                                                                         Sales                                                      Sales
          Listings Published this Month                                                                    1,851                                               1,392       33.0%                            1,755                      5.5%
          Active Listing Inventory †                                                                         918                                                839        9.4%                             1,658                  -44.6%
          Pending Sales This Month*                                                                        1,843                                               1,560       18.1%                            1,498                      23.0%
          Number of REO Sales                                                                                     5 0.4%                                          4         25%     0.4%                       10         0.9%     -50.0%
          Number of Short Sales                                                                                   5 0.4%                                          2        150%     0.2%                        3         0.3%         66.7%
          Equity Sales                                                                                     1,282 99.2%                                         1,028       24.7% 99.4%                      1,157       98.9%          10.8%
          Other (non-REO/-Short Sale/-Equ                                                                         0 0.0%                                          0         0%      0.0%                        0    0.0%               N/A
          Total Number of Closed Escrows                                                                   1,292 100%                                          1,034       25.0%    100%                    1,170    100.0%            10.4%
          Months Inventory                                              M                    0.7 Months                         0.7                  0.8 Months 0.8        -12.5% Months               1.4 Months 1.4              -50.0%
          Dollar Value of Closed Escrows                                               $674,955,443                                             $520,087,566               29.8%                  $508,086,069                         32.8%
          Median                                                                                $481,000                                                    $460,000       4.6%                          $400,000                      20.3%
          Mean                                                                                  $522,411                                                    $502,986       3.9%                          $434,262                      20.3%

          Year-to-Date Statistics                                        1/01/21 to 3/31/21                                        1/01/21 to 3/31/21                                                    1/1/2020
                                                          SAR monthly data, compiled                                                   MetroList YTD data                                              3/31/2020                       Change
          Number of Closed Escrows                                                                         3,380                                               3,411                                        3,128                      8.1%
          Dollar Value of Closed Escrows                                             $1,708,453,849 4,672                                     $1,722,029,079                                   $1,328,760,006                          28.6%
          Median                                                                                $461,990 ######                                             $461,990                                     $388,000                      19.1%
          Mean                                                                                  $505,460
                                                                                              $2,383,409,292
                                                                                                                                                            $504,846                                     $424,795                      19.0%

                                                                                                    Sales Volume vs Inventory Volume
           3,500                                                                                                                                                                                                                       1,292
                                            1,767
           3,000 1,131
                                                                                                                                       2,362
                                                                                                    1,015                                            1,693                                  1,775
           2,500                                                                                              1,994                                                         1,014              1,506
                                            1,724                                                                                                                  1,242            1,422
           2,000                                                                                                                                                                                                                           918
           1,500
                                                                                                                                                                                                             1,253959
           1,000                                                                                                                                                                                                           735   719

             500

                0
                    Feb. Mar. Apr. May June July Aug. Sept. Oct. Nov. Dec. Jan. Feb. Mar. Apr. May June July Aug. Sept. Oct. Nov. Dec. Jan. Feb. Mar. Apr. May June July Aug. Sept. Oct. Nov. Dec. Jan. Feb. Mar.
                                                                                                                                              2019                                                2020                             2021

                                                   Median Sales Price                                                                                                            Sacramento County Statistics
            $500,000                                                                                                                                                                   brought to you by:
            $480,000
            $460,000
            $440,000
            $420,000
            $400,000
            $380,000
            $360,000
            $340,000
            $320,000
            $300,000
                                                   Nov.

                                                                                             Nov.

                                                                                                                                       Nov.
                       Mar.

                                                                 Mar.

                                                                                                           Mar.

                                                                                                                                                     Mar.
                              May
                                    July

                                                                        May
                                                                              July

                                                                                                                  May
                                                                                                                        July
                                           Sept.

                                                                                     Sept.

                                                                                                                               Sept.
                                                          Jan.

                                                                                                    Jan.

                                                                                                                                              Jan.

                                                                            2019                                  $0    20                       21

          † includes: Active, Contingent - Show, Contingent - No Show listings
           * The method for retrieving Pending Sales from MetroList© was updated for April 2019. Pending sales are are now counted at a single point in time at the beginning of the month rather than by entering the date
          range of the month in question. This new method will now include any listings that have the status of "pending" in MetroList©.
                                                                                 Based on Multiple Listing Service data from MetroList© | 2021 SAR
                                          Compiled monthly by Tony Vicari, Director of Communications | Sacramento Association of REALTORS® | www.sacrealtor.org | 916.437.1205
21

 Data for Sacramento County and the City of West Sacramento
                                                                                                                                                  MLS STATISTICS for March 2021
                                                                                        Data for Sacramento County and the City of West Sacramento
                                                             BREAKDOWN OF SALES BY PRICE                                                                                                                                                                                                  Type of Financing/Days on Market

                                                                                            1 House on Lot                                                                                                       Total:                              1,292                                               TYPE OF FINANCING
                                                                                                                                                                                                                                                                                                                (1 House on Lot)
                                                                                                                                                                                                                                                                                                FHA              Other †                      Cash
                                                                                                                                                                                                                                                                                                    VA
                                                                                                                                                                                                                                                                                                10%                3%                         13%
                                                                                                                                                                                                                                                                                                    3%
                                                                                                                                                                                                                          488

                                                                                                                                                                         197                    170
                                                                                                                                                   165
              0                       1                    4                       13                  43                       97                                                                                                              76                     38

                                                                                                                                                                                                                                                                                                                             Conventional
                                                                                                                                                                                                                                                                                                                                 71%

                                                                     Types of Financing Historical                                                                                                                                                                                                           DAYS ON MARKET
                                                                                                                       (% of Sales)                                                                                                                                                                             (1 House on Lot)
                                                                                                                                                                                                                                                                                                     91 - 120 Days          121 - 180 Days
                                                Cash                                        Conventional                                                     FHA                                    VA                                      Other
                                                                                                                                                                                                                                                                                                           1%                     1%
  70.0%
  65.0%                                                                                                                                                                                                                                                                                       61 - 90 Days
                                                                                                                                                                                                                                                                                                                                         181+ Days
  60.0%                                                                                                                                                                                                                                                                                            1%
                                                                                                                                                                                                                                                                                                                                            1%
  55.0%
  50.0%
  45.0%
  40.0%
  35.0%                                                                                                                                                                                                                                                                                          31 - 60 Days
  30.0%                                                                                                                                                                                                                                                                                               5%
  25.0%
  20.0%
  15.0%
  10.0%
   5.0%
   0.0%
           Jun-11

                             Feb-12
                                      Jun-12

                                                        Feb-13
                                                                 Jun-13

                                                                                   Feb-14
                                                                                            Jun-14

                                                                                                              Feb-15
                                                                                                                       Jun-15

                                                                                                                                         Feb-16
                                                                                                                                                  Jun-16

                                                                                                                                                                    Feb-17
                                                                                                                                                                             Jun-17

                                                                                                                                                                                               Feb-18
                                                                                                                                                                                                        Jun-18

                                                                                                                                                                                                                          Feb-19
                                                                                                                                                                                                                                   Jun-19

                                                                                                                                                                                                                                                     Feb-20
                                                                                                                                                                                                                                                              Jun-20

                                                                                                                                                                                                                                                                                Feb-21
                    Oct-11

                                               Oct-12

                                                                          Oct-13

                                                                                                     Oct-14

                                                                                                                                Oct-15

                                                                                                                                                           Oct-16

                                                                                                                                                                                      Oct-17

                                                                                                                                                                                                                 Oct-18

                                                                                                                                                                                                                                            Oct-19

                                                                                                                                                                                                                                                                       Oct-20

                                                                                                                                                                                                                                                                                                                                0 - 30 Days
                                                                                                                                                                                                                                                                                                                                    91%

Type of Financing                                                                   Current Month                                                             Previous Month                                                                                                             LENGTH OF TIME ON MARKET
                                                                                                                                                                                                                                                                                                                            % of Total
(Single Family Home only)                                                           # of                                 % of                                 # of                                      % of                                (Single Family Only)                             # of            Current          Last 4            Last 12
Financing Method                                                                    Units                                Total                                Units                                     Total                                    Days on Market                              Units            Month          Months             Months
Cash                                                                                 161                               12.5%                                   140                                 13.5%                                                      0 - 30                        1,178               91.2%         87.6%              83.5%
Conventional                                                                         920                               71.2%                                   712                                 68.9%                                                 31 - 60                              68                5.3%          7.8%                   9.7%
FHA                                                                                  134                               10.4%                                   118                                 11.4%                                                 61 - 90                              18                1.4%          2.5%                   3.6%
VA                                                                                    41                                 3.2%                                   43                                      4.2%                                           91 - 120                               14                1.1%          1.1%                   1.7%
Other †                                                                               36                                 2.8%                                   21                                      2.0%                                         121 - 180                                 8                0.6%          0.5%                   1.0%
Total                                                                              1,292                               100.0%                                1,034                               100.0%                                                       181+                             6                0.5%          0.5%                   0.6%
                                                                                                                                                                                                                                                              Total                         1,292             100.0%         100.0%              100.0%
                                                                                                                                                                                                                                                                                                                             Current           Last Month
 † includes: cal vet, contract of sale, creative, farm home loan, owner                                                                                                                                                                                             Median DOM:                                                6                  6
financing.                                                                                                                                                                                                                                                         Average DOM:                                               13                  15
                                                                                                                                                                                                                                                              Average Price/Square Foot:                                    $306.3              $296.2

 This representation is based in whole or in part on data supplied by MetroList. MetroList does not guarantee, nor is it in any way responsible for, its accuracy. Data maintained by MetroList does
    not reflect all real estate activity in the market. All information provided is deemed reliable, but it is not guaranteed and should be independently verified. For the most current statistical
                                                                                                          information, visit https://www.sacrealtor.org/consumers/housing-statistics.

                                                                                                                                         Based on Multiple Listing Service data from MetroList© | 2021 SAR
                       Compiled monthly by Tony Vicari, Director of Communications | Sacramento Association of REALTORS® | www.sacrealtor.org | 916.437.1205
22
     SACRAMENTO ASSOCIATION OF REALTORS®
                                                        Sacramento Association of REALTORS®
     SINGLE FAMILY HOME SALESSingle
                              BY ZIPFamilyCODE
                                           Home Sales by ZIP CODE
                                                                     March 2021
                                                                                                     MARCH 2021
          Zip Code                                          Current Month      Sales Breakdown       Last Month    Last Year   Year‐to‐Date
                                                                                   (by type)
                         Total Sales                                   52      REO Sales 0                   45           53             135
                         Median Sales Price                     $562,500                  $0          $495,000     $447,000        $510,500
           95608         Average Price/Square Foot                  $303      Short Sales 0               $308         $265             N/A
         Carmichael      Average Sq Ft of Property                 2,044                  $0             1,828        2,058             N/A
                         Total Listing Inventory *                     54   Conventional 52                  32           79            N/A
                         Total Listing Median Price ∞           $600,000            Sales $562,500    $858,013     $539,000             N/A

                         Total Sales                                   33      REO Sales 0                   18           23              77
                         Median Sales Price                     $460,000                  $0          $470,500     $411,000        $450,000
            95610        Average Price/Square Foot                  $305      Short Sales 0               $275         $243             N/A
        Citrus Heights   Average Sq Ft of Property                 1,665                  $0             1,889        1,720             N/A
                         Total Listing Inventory *                     38   Conventional 33                  19           42            N/A
                         Total Listing Median Price ∞           $452,250            Sales $460,000    $567,831     $411,950             N/A

                         Total Sales                                   42      REO Sales 1                   32           33             101
                         Median Sales Price                     $426,250                  $436,000    $412,250     $357,000        $415,000
            95621        Average Price/Square Foot                  $297      Short Sales 0               $289         $242             N/A
        Citrus Heights   Average Sq Ft of Property                 1,476                  $0             1,557        1,535             N/A
                         Total Listing Inventory *                     29   Conventional 41                  18           33            N/A
                         Total Listing Median Price ∞           $420,500            Sales $423,500    $433,771     $351,178             N/A

                         Total Sales                                   70      REO Sales 0                    43          41             150
                         Median Sales Price                     $575,508                  $0          $547,500     $450,000        $544,250
            95624        Average Price/Square Foot                  $281      Short Sales 0                $283        $240             N/A
          Elk Grove      Average Sq Ft of Property                 2,278                  $0              2,135       2,055             N/A
                         Total Listing Inventory *                     38   Conventional 70                   43          65            N/A
                         Total Listing Median Price ∞           $649,950            Sales $575,508   $1,417,135    $549,900             N/A

                         Total Sales                                    6      REO Sales 0                    4            1              16
                         Median Sales Price                     $705,000                  $0          $433,000     $298,000        $420,750
           95626         Average Price/Square Foot                  $307      Short Sales 0               $323         $276             N/A
           Elverta       Average Sq Ft of Property                 2,125                  $0             1,323        1,080             N/A
                         Total Listing Inventory *                      2   Conventional 6                    4            4            N/A
                         Total Listing Median Price ∞           $368,000            Sales $705,000    $539,626     $337,500             N/A

                         Total Sales                                   46      REO Sales 0                   34           52             118
                         Median Sales Price                     $608,625                  $0          $564,000     $480,848        $583,500
           95628         Average Price/Square Foot                  $290      Short Sales 0               $297         $275             N/A
          Fair Oaks      Average Sq Ft of Property                 2,214                  $0             2,071        1,987             N/A
                         Total Listing Inventory *                     42   Conventional 46                  39           81            N/A
                         Total Listing Median Price ∞           $669,500            Sales $608,625    $712,297     $589,000             N/A

                         Total Sales                                   82      REO Sales 0                   51           51             189
                         Median Sales Price                     $652,399                  $0          $650,000     $595,000        $635,500
            95630        Average Price/Square Foot                  $337      Short Sales 0               $333         $302             N/A
           Folsom        Average Sq Ft of Property                 2,164                  $0             2,117        2,177             N/A
                         Total Listing Inventory *                     46   Conventional 82                  51           92            N/A
                         Total Listing Median Price ∞           $825,000            Sales $652,399    $849,526     $649,000             N/A

                         Total Sales                                   28      REO Sales 0                    22          30              75
                         Median Sales Price                     $449,000                  $0          $433,500     $455,000        $485,000
           95632         Average Price/Square Foot                  $293      Short Sales 0                $272        $246             N/A
            Galt         Average Sq Ft of Property                 1,729                  $0              1,710       1,967             N/A
                         Total Listing Inventory *                     20   Conventional 28                   10          44            N/A
                         Total Listing Median Price ∞           $499,000            Sales $449,000   $1,207,301    $480,000             N/A

                         Total Sales                                    2      REO Sales 0                    1            0               5
                         Median Sales Price                     $667,500                  $0          $708,000           $0        $710,000
           95638         Average Price/Square Foot                  $379      Short Sales 0               $309            $0               0
           Herald        Average Sq Ft of Property                 1,754                  $0             2,292            0             N/A
                         Total Listing Inventory *                      1   Conventional 2                    1            4            N/A
                         Total Listing Median Price ∞           $719,000            Sales $667,500    $500,000     $522,450             N/A

                         Total Sales                                    3      REO Sales 1                    1            0               5
                         Median Sales Price                     $307,568                  $307,568    $375,000           $0        $375,000
            95641        Average Price/Square Foot                  $325      Short Sales 0               $293            $0            N/A
           Isleton       Average Sq Ft of Property                 1,421                  $0             1,280            0             N/A
                         Total Listing Inventory *                      5   Conventional 2                    5           13            N/A
                         Total Listing Median Price ∞           $402,500            Sales $605,200    $983,984     $343,000             N/A

                         Total Sales                                    4      REO Sales 0                    3            3              12
                         Median Sales Price                     $482,500                  $0          $470,000     $361,000        $470,000
           95655         Average Price/Square Foot                  $298      Short Sales 0               $255         $274             N/A
           Mather        Average Sq Ft of Property                 1,750                  $0             2,085        1,355             N/A
                         Total Listing Inventory *                      0   Conventional 4                    2            1            N/A
                         Total Listing Median Price ∞                 $0            Sales $482,500    $394,996     $595,000             N/A

                         Total Sales                                   29      REO Sales 1                   27           25              81
                         Median Sales Price                     $330,000                  $249,000    $340,000     $285,000        $330,000
           95660         Average Price/Square Foot                  $305      Short Sales 0               $289         $243             N/A
       North Highlands   Average Sq Ft of Property                 1,102                  $0             1,168        1,206             N/A
                         Total Listing Inventory *                     15   Conventional 28                  21           24            N/A
                         Total Listing Median Price ∞           $340,000            Sales $331,625    $354,259     $285,000             N/A

                         Total Sales                                   39      REO Sales 0                   30           35              96
                         Median Sales Price                     $470,000                  $0          $482,500     $435,000        $469,500
           95662         Average Price/Square Foot                  $315      Short Sales 2               $318         $285             N/A
         Orangevale      Average Sq Ft of Property                 1,725                  $437,500       1,788        1,672             N/A
                         Total Listing Inventory *                     32   Conventional 37                  20           36            N/A
                         Total Listing Median Price ∞           $559,750            Sales $499,000    $718,997     $520,000             N/A
23
                                                 Sacramento Association of REALTORS®
                                                Single Family Home Sales by ZIP CODE
                                                              March 2021

   Zip Code                                          Current Month       Sales Breakdown         Last Month    Last Year   Year‐to‐Date
                                                                              (by type)
                 Total Sales                                    49       REO Sales 0                     34           46             117
                 Median Sales Price                      $455,000                   $0            $469,000     $405,000        $455,000
    95670        Average Price/Square Foot                   $316       Short Sales 0                 $288         $256             N/A
Rancho Cordova   Average Sq Ft of Property                  1,614                   $0               1,740        1,712             N/A
                 Total Listing Inventory *                      26    Conventional 49                    22           43            N/A
                 Total Listing Median Price ∞            $430,000             Sales $455,000      $467,872     $399,700             N/A

                 Total Sales                                    10       REO Sales 0                     10           17              32
                 Median Sales Price                      $380,000                   $0            $345,000     $334,965        $355,000
    95673        Average Price/Square Foot                   $291       Short Sales 1                 $306         $242             N/A
   Rio Linda     Average Sq Ft of Property                  1,451                   $299,250         1,351        1,539             N/A
                 Total Listing Inventory *                       7    Conventional 9                      9            8            N/A
                 Total Listing Median Price ∞            $470,000             Sales $385,000      $447,212     $349,950             N/A

                 Total Sales                                    16       REO Sales 0                     16           14              41
                 Median Sales Price                      $593,450                   $0            $615,000     $527,500        $595,000
    95683        Average Price/Square Foot                   $262       Short Sales 0                 $272         $229             N/A
Rancho Murieta   Average Sq Ft of Property                  2,236                   $0               2,655        2,328             N/A
                 Total Listing Inventory *                      10    Conventional 16                    14           37            N/A
                 Total Listing Median Price ∞            $789,878             Sales $593,450      $730,394     $639,000             N/A

                 Total Sales                                     0       REO Sales 0                      0            1                0
                 Median Sales Price                            $0                   $0                  $0     $429,000               $0
   95690         Average Price/Square Foot                      $0      Short Sales 0                    $0        $291              N/A
Walnut Grove     Average Sq Ft of Property                      0                   $0                   0        1,472              N/A
                 Total Listing Inventory *                       3    Conventional 0                      3            1             N/A
                 Total Listing Median Price ∞            $965,000             Sales $0            $415,003     $868,888              N/A

                 Total Sales                                      5      REO Sales 0                       2           7              11
                 Median Sales Price                     $1,100,000                  $0            $904,500     $749,000        $784,000
    95693        Average Price/Square Foot                    $304      Short Sales 0                  $324        $294             N/A
    Wilton       Average Sq Ft of Property                   3,673                  $0                3,145       1,803             N/A
                 Total Listing Inventory *                        9   Conventional 5                       6          19            N/A
                 Total Listing Median Price ∞            $832,700             Sales $1,100,000   $1,022,992    $900,000             N/A

                 Total Sales                                    32       REO Sales 0                     19           19              66
                 Median Sales Price                      $560,000                   $0            $540,000     $493,000        $540,000
    95742        Average Price/Square Foot                   $243       Short Sales 0                 $244         $214             N/A
Rancho Cordova   Average Sq Ft of Property                  2,381                   $0               2,229        2,378             N/A
                 Total Listing Inventory *                       4    Conventional 32                    12           55            N/A
                 Total Listing Median Price ∞            $569,450             Sales $560,000      $539,866     $479,000             N/A

                 Total Sales                                    21       REO Sales 0                     25           35              80
                 Median Sales Price                      $565,000                   $0            $638,000     $540,166        $591,000
    95757        Average Price/Square Foot                   $279       Short Sales 0                 $285         $222             N/A
  Elk Grove      Average Sq Ft of Property                  2,157                   $0               2,520        2,559             N/A
                 Total Listing Inventory *                      14    Conventional 21                    14           54            N/A
                 Total Listing Median Price ∞            $585,000             Sales $565,000      $560,320     $538,950             N/A

                 Total Sales                                    44       REO Sales 0                     45           42             130
                 Median Sales Price                      $500,000                   $0            $495,000     $417,000        $495,000
    95758        Average Price/Square Foot                   $303       Short Sales 0                 $273         $248             N/A
  Elk Grove      Average Sq Ft of Property                  1,878                   $0               1,867        1,767             N/A
                 Total Listing Inventory *                      29    Conventional 44                    26           68            N/A
                 Total Listing Median Price ∞            $508,894             Sales $500,000      $554,811     $429,000             N/A

                 Total Sales                                     5       REO Sales 0                      3            2              12
    95811        Median Sales Price                      $680,500                   $0            $745,000     $832,000        $752,500
                 Average Price/Square Foot                   $401       Short Sales 0                 $413         $489             N/A
  Midtown/       Average Sq Ft of Property                  2,344                   $0               1,740        1,750             N/A
  Downtown       Total Listing Inventory *                      12    Conventional 5                      7            2            N/A
                 Total Listing Median Price ∞            $749,450             Sales $680,500      $695,898     $772,000             N/A

                 Total Sales                                     4       REO Sales 0                      3            3              13
                 Median Sales Price                      $565,000                   $0            $564,990     $594,990        $565,899
    95814        Average Price/Square Foot                   $296       Short Sales 0                 $364         $374             N/A
  Downtown       Average Sq Ft of Property                  2,037                   $0               1,610        1,633             N/A
                 Total Listing Inventory *                       1    Conventional 4                      2            5            N/A
                 Total Listing Median Price ∞            $800,000             Sales $565,000      $614,986     $689,990             N/A

                 Total Sales                                    26       REO Sales 0                     22           21              71
     95815       Median Sales Price                      $332,500                   $0            $332,500     $235,000        $310,000
   Woodlake      Average Price/Square Foot                   $265       Short Sales 0                 $282         $232             N/A
    Noralto      Average Sq Ft of Property                  1,308                   $0               1,161        1,073             N/A
S. Hagginwood    Total Listing Inventory *                       9    Conventional 26                    15           20            N/A
                 Total Listing Median Price ∞            $299,500             Sales $332,500      $347,653     $274,000             N/A

                 Total Sales                                    12       REO Sales 0                     12            6              37
    95816        Median Sales Price                      $601,599                   $0            $589,525     $594,000        $610,000
                 Average Price/Square Foot                   $508       Short Sales 0                 $483         $427             N/A
Midtown/East     Average Sq Ft of Property                  1,527                   $0               1,451        1,412             N/A
 Sacramento      Total Listing Inventory *                      21    Conventional 12                    18           18            N/A
                 Total Listing Median Price ∞            $774,000             Sales $601,599      $843,275     $681,500             N/A

    95817        Total Sales                                    16       REO Sales 0                     11            9              40
                 Median Sales Price                      $461,500                   $0            $489,000     $379,000        $440,000
   Elmhurst
                 Average Price/Square Foot                   $380       Short Sales 0                 $403         $342             N/A
  Med Center     Average Sq Ft of Property                  1,311                   $0               1,175        1,218             N/A
 North/Central   Total Listing Inventory *                      16    Conventional 16                     8           21            N/A
   Oak Park      Total Listing Median Price ∞            $479,950             Sales $461,500      $456,738     $395,000             N/A
You can also read