RANKING-ENHANCED UNSUPERVISED SENTENCE REP-RESENTATION LEARNING
←
→
Page content transcription
If your browser does not render page correctly, please read the page content below
Under review as a conference paper at ICLR 2023

R ANKING -E NHANCED U NSUPERVISED S ENTENCE R EP -
RESENTATION L EARNING

 Anonymous authors
 Paper under double-blind review

                                                A BSTRACT

             Previous unsupervised sentence embedding studies have focused on data augmen-
             tation methods such as dropout masking and rule-based sentence transformation
             methods. However, these approaches have a limitation of controlling the fine-
             grained semantics of augmented views of a sentence. This results in inadequate
             supervision signals for capturing a semantic similarity of similar sentences. In this
             work, we found that using neighbor sentences enables capturing a more accurate
             semantic similarity between similar sentences. Based on this finding, we propose
             RankEncoder, which uses relations between an input sentence and sentences in
             a corpus for training unsupervised sentence encoders. We evaluate RankEncoder
             from three perspectives: 1) the semantic textual similarity performance, 2) the
             efficacy on similar sentence pairs, and 3) the universality of RankEncoder. Experi-
             mental results show that RankEncoder achieves 80.07% Spearman’s correlation, a
             1.1% absolute improvement compared to the previous state-of-the-art performance.
             The improvement is even more significant, a 1.73% improvement, on similar sen-
             tence pairs. Also, we demonstrate that RankEncoder is universally applicable to
             existing unsupervised sentence encoders. 1

1       I NTRODUCTION

Unsupervised sentence encoders aim to overcome limited labeled data using a contrastive learning
framework with data augmentation methods (Gao et al., 2021; Wang et al., 2022; Yan et al., 2021;
Liu et al., 2021; Wu et al., 2021; Izacard et al., 2021; Kim et al., 2021). These approaches minimize
the distance between the vector representations of similar sentences, called positive pairs, while
maximizing the distance between those of dissimilar sentences, called negative pairs. Many studies
have focused on constructing better positive and negative pairs. Data augmentation methods such as
dropout masking (Gao et al., 2021), token shuffling (Yan et al., 2021), and sentence negation (Wang
et al., 2022) have led significant improvement and achieved comparable semantic textual similarity
performance to supervised sentence encoders trained on NLI datasets (Cer et al., 2018; Reimers &
Gurevych, 2019; Jiang et al., 2022).
Existing data augmentation methods sometimes generate positive and negative pairs with unintented
semantic changes (Chuang et al., 2022). As a result, sentence encoders have difficulty in learning
fine-grained semantic difference. Figure 1 shows example sentences and their distances computed
by the unsupervised sentence encoder PromptBERT (Jiang et al., 2022). In this figure, sentences
a, b, and c have slightly different meanings that differ by phrases standing in and a body of water
near a waterfall, and the sentence encoder fails to capture fine-grained semantic differences of
these sentences. This results in a large performance difference between unsupervised and supervised
sentence encoders on similar sentence pairs, demonstrated in Figure 2, whereas, the difference is
negligible or reversed on dissimilar pairs. Supervised sentence encoders are robust on similar sentence
pairs since they are trained on natural language inference datasets in which negative pairs have only a
slightly different semantic meaning to the input sentence.
In this paper, we found that neighbor sentences approximate the fine-grained semantic differences
of similar sentences. In Figure 1, identifying a closer neighbor sentence results in predicting the
correct similarity scores even when the embedding vectors capture incorrect semantic meaning; a
    1
        The source code of RankEncoder is submitted as supplementary material.

                                                       1
Under review as a conference paper at ICLR 2023

Figure 1: Vector representation of the input sentences and their neighbor sentences. We simplify
the vector space while maintaining the relative distances between vectors. The neighbor sentences
capture more accurate semantic similarity scores of these input sentences than their vector forms.

                                60                  SimCSE-unsup                         60              PromptBERT-unsup
                                                    SimCSE-sup                                           PromptBERT-sup
                                55                                                       55
              STS performance

                                50                                     STS performance   50
                                45
                                                                                         45
                                40
                                35                                                       40

                                30                                                       35
                                25   0.0-0.33 0.33-0.67 0.67-1.0                         30   0.0-0.33 0.33-0.67 0.67-1.0

Figure 2: The semantic textual similarity task performancese of unsupervised sentence encoders and
supervised sentence encoders on different sentence pair groups. We divide the STS-B dataset by the
similarity score of each sentence pair (0-1 scale).

and c are closer to sentence α than β, and b is closer to sentence β than α. We extend this approach
to a larger context than its neighbors and compare the input sentence with all the sentences in the
given corpus. For a given unsupervised sentence encoder E, our approach, named RankEncoder,
computes another vector representation of the input sentence based on the similarity scores between
the input sentence and the sentences in the given corpus. The similarity scores are computed by the
given sentence encoder, E. RankEncoder captures fine-grained semantic differences better than the
original sentence vector without further training. Since we get more accurate semantic similarity with
RankEncoder on similar sentence pairs, we use RankEncoder’s similarity scores for training and
achieve a better sentence encoder.
From experiments on seven STS benchmark datasets, we verify that 1) rank variables are effective
for capturing the fine-grained semantic difference between sentences, 2) RankEncoder brings im-
provement to any unsupervised sentence encoders, and 3) this improvement leads to state-of-the-art
semantic textual similarity performance. First, we measure the performance difference between
RankEncoder and the base encoder, E, on sentence pairs with different similarity ranges. The ex-
perimental results show that RankEncoder is effective on similar sentence pairs. Second, we apply
RankEncoder to the three base encoders, SimCSE (Gao et al., 2021), PromptBERT (Jiang et al.,
2022), and SNCSE (Wang et al., 2022), then verify that our approach applies to all the base encoders.
Third, we apply RankEncoder to the state-of-the-art unsupervised sentence encoder (Wang et al.,
2022) and achieves a 1.1% improvement. the performances of the previous state-of-the-art method
and our method are 78.97 and 80.07, respectively.
The contributions of this paper are three folds. First, we demonstrate that previous contrastive learning
approaches based on data augmentation methods are limited for capturing fine-grained semantic
differences, leading to a large performance difference between unsupervised and supervised methods

                                                                   2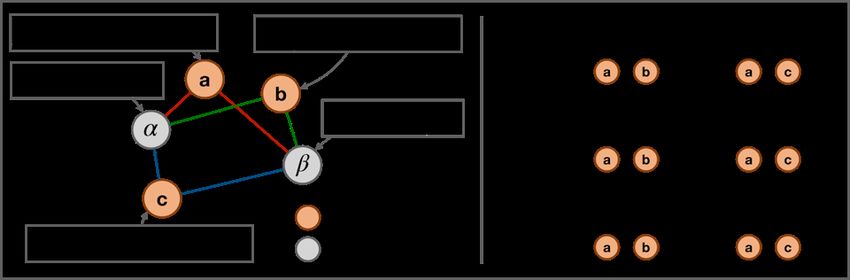
Under review as a conference paper at ICLR 2023

on similar sentence pairs. Second, we propose RankEncoder, which leverages neighbor sentences for
capturing fine-grained semantic differences. Third, we achieve the state-of-the-art STS performance
and reduce the gap between supervised and unsupervised sentence encoders; the performances of our
method and the state-of-the-art supervised sentence encoder (Jiang et al., 2022) are 80.07 and 81.97,
respectively.

2     R ELATED W ORKS
Unsupervised sentence encoders are trained by contrastive learning with positive and negative
sentence pairs. Recent approaches construct positive and negative sentence pairs via data augmentation
methods. SimCSE computes different sentence vectors from an input sentence by applying different
dropout masks (Gao et al., 2021), and ConSERT uses token shuffling and adversarial attacks (Yan
et al., 2021). These data augmentation methods often change the meaning of the input sentence and
generate dissimilar positive pairs. To alleviate this problem, DiffCSE proposes a masked language
modeling based word replacement method (Chuang et al., 2022). Some studies adopt momentum
contrastive learning inspired by unsupervised visual representation learning (Zhang et al., 2021; Wu
et al., 2021). Prompting (Jiang et al., 2022; Jiang & Wang, 2022) is another direction that is capable
of generating positive pairs. With these data augmentation methods, sentence encoders are mostly
trained on dissimilar sentence pairs, which is less important than positive pairs (Thakur et al., 2021;
Zhou et al., 2022); we get n positive pairs and n2 − n negative pairs from a batch of sentences
of size n. SNCSE’s soft-negative sampling method alleviates this problem (Wang et al., 2022).
SNCSE takes the negation of an input sentence and uses this soft-negative sample in a contrastive
learning framework; since the negative sentence is also semantically similar to the input, the sentence
encoder is trained more on similar sentence pairs. Compared to previous approaches focused on
generating better positive and negative pairs, our work uses neighbor sentences to get more accurate
supervision signals for similar sentence pairs, which is a novel approach that previous approaches
have not covered. Related but different from our work, Trans-Encoder proposes the self-distillation
method that gets supervision signals from itself (Liu et al., 2022). Trans-Encoder solves a slightly
different problem from ours. They aim to solve an unsupervised sentence pair modeling problem,
not unsupervised sentence embedding; although this work does not require any human-annotated
similarity scores of sentence pairs for training, they need the sentence pairs of the STS datasets,
which is not allowed to use for training in unsupervised sentence embedding studies.

3     M ETHOD
Neighbor sentences provide an overview of the semantics of the local vector space that they belong
to. From the comparison between the input sentence and its neighbor sentences, we identify which
semantic meanings the input sentence contains more. This is effective for capturing fine-grained se-
mantic difference between sentences. For instance, given two input sentences sharing their neighbors,
the semantic difference is identified by referring neighbor sentences that have reversed relation to the
input sentences; we provide an example in Figure 1. We extend this method to the whole sentences
in the corpus. Our unsupervised sentence encoder, RankEncoder, computes ranks of all sentences
in the corpus by their similarity scores to the input. When two input sentences have similar ranks,
RankEncoder predicts that they are similar. We found that RankEncoder captures more accurate
semantic similarity on similar sentence pairs and leverage RankEncoder’s predictions for training.
We provide the overall illustration of RankEncoder in Figure 3.

3.1   C ONTRASTIVE L EARNING FOR BASE E NCODER

The first step of our framework is to learn a base sentence encoder E1 via the standard contrastive
learning approach (Chen et al., 2020). Given an input sentence xi , we first create a positive example
x+i which is semantically related with xi (Gao et al., 2021; Chuang et al., 2022). By passing the
sentences through a text encoder, e.g., BERT (Devlin et al., 2019) and RoBERTa (Liu et al., 2019), we
obtain the sentence representation v        ⃗ i+ correspondingly. Given a batch of m sentences {xi }m
                                    ⃗ i and v                                                       i=1 ,
the contrastive training objective for the sentence xi with in-batch negative examples is as follows:
                                                               +
                                                   ecos(v⃗i ,⃗vi   )/τ
                                    li = − log Pm                    +      ,                        (1)
                                                   j=1   ecos(⃗vi ,⃗vj )τ

                                                   3
Under review as a conference paper at ICLR 2023
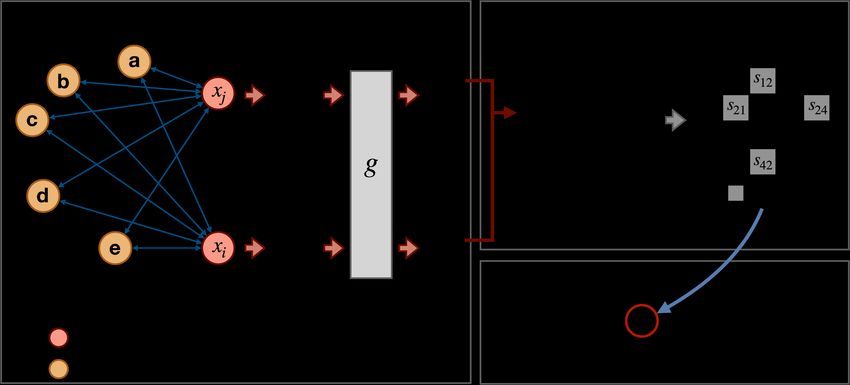
Figure 3: The overall illustration of RankEncoder. The left figure shows the rank vector calculation
process. For a given sentence pair, RankEncoder computes ranks of sentences in the corpus for each
input and normalizes these ranks with function g; the ranks are computed by the base encoder, E1 .
The right figures show the training process of RankEncoder. For a batch of sentences, RankEncoder
computes similarity scores of sentences with their rank vectors and trains the sentence encoder with
the mean square error of these scores.
where cos(·) is the cosine similarity function and τ is the temperature hyperparameter. We P then get
m
the overall contrastive loss for the whole batch by summing over all the sentences: lcl = i=1 li .
Note that the training objective lcl can be further enhanced by adding other relevant losses (Chuang
et al., 2022), transforming the input sentences (Jiang et al., 2022; Gao et al., 2021), or modifying the
standard contrastive loss (Zhou et al., 2022). For simplicity, we use lcl to represent all the variants of
contrastive learning loss in this paper. By optimizing lcl , we first obtain a coarse-grained sentence
encoder E1 for the following steps.
3.2 R ANK E NCODER
RankEncoder computes the ranks of sentences in the corpus with their similarity scores to the input
sentence. For a given corpus with n sentences, C = [x1 , ..., xn ], and a given base encoder, E1 ,
RankEncoder computes the vector representation of each sentence in the corpus, V = [⃗ ⃗ n ],
v1 , ..., v
with E1 . Then computes the rank vector of an input sentence, x, by their ranks as follows:
RankEncoderE1 (x, V) = g(< r1 , r2 , ..., rn >), (2)
where ri is the rank of sentence xi . We compute ri with cosine similarity scores between V and the
vector representation of x computed by E1 . The function g is a normalization function defined as
follows:
⃗r − n1 ni=1 ri · ⃗1
P
g(⃗r) = √ , (3)
n × σ([ri ]ni=1 )
where σ is the standard deviation of the input values, ⃗1 is a vector of ones of size n. By applying this
function to rank vectors, the inner product of two normalized rank vectors becomes equivalent to
Spearman’s rank correlation, and the similarity is scaled between -1 and 1. We describe the connection
between normalization function g and Spearman’s rank correlation in Appendix A.1.
3.3 S EMANTIC V ECTOR S PACE OF R ANK E NCODER
Every sentence in the given corpus becomes a main factor that determines the similarity between two
rank vectors as rank vectors encode all relations between the input sentence and the corpus. However,
for similar sentences, the similarity is mostly affected by their neighbor sentences. Figure 4 shows
the example of RankEncoder’s semantic space when the corpus has three sentences. Each solid line
represents the boundary that two rank variables are converted. For instance, the yellow line is the
boundary that converts the ranks of sentences b and c; all the vectors located in the left part of the
4Under review as a conference paper at ICLR 2023
Figure 4: The rank vector space of RankEncoder with corpus C = {a, b, c}. The sentence vectors
are computed by the base encoder, E. Each element of ⃗r corresponds to the rank of each sentence;
the first element in the vector is the rank of sentence a. Each line represents the boundary that two
rank variables are converted. For instance, all vectors on the left of the yellow line are closer to b than
c. Sentence vectors in the same area have the same rank vector; the rank vector of sentence x is the
same as ⃗rα as it is in the α area.
yellow line are closer to sentence b than c. Since we have three sentences in this corpus, we get six
rank vectors, and all vectors in each region have the same rank vector; for n sentences, we get n!
(factorial) rank vectors. In this figure, all boundaries cross at the central area of the three sentences.
As a result, the six regions are concentrated in the central area. For a given sentence, if its sentence
representation lies in the central area, i.e., the red area, then its corresponding rank vector can be
easily changed by a small modification of the sentence representation. For vectors having larger
distance from these sentences, e.g., the vectors in the gray area, the corresponding rank vectors are
much less sensitive to modification of sentence representation. This pattern holds for a larger corpus
as well; we demonstrate this in Section 5.5. As a result, RankEncoder leverages more on neighbor
sentences even though we use all sentences in the corpus for computing the rank vectors.
3.4 M ODEL T RAINING
We then use rank vectors for training. For a given unsupervised sentence encoder E1 and corpus C,
we compute similarity scores of all possible sentence pairs in a batch with the rank vectors computed
by E1 . The similarity scores are computed by the inner product of these rank vectors. Then, we define
the loss function as the mean square error of RankEncoder’s similarity scores as follows:
m m
1 XX ⊺ 2
lr = ⃗
u ⃗
u j − cos E2 (x i ), E2 (x j ) , (4)
m2 i=1 j=1 i
where {xi }mi=1 are the sentences in the batch, E2 is the sentence encoder in training, ⃗ ui is a vector
representation of xi computed by RankEncoderE1 , and cos(·) is the cosine similarity function. Then,
we combine the RankEncoder loss, lr , with the contrastive loss function of E1 , lcl in the form of the
hinge loss as follows:
ltotal = max(λtrain × lr , lcl ), (5)
where λtrain is a weight parameter for the RankEncoder loss.
3.5 S ENTENCE PAIR F ILTERING
Previous unsupervised sentence encoders randomly sample sentences to construct a batch, and
randomly sampled sentence pairs are mostly dissimilar pairs. This causes sentence encoders to learn
mostly on dissimilar pairs, which is less important than similar sentence pairs. To alleviate this
problem, we filter dissimilar sentence pairs with a similarity under a certain threshold. Also, it is
unlikely that randomly sampled sentence pairs have the same semantic meaning. We regard sentence
5Under review as a conference paper at ICLR 2023
pairs with high similarity as noisy samples and filter these pairs with a certain threshold. The final
RankEncoder loss function with sentence pair filtering is as follows:
m X m n
1[τ ≤ ⃗u⊺i ⃗uj ≤ τu ] 2 o
Pm Pml
X ⊺
lr = × ⃗u ⃗
u − cos E (x ), E (x ) , (6)
q=1 1[τl ≤ ⃗
i j 2 i 2 j
i=1 j=1 p=1 u⊺p ⃗uq ≤ τu ]
where τl and τu are the thresholding parameters, and 1 is the indicator function that returns 1 when
the condition is true and returns 0 otherwise.
3.6 I NFERENCE
We can further utilize RankEncoder in inference stage. Given a sentence pair (xi , xj ), we compute
the similarity between the two sentences as follows:
sim(xi , xj ) = λinf · ⃗u⊺i ⃗uj + (1 − λinf ) · cos E2 (xi ), E2 (xj ) ,
(7)
where E2 is a sentence encoder trained by the RankEncoder loss function, and λinf is a weight
parameter for the similarity computed by RankEncoder, and ⃗ui and ⃗uj are the sentence vectors of xi
and xj computed by RankEncoderE2 .
4 E XPERIMENTAL S ETUP
4.1 BASE E NCODER E1 & C ORPUS C
RankEncoder computes rank vectors by unsupervised sentence encoder E1 with corpus C. We
use 100,000 sentences sampled from Wikipedia as the corpus (C). We demonstrate the efficacy
of RankEncoder with three different unsupervised sentence encoders: SimCSE (Gao et al., 2021),
PromptBERT (Jiang et al., 2022), and SNCSE (Wang et al., 2022). SimCSE is effective to show
the properties of RankEncoder since this model uses the standard contrastive learning loss with the
simple data augmentation method. We use PromptBERT and SNCSE, the state-of-the-art unsupervised
sentence encoders, to verify whether RankEncoder is effective on more complex models.
4.2 DATASETS & E VALUATION M ETRIC
We evaluate RankEncoder on seven semantic textual similarity benchmark datasets: STS2012-
2016 (Agirre et al., 2012; 2013; 2014; 2015; 2016), STS-B (Cer et al., 2017), and SICK-
Relatedness (Marelli et al., 2014). Each dataset consists of sentence pairs with human-annotated
similarity scores. For each sentence pair, sentence encoders predict the similarity, and we measure the
Spearman’s rank correlation between the predicted similarities and the human-annotated similarities.
4.3 T RAINING D ETAILS & H YPER -PARAMETER S ETTINGS
We train RankEncoder on 1 million sentences from Wikipedia, following existing unsupervised
sentence embedding studies. We set λtrain = 0.05, λinf = 0.1, τl = 0.5, and τu = 0.8. We provide
more analysis on the hyper-parameter, λtrain , in Appendix A.2. We use the development sets of the
STS-B and SICK-R datasets for parameter tuning. For other hyper-parameters, we follow the base
encoder’s setting provided by the authors of each base encoder, E1 .
5 R ESULTS AND D ISCUSSIONS
In this section, we demonstrate that 1) RankEncoder is effective for capturing the semantic similarity
scores of similar sentences, 2) RankEncoder applies to existing unsupervised sentence encoders, and
3) RankEncoder achieves state-of-the-art semantic textual similarity (STS) performance. We describe
the detailed experimental results in the following sections.
5.1 S EMANTIC T EXTUAL S IMILARITY P ERFORMANCE
We apply RankEncoder to an existing unsupervised sentence encoder and achieve state-of-the-art
STS performance. We use SNCSE (Wang et al., 2022) fine-tuned on BERT-base (Devlin et al., 2019)
6Under review as a conference paper at ICLR 2023
Model STS12 STS13 STS14 STS15 STS16 STS-B SICK-R AVG
ConSERT (Yan et al., 2021) 64.64 78.49 69.07 79.72 75.95 73.97 67.31 72.74
SimCSE (Gao et al., 2021) 68.40 82.41 74.38 80.91 78.56 76.85 72.23 76.25
DCLR (Zhou et al., 2022) 70.81 83.73 75.11 82.56 78.44 78.31 71.59 77.22
ESimCSE (Wu et al., 2021) 73.40 83.27 77.25 82.66 78.81 80.17 72.30 78.27
DiffCSE (Chuang et al., 2022) 72.28 84.43 76.47 83.90 80.54 80.59 71.23 78.49
PromptBERT (Jiang et al., 2022) 71.56 84.58 76.98 84.47 80.60 81.60 69.87 78.54
SNCSE (Wang et al., 2022) 70.67 84.79 76.99 83.69 80.51 81.35 74.77 78.97
RankEncoder 74.88 85.59 78.61 83.50 80.56 81.55 75.78 80.07
Table 1: Semantic textual similarity performance of RankEncoder and baselines in an unsupervised
setting. Following previous sentence embedding studies, we measure the Spearman’s rank correlation
between the human annotated scores and the model’s predictions. The results of the baselines are
from the original paper. RankEncoder uses SNCSE as base encoder E1 .
81 81
80 SimCSE PromptBERT SNCSE
RankEncoder-SimCSE RankEncoder-PromptBERT RankEncoder-SNCSE
80 80
STS performance (AVG)
STS performance (AVG)
STS performance (AVG)
78
79 79
76
78 78
74
77 77
72
76 76
Figure 5: STS performance of three unsupervised sentence encoders and RankEncoder. We report
the mean performance and standard deviation of three separate trials with different random seeds.
RankEncoder brings improvement on all base encoders. This result implies that our approach generally
applies to other unsupervised sentence embedding approaches.
as the base encoder, E1 , of RankEncoder. Table 1 shows the STS performance of RankEncoder
and unsupervised sentence encoders on seven STS datasets and their average performance (AVG).
RankEncoder increases the AVG performance of SNCSE by 1.1 and achieves the state-of-the-art STS
performance.
RankEncoder brings a significant performance gain on STS12, STS13, STS14, and SICK-R, but a
comparably small improvement on STS16 and STS-B. We conjecture that this is the results of the
effectiveness of RankEncoder on similar sentence pairs. In Appendix A.3, we show the similarity
distribution of each dataset. From the similarity distributions, we see that STS12,13,14 and SICK-R
contain more similar sentence pairs than dissimilar pairs. This pattern is aligned with the performance
gain on each STS dataset in Table 1.
5.2 U NIVERSALITY OF R ANK E NCODER
RankEncoder applies to any unsupervised sentence encoders. We apply RankEncoder to SimCSE (Gao
et al., 2021), PromptBERT (Jiang et al., 2022), and SNCSE (Wang et al., 2022). SimCSE represents
the vanilla contrastive learning based sentence encoder, and PromptBERT and SNCSE represent the
state-of-the-art unsupervised sentence encoders. We evaluate each encoder’s average performance
(AVG) on seven STS datasets. We train each encoder in three separate trials and report the mean
and the standard deviation of the three AVG performances in Figure 5; the error bar shows the
standard deviation. In this figure, RankEncoder increases the average STS performance of the three
unsupervised sentence encoders; the improvements on SimCSE, PromptBERT, and SNCSE are 2.1,
0.9, and 0.9, respectively. We report detailed experimental results in Appendix A.4. This result implies
that RankEncoder is a universal method that applies to any unsupervised sentence encoders.
7Under review as a conference paper at ICLR 2023
100
Performance diff
20 # overlapping top-k sentences
80
10
Spearman's Rho
60
0
N
40
10
20
20 0
0.4 0.45
0.5 0.50
0.5 0.55
0.6 0.60
0.6 0.65
0.7 0.70
0.7 0.75
0.8 0.80
0.8 0.85
0.9 0.90
0.9 0.95
.00
5-1
0-
5-
0-
5-
0-
5-
0-
5-
0-
5-
0-
0.4
Sentence-pair groups
Figure 6: The performance difference between SimCSE and RankEncoder on each sentence pair
groups (blue line) and the number of sharing neighbor sentences (yellow bar). We measure the
performance gain brought by our approach on SimCSE. We group sentence pairs in the STS-B dataset
based on the cosine similarity of their vector representations computed by SimCSE. We count the
sharing neighbor sentences by taking the average of the number of overlapping top-100 sentences of
each pair.
5.3 OVERLAPPING N EIGHBOR S ENTENCES
In Section 3.3, we conjecture that the RankEncoder is specifically effective for similar sentence
pairs since they have more overlapping neighbor sentences. To support this supposition, we show
the relation between the performance gain caused by RankEncoder and the number of overlapping
neighbor sentences of the input sentences. We group sentence pairs in the STS-B dataset with their
cosine similarity scores, then compare the STS performance of SimCSE and RankEncoder (Eq. 2
without re-training) on each group; we use SimCSE as the base encoder, E1 , of RankEncoder. We
also report the average number of overlapping neighbor sentences of sentence pairs in each group.
We select the nearest 100 neighbor sentences for each sentence in a given sentence pair and count the
number of sentences in the intersection. Figure 6 shows one expected result of our supposition; the
performance gain correlates with the number of overlapping neighbor sentences.
50
51 50
48 50
Spearman’s rho
Spearman’s rho
Spearman’s rho
49
46 49
48
48
44 47
47
42 46
SimCSE PromptBERT SNCSE
RankEncoderSimCSE RankEncoderPromptBERT RankEncoderSNCSE
RankEncoderSimCSE-retrain RankEncoderPromptBERT-retrain RankEncoderSNCSE-retrain
RankEncoderSimCSE-retrain-inf RankEncoderPromptBERT-retrain-inf RankEncoderSNCSE-retrain-inf
Figure 7: STS performance of three unsupervised sentence encoders and RankEncoder on sentence
pairs with high similarity scores; we use the STS-B dataset and select sentence pairs with a similarity
between 0.67 and 1.0 (0.0-1.0 scale). We ablate the two components of RankEncoder, re-training (Eq.
5) and inference (Eq. 7).
8Under review as a conference paper at ICLR 2023
5.4 P ERFORMANCE ON SIMILAR SENTENCE PAIRS
In Section 5.3, we show that RankEncoder is effective for sentence pairs closely located in the
semantic vector space. In this section, we demonstrate that the same pattern holds for human-
annotated similar sentence pairs. We divide sentence pairs in the STS-B dataset into three groups by
their human-annotated similarity scores and use the group with the highest similarity. The similarity
range of each group is 0.0-0.33 for the dissimilar groups, 0.33-0.67 for the intermediate group,
and 0.67-1.0 for the similar group; we normalize the scores to a 0.0-1.0 scale. Figure 7 shows the
performance of three unsupervised sentence encoders and the performance gain brought by each
component of RankEncoder. RankEncoderE is the model with Eq. 2 that uses E as the base encoder.
RankEncoderE -retrain is the model with re-training (Eq. 5). RankEncoderE -retrain-inf is the model
with re-training and weighted inference (Eq. 7). From the comparison between E and RankEncoderE ,
we verify that rank vector effectively increases the base encoder’s performance on similar sentence
pairs. This improvement is even more significant when using rank vectors for re-training and inference.
We report the detailed results in Appendix A.5.
(a) PromptBERT (b) RankEncoder
Figure 8: Two semantic vector spaces of PromptBERT and RankEncoder. We randomly sampled
1000 sentences from the STS-B dataset and visualize the vector representations of these sentences
(grey dots). We use the same PromptBERT encoder as the base encoder of RankEncoder. We use the
following equatino to compute the distances between vectors; dist(⃗vi , v⃗j ) = 1 − cos(⃗vi , v⃗j ). The
bigger the similarity the closer the vectors.
5.5 T HE V ECTOR S PACE OF R ANK E NCODER
In Section 3.3, we show that RankEncoder increases the distance between similar sentences. In
this section, we demonstrate that this pattern holds for a larger corpus as well. In Figure 8, we
show the vector space of PromptBERT and RankEncoder; we use PromptBERT as the base encoder
of RankEncoder. We visualize the vector representations of randomly sampled 1,000 sentences in
the STS-B dataset. In this figure, the sub-spaces where vectors located closely are expanded by
RankEncoder and the overall vector space become more uniform. We report the detailed comparison
of uniformity (Gao et al., 2021) of unsupervised sentence encoders and RankEncoder in Appendix
A.6.
6 C ONCLUSION
In this study, we found that previous unsupervised sentence encoders based on data augmentation
methods have a certain limitation for capturing fine-grained semantic meanings of sentences. We
proposed RankEncoder, which captures semantic meanings of sentences by leveraging their neighbor
sentences. We verified that using relations between the sentence and its neighbors increases the STS
performance without further training. We also showed that our approach is specifically effective
for capturing the semantic similarity scores of similar sentences. For further improvement, we used
the similarity scores computed by RankEncoder for training unsupervised sentence encoders and
achieved the state-of-the-art STS performance. We also demonstrated that RankEncoder is generally
applicable to any unsupervised sentence encoders.
9Under review as a conference paper at ICLR 2023
R EFERENCES
Eneko Agirre, Daniel Cer, Mona Diab, and Aitor Gonzalez-Agirre. Semeval-2012 task 6: A pilot on
semantic textual similarity. In SemEval, 2012.
Eneko Agirre, Daniel Cer, Mona Diab, Aitor Gonzalez-Agirre, and Weiwei Guo. * sem 2013 shared
task: Semantic textual similarity. In SemEval, 2013.
Eneko Agirre, Carmen Banea, Claire Cardie, Daniel Cer, Mona Diab, Aitor Gonzalez-Agirre, Weiwei
Guo, Rada Mihalcea, German Rigau, and Janyce Wiebe. SemEval-2014 task 10: Multilingual
semantic textual similarity. In SemEval, 2014.
Eneko Agirre, Carmen Banea, Claire Cardie, Daniel Cer, Mona Diab, Aitor Gonzalez-Agirre, Weiwei
Guo, Inigo Lopez-Gazpio, Montse Maritxalar, Rada Mihalcea, et al. Semeval-2015 task 2: Semantic
textual similarity, english, spanish and pilot on interpretability. In SemEval, 2015.
Eneko Agirre, Carmen Banea, Daniel Cer, Mona Diab, Aitor Gonzalez-Agirre, Rada Mihalcea,
German Rigau, and Janyce Wiebe. SemEval-2016 task 1: Semantic textual similarity, monolingual
and cross-lingual evaluation. In SemEval, 2016.
Daniel Cer, Mona Diab, Eneko Agirre, Iñigo Lopez-Gazpio, and Lucia Specia. SemEval-2017 task 1:
Semantic textual similarity multilingual and crosslingual focused evaluation. In SemEval, 2017.
Daniel Cer, Yinfei Yang, Sheng-yi Kong, Nan Hua, Nicole Limtiaco, Rhomni St John, Noah Constant,
Mario Guajardo-Cespedes, Steve Yuan, Chris Tar, et al. Universal sentence encoder. arXiv, 2018.
Ting Chen, Simon Kornblith, Mohammad Norouzi, and Geoffrey Hinton. A simple framework for
contrastive learning of visual representations. In ICML, 2020.
Yung-Sung Chuang, Rumen Dangovski, Hongyin Luo, Yang Zhang, Shiyu Chang, Marin Soljačić,
Shang-Wen Li, Wen-tau Yih, Yoon Kim, and James Glass. Diffcse: Difference-based contrastive
learning for sentence embeddings. arXiv, 2022.
Jacob Devlin, Ming-Wei Chang, Kenton Lee, and Kristina Toutanova. BERT: Pre-training of deep
bidirectional transformers for language understanding. In NAACL, 2019.
Tianyu Gao, Xingcheng Yao, and Danqi Chen. SimCSE: Simple contrastive learning of sentence
embeddings. In EMNLP, 2021.
Gautier Izacard, Mathild Caron, Lucas Hosseini, Sebastian Riedel, Piotr Bojanowski, Armand Joulin,
and Edouard Grave. Unsupervised dense information retrieval with contrastive learning. arXiv,
2021.
Ting Jiang, Shaohan Huang, Zihan Zhang, Deqing Wang, Fuzhen Zhuang, Furu Wei, Haizhen Huang,
Liangjie Zhang, and Qi Zhang. Promptbert: Improving bert sentence embeddings with prompts.
arXiv, 2022.
Yuxin Jiang and Wei Wang. Deep continuous prompt for contrastive learning of sentence embeddings.
arXiv, 2022.
Taeuk Kim, Kang Min Yoo, and Sang-goo Lee. Self-guided contrastive learning for bert sentence
representations. In ACL, 2021.
Fangyu Liu, Ivan Vulić, Anna Korhonen, and Nigel Collier. Fast, effective, and self-supervised:
Transforming masked language models into universal lexical and sentence encoders. In EMNLP,
2021.
Fangyu Liu, Yunlong Jiao, Jordan Massiah, Emine Yilmaz, and Serhii Havrylov. Trans-encoder:
Unsupervised sentence-pair modelling through self- and mutual-distillations. In ICLR, 2022.
Yinhan Liu, Myle Ott, Naman Goyal, Jingfei Du, Mandar Joshi, Danqi Chen, Omer Levy, Mike Lewis,
Luke Zettlemoyer, and Veselin Stoyanov. RoBERTa: A robustly optimized BERT pretraining
approach. arXiv, 2019.
10Under review as a conference paper at ICLR 2023
Marco Marelli, Stefano Menini, Marco Baroni, Luisa Bentivogli, Raffaella Bernardi, and Roberto
Zamparelli. A SICK cure for the evaluation of compositional distributional semantic models. In
LREC, 2014.
Nils Reimers and Iryna Gurevych. Sentence-bert: Sentence embeddings using siamese bert-networks.
In EMNLP-IJCNLP, 2019.
Nandan Thakur, Nils Reimers, Johannes Daxenberger, and Iryna Gurevych. Augmented sbert: Data
augmentation method for improving bi-encoders for pairwise sentence scoring tasks. In NAACL,
2021.
Hao Wang, Yangguang Li, Zhen Huang, Yong Dou, Lingpeng Kong, and Jing Shao. Sncse: Contrastive
learning for unsupervised sentence embedding with soft negative samples. arXiv, 2022.
Tongzhou Wang and Phillip Isola. Understanding contrastive representation learning through align-
ment and uniformity on the hypersphere. In ICML, 2020.
Xing Wu, Chaochen Gao, Liangjun Zang, Jizhong Han, Zhongyuan Wang, and Songlin Hu. Esimcse:
Enhanced sample building method for contrastive learning of unsupervised sentence embedding.
arXiv, 2021.
Yuanmeng Yan, Rumei Li, Sirui Wang, Fuzheng Zhang, Wei Wu, and Weiran Xu. Consert: A
contrastive framework for self-supervised sentence representation transfer. In ACL, 2021.
Yan Zhang, Ruidan He, Zuozhu Liu, Lidong Bing, and Haizhou Li. Bootstrapped unsupervised
sentence representation learning. In ACL, 2021.
Kun Zhou, Beichen Zhang, Xin Zhao, and Ji-Rong Wen. Debiased contrastive learning of unsuper-
vised sentence representations. In ACL, 2022.
A A PPENDIX
A.1 T HE CONNECTION BETWEEN THE NORMALIZATION FUNCTION g AND S PEARMAN ’ S
R ANK C ORRELATION
The Spearman’s rank correlation of two list of variables, u =< u1 , ..., un > and v =< v1 , ..., vn >,
is the Pearson correlation coefficient, ρ, of their ranks, ru and rv , as follows:
n
X 1
ρ(ru , rv ) = (riu − ru ) × (riv − rv ) /(σ(ru ) × σ(rv )), (8)
i=1
n
where ru and rv are the mean of the rank variables, σ(r)u and σ(r)v are the standard deviations of
ranks. Then, this can be re-written as follows:
1 ⊺ 1 v
ρ(ru , rv ) = √ (ru − ru )/σ(ru ) √ (r − rv )/σ(rv ) .
(9)
n n
Thus, the inner product of the two rank vectors after normalization with g is equivalent to the
Spearman’s rank correlation of the rank variables.
A.2 λTRAIN A NALYSIS
The RankEncoder loss, lr , brings a large effect to RankEncoder’s re-training process even when the
weight parameter, λtrain , is set to a small value. In this section, we show that the two losses, lcl and
lr , similarly affect to the total loss, ltotal in Eq. 5, when λtrain = 0.05, which is the default setting
we use for all experiments in this paper. Figure 9 shows the training loss curves of RankEncoder
and SimCSE-unsup with the same random seed. We show the two losses, lcl and lr , of RankEncoder
separately. SimCSE-unsup’s loss rapidly decreases at the beginning, and converges to a value less
than 0.001. We see a similar pattern in the contrastive loss of RankEncoder, which is the same loss
11Under review as a conference paper at ICLR 2023
100
Loss (10°2)
0.2
0.1
0.0
0 2000 4000 6000
Steps
SimCSE-unsup (lcl ) RankEncoder (∏train £ lr )
RankEncoder (lcl ) SimCSE-sup (lcl )
Figure 9: The training loss curves of SimCSE and RankEncoder. X-axis represents a training step, and
Y-axis is a scaled loss. After few training steps, the three losses converge in a similar value. Setting
λtrain to a small value, 0.05, results in similar weights on the two loss functions of RankEncoder while
maintaining the loss curve of the base encoder.
function as SimCSE-unsup. In contrast, λtrain × lr starts from a much lower value than lcl ; even
without the weight parameter, lr is still much lower than lcl . After few training steps, λtrain × lr
converges close to the value of lcl . Given that λtrain determines the scale of two losses of our hinge
loss function (Eq. 5), we expect that increasing λtrain brings RankEncoder’s loss curve converged to
higher than SimCSE’s loss. This result shows that λtrain = 0.05 is optimal value that maintaining the
RankEncoder’s loss curve similar to the base encoder’s loss curve, while balancing the weights of the
two losses, lcl and lr .
The loss curve of a supervised sentence encoder provides a reference point for comparison between
the loss curves of unsupervised sentence encoders. In Figure 9, all unsupervised sentence encoders’
loss curves show a rapidly decreasing pattern, which implies overfitting in training. To verify whether
this pattern comes from unsupervised training, we show the loss curve of the supervised sentence
encoder, SimCSE-sup, in Figure 9. In this experiment, we measure the same contrastive loss used in
unsupervised sentence encoders but in the SimCSE-sup’s fully supervised training process. We see
the same pattern also holds for SimCSE-sup and verify that the rapidly decreasing pattern is not the
problem that only occurs in unsupervised training.
A.3 S IMILARITY D ISTRIBUTION OF STS B ENCHMARK DATASETS
Semantic textual similarity datasets have different similarity distributions. Since RankEncoder is
specifically effective for similar sentence pairs, we expect that RankEncoder brings a more perfor-
mance increase on datasets with more similar sentence pairs. We show the similarity distribution
of each STS dataset in Figure 10. In this figure, we normalize the similarity scores between 0 and
1. The result shows that the similarity distributions of STS12, STS14, and SICK-R are skewed to a
high similarity score and STS13’s similarity distribution has a distinct peak at a high similarity score.
From the results in Table 1, we see that RankEncoder is more effective on STS12, STS13, STS14,
SICK-R, and show the relation between the performance increase and the similarity distribution of
each dataset.
A.4 U NIVERSALITY OF R ANK E NCODER
In this section, we report the detailed experimental results of Figure 5. Table 2 shows the results.
A.5 T HE PERFORMANCE OF R ANK E NCODER ON S IMILAR S ENTENCE PAIRS
We report the detailed results of Figure 7 in Table 3.
12Under review as a conference paper at ICLR 2023
STS12 STS13 300
STS14
100
400 250
80
300 200
60
150
N
N
N
200
40 100
100 20 50
0 0.00 0.25 0.50 0.75 1.00 0 0.00 0.25 0.50 0.75 1.00 0 0.00 0.25 0.50 0.75 1.00
Similarity Similarity Similarity
STS15 STS16 STS-B
250 200 100
200 150 80
150 60
N
N
N
100
100 40
50 50
20
0 0.00 0.25 0.50 0.75 1.00 0 0.00 0.25 0.50 0.75 1.00 0 0.00 0.25 0.50 0.75 1.00
Similarity Similarity Similarity
SICK-R
350
300
250
200
N
150
100
50
0 0.00 0.25 0.50 0.75 1.00
Similarity
Figure 10: Similarity distributions of semantic textual similarity benchmark datasets. We scale the
similarity scores between 0.0 and 1.0.
Model STS12 STS13 STS14 STS15 STS16 STS-B SICK-R AVG
SimCSE 68.1±3.3 81.4±1.6 73.8±2.4 81.8±1.4 78.3±0.6 77.3±2.3 71.0±0.4 76.0±1.5
+ RankEncoder 75.0±0.6 82.0±0.7 75.2±0.2 83.0±0.1 79.8±0.1 80.4±0.6 71.1±1.2 78.1±0.1
PromptBERT 72.1±0.2 84.6±0.3 76.8±0.1 84.2±0.3 80.4±0.3 81.8±0.3 69.5±0.2 78.5±0.0
+ RankEncoder 74.2±0.3 85.2±0.2 77.7±0.2 84.4±0.3 80.7±0.5 82.1±0.4 71.2±0.2 79.4±0.2
SNCSE 70.2±0.5 84.1±0.5 77.1±0.4 83.2±0.5 80.7±0.1 80.7±0.6 75.0±0.1 78.7±0.3
+ RankEncoder 73.9±0.6 84.5±0.5 78.0±0.3 83.0±0.5 81.0±0.2 81.2±0.2 75.3±0.1 79.6±0.2
Table 2: Semantic textual similarity performance of RankEncoder and base encoders: SimCSE,
PromptBERT, and SNCSE. We measure the Spearman’s rank correlation between the human annotated
scores and the model’s predictions. We report the mean performance and standard deviation of three
separate trials with different random seeds.
13Under review as a conference paper at ICLR 2023
Base Encoder E1
SimCSE PromptBERT SNCSE
E 44.59 49.56 48.19
RankEncoderE 46.73 50.06 49.44
RankEncoderE − retrain 48.41 50.75 49.80
RankEncoderE − retrain − inf 48.73 50.93 49.92
Table 3: Semantic textual similarity performance of variations of RankEncoder. E is the base encoder.
RankEncoderE is RankEncoder with Eq. 2. RankEncoder − retrain is RankEncoder with Eq. 5.
RankEncoder − retrain − inf is RankEncoder with Eq. 7.
A.6 U NIFORMITY
RankEncoder improves uniformity of the semantic vector space of base encoders. We use the
uniformity metric proposed by Wang & Isola (2020) to evaluate uniformity of base encoders and
RankEncoder. Table 4 shows the results.
Base Encoder E
SimCSE PromptBERT SNCSE
E -2.42 -1.49 -2.21
RankEncoderE -3.23 -3.31 -3.20
Table 4: Uniformity of base encoders and RankEncoder. Lower uniformity is better.
14You can also read