R 1281 - The effects of shop opening hours deregulation: evidence from Italy by Lucia Rizzica, Giacomo Roma and Gabriele Rovigatti - Temi di ...
←
→
Page content transcription
If your browser does not render page correctly, please read the page content below
Temi di discussione
            (Working Papers)

            The effects of shop opening hours deregulation:
            evidence from Italy

            by Lucia Rizzica, Giacomo Roma and Gabriele Rovigatti
June 2020

                                                                             1281
                                                                    Number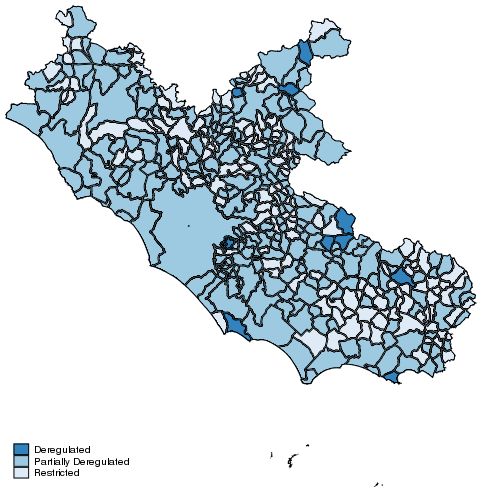
Temi di discussione
(Working Papers)

The effects of shop opening hours deregulation:
evidence from Italy

by Lucia Rizzica, Giacomo Roma and Gabriele Rovigatti

Number 1281 - June 2020
The papers published in the Temi di discussione series describe preliminary results and
are made available to the public to encourage discussion and elicit comments.
The views expressed in the articles are those of the authors and do not involve the
responsibility of the Bank.

Editorial Board: Federico Cingano, Marianna Riggi, Monica Andini, Audinga
Baltrunaite, Marco Bottone, Davide Delle Monache, Sara Formai, Francesco
Franceschi, Salvatore Lo Bello, Juho Taneli Makinen, Luca Metelli, Mario
Pietrunti, Marco Savegnago.
Editorial Assistants: Alessandra Giammarco, Roberto Marano.

ISSN 1594-7939 (print)
ISSN 2281-3950 (online)
Printed by the Printing and Publishing Division of the Bank of Italy
THE EFFECTS OF SHOP OPENING HOURS DEREGULATION:
                                  EVIDENCE FROM ITALY

                          by Lucia Rizzica*, Giacomo Roma* and Gabriele Rovigatti*

                                                                 Abstract
      We estimate the effects of the deregulation of shop opening hours on the market
structure of the retail sector and on the size and composition of the labour force employed
there. To identify these effects, we exploit the staggered implementation of a reform that
allowed Italian municipalities to adopt fully flexible opening hours in the late 1990s. Our
findings indicate that the possibility of opening shops 24/7 increased employment in the retail
sector by about three per cent and raised the number of shops in the affected municipalities by
about two per cent. The effects were concentrated amongst workers employed in larger
commercial outlets that were better able to exploit the flexibility introduced by the new
regime. An analysis of individual-level evidence suggests that the deregulation also produced
a recomposition of employment towards regular employees rather than self-employed
workers.

JEL Classification: J21, K20, L51, L81.
Keywords: regulation, retail sector, employment.
DOI: 10.32057/0.TD.2020.1281
                                                                 Contents
1.  Introduction ........................................................................................................................... 5
2.  Institutional background ........................................................................................................ 9
3.  Data and descriptives ........................................................................................................... 10
4.  Empirical strategy ................................................................................................................ 13
5.  Results ................................................................................................................................. 15
    5.1. Main results .................................................................................................................. 15
    5.2. Robustness checks ........................................................................................................ 17
    5.3. Heterogeneous effects .................................................................................................. 19
    5.4. Spatial spillovers .......................................................................................................... 20
    5.5. Sectoral spillovers ........................................................................................................ 24
6. Individual-level evidence ..................................................................................................... 25
Conclusions .............................................................................................................................. 29
Tables ....................................................................................................................................... 31
Figures ...................................................................................................................................... 41
References ................................................................................................................................ 45
Appendices ............................................................................................................................... 49

_______________________________________
*
    Bank of Italy, Directorate General for Economics, Statistics and Research, Structural Economic Analysis
    Directorate, Law and Economics Division.
1 Introduction∗
To what extent countries should regulate the entry and activity in the service sector has
traditionally been a debated topic, both from the policy (Gal and Hijzen, 2016) and academic
perspectives (Arnold et al., 2016; Barone and Cingano, 2011). According to the OECD
(Égert, 2018), well-functioning and competitive markets require i) a sound legal and judicial
infrastructure, ii) an effective competition regime, iii) an efficient insolvency regime and,
finally, iv) a competition-friendly Product Market Regulation (PMR).2 Despite a widespread
consensus on a negative link between the stringency of PMR on one side and average firm
size, productivity and investment on the other (Égert, 2016; Andrews and Cingano, 2014;
Alesina et al., 2005), the relative impact of specific pieces of regulation is still disputed, with
little empirical evidence on their real effects. More specifically, while there is a substantial
number of contributions focusing on the impact of entry barriers on productivity (Schivardi
and Viviano, 2011; Maican and Orth, 2015, 2018), employment (Bertrand and Kramarz,
2002; Viviano, 2008) and market structure (Sadun, 2015), which advocate the liberalization
as a way to foster competition, less is known on the effects of other regulatory barriers and
whether and to what extent they hinder market competitiveness and eventually affect social
welfare.
In this paper we focus on how the regulation of shops opening hours affects the relevant
market size and structure. This dimension of PMR has traditionally been a controversial
issue in the policy debate, as it involves social, political, economic, and even religious con-
siderations. The debate originated in the US as back as in the seventeenth century with
the Blue Laws - i.e., the laws designed to restrict or ban some or all Sunday activities for
religious reasons, particularly to promote the observance of a day of worship or rest - and
was revived in the mid-nineteenth century thanks to several Supreme Court appeals which,
∗
We would like to thank Gaetano Basso, Emanuele Ciani, Emanuela Ciapanna, Federico Cingano,
Domenico Depalo, Silvia Giacomelli, Sauro Mocetti, Paolo Sestito, Eliana Viviano and seminar partici-
pants at the AIEL conference (2019) for useful suggestions. The views expressed in this paper are those of
the authors and do not involve the responsibility of the Bank of Italy. The usual disclaimers apply.
2
In its periodic survey, which results in the publication of the PMR indicators (both sectoral and economy-
wide) the OECD quantifies the extent of several regulatory elements: from the administrative barriers to
entry to the role of state-owned firms in the market, from the provision of anti-competitive codes of conduct
for professionals to price and shop opening hours limitations. For further details see Koske et al. (2015).
5in most cases, upheld the legitimacy of bans. In Europe the debate has been much less
heated until recent years, when a wave of deregulation involved - with much cross-country
heterogeneity - northern countries like Denmark, UK and the Netherlands as well as Ger-
many, Italy and Spain. Despite the existence of a clear trend towards the liberalization of
Sunday and public holiday openings in both the US and the EU regulatory frameworks, the
timing and extent of the deregulation still vary across countries, states, regions.3
Those in favor of regulatory interventions not only underline the importance of the respect
of the same day of rest for all workers but also advocate welfare losses due to the negative
effects on small retailers which would suffer an unfair competition coming from large players,
the latter being better able to cover longer work shifts. On the other hand, the advocates of
liberalization stress that longer shopping hours have a positive impact not only on consumers’
welfare, but also on employment, productivity and, ultimately, economic growth.
From a purely theoretical economic perspective, however, the effects of deregulating shops
opening hours are ex-ante uncertain. In the short-run, the effect on employment may be null
or positive depending on the degree to which shops respond by effectively opening longer
hours; moreover, there may be either an increase in the number of workers employed or just
an increase in the number of weekly hours worked, depending on the capability of firms to
redistribute the working loads. In the longer run, instead, there are more complex general
equilibrium effects on the market structure whose final effect on employment and economic
growth remain ex-ante ambiguous. On the one hand, larger and more competitive shops
are likely to benefit more than the small players (Schivardi and Viviano, 2011), to the point
to force them out of the market - e.g., if longer shopping hours facilitate price comparison
(Clemenz, 1990) or if Sunday openings lower travel costs to shop locations (De Meza, 1984)
- on the other hand, the increased competition could promote small shops’ specialization,
and small retailers could benefit from the augmented demand due to longer shopping hours
(i.e., small players might end up with a lower share of a market whose size is nonetheless
bigger than in the regulated period).
3
For a comprehensive review of regulatory changes in the US, see Burda and Weil (2004), see Maher
(1995) for the UK case and Dijkgraaf and Gradus (2007) for the Netherlands.
6In this paper, we tackle these questions empirically and estimate the effects of full deregu-
lation in shop opening hours on the level and composition of employment and on the number
of shops and their size distribution, thus shedding light on the implied market structure. To
identify the effect of interest, we focus on Italy and build a novel dataset of Italian munic-
ipalities 2007-2016, including their regulatory status, and exploit the variation provided by
the staggered implementation at the municipal level of a deregulation reform enacted from
1998 onwards. The core empirical analysis, then, relies on administrative data reporting
the number of workers and plants located in each Italian municipality by year, sector of
activity and plant size. We complement this analysis with individual-level evidence based
on the Italian Labor Force Survey (LFS) which allows us to obtain a more detailed picture
of the effects of the reform on the composition of employment in terms of individual and
employment relation characteristics.
Our estimates show that, in the context of a general contraction of the retail sector and
of the economy as a whole, deregulating shops opening hours helped lowering the decrease in
both the number of workers and establishments, with an estimated positive impact of about
3% and 2%, respectively. Such effects were mainly driven by the large retailers, thus leading
to a marked recomposition of the sector in favor of the latter. On top of it, individual-based
estimates show that the sector’s labor force structure changed towards a higher prevalence of
employees over self-employed, together with a general increase in the number of hours worked
and earnings of employees, especially of those with permanent contracts. Our results are
robust to a number of checks that account for the possibility of geographical spillovers, the
potential selection of deregulated municipalities and the different timing of the liberalization.
Our results are consistent with the scant evidence documenting the effects that deregu-
lating shops opening hours produced in other countries. Some papers focusing on the US
(Goos, 2004; Burda and Weil, 2004) found a negative effect of the “Blue Laws” on em-
ployment in the retail sector, both for part- and full-time work (with estimates ranging
from 2 to 6%). Similarly, for Canada, Skuterud (2005) estimated that deregulating Sunday
openings generated a positive effect on total employment between 5 and 12%. As for the
European context, the existing literature focused on the case of Germany, where a deregu-
7lation of shopping hours was progressively enacted by the different states between 2006 and
2007.4 In this context, Bossler and Oberfichtner (2017) and Senftleben-König (2014) found
mixed evidence - no effects and mildly positive effects on part-time workers, respectively.
On the other hand, exploiting the variation in deregulation across time and states to inform
a difference-in-differences identification strategy, Paul (2015) estimated that the reform in-
creased the overall sector employment rate, and that the individual employment probability
rose by 2.5%, with marked differences across workers’ subgroups and firm types.
We add to the existing literature in several ways. First, thanks to the very peculiar nature
of the treatment in the Italian regulatory setting - i.e., confined within municipal boundaries
- we are able to identify the average treatment effect at a very fine level, controlling for
any potential confounding factor, policy-related distortion and regional peculiarity through
several layers of fixed effects. Moreover, we manage to identify and control for geographical
spillovers so as to account for possible bias due to the sorting of employers, workers and
consumers across municipalities with different regulatory frameworks. Second, our data
allow us to consistently estimate the effects of the deregulation on local market structures
by looking not just at the number but also at the size distribution of active plants. Third,
the use of worker-level data allows us to detail the impact on employment shedding light
on the compositional effects generated by the reform. Finally, we are the first to study the
impact of such reforms in the Italian setting, which is characterized by a very small average
size of the shops and a low average level of productivity (Ciapanna and Rondinelli, 2014).
The remainder of the paper is structured as follows: in Section 2 we introduce the Italian
regulatory framework of the retail sector; Section 3 is devoted to the description of the
dataset and the discussion of the main features of the market; in Section 4 we introduce and
discuss our identification strategy; Section 5 illustrates our main empirical findings; while
Section 6 is dedicated to the individual level analysis; finally, Section 7 concludes.
4
More specifically, the jurisdiction on shop opening hours’ regulation was transferred from the federal
government to the state governments, whose interventions led to a progressive liberalization between Novem-
ber, 2006 and July, 2007.
82 Institutional Background
In all OECD countries retail trade is regulated under several dimensions. Restrictions gen-
erally apply to the localization of stores, the licenses needed to start a business, the periods
of sales promotions and maximum discounts applicable, and shop opening hours. With re-
spect to the latter, regulation typically either specifies the opening and closing hours and
the maximum number of hours a shop can stay open, or simply ban or restrict Sunday and
public holidays shop openings.
The legislation on shop opening hours significantly varies across countries, even if dif-
ferent liberalization measures have been adopted in most of the OECD countries in recent
years. According to the OECD PMR indicators, in 1998 shop opening hours were completely
liberalized in 8 countries (out of 26); this number raised to 16 (out of 34) in 2013. In any
case, no legislation provides for a complete ban of Sunday or public holidays opening. Ex-
ceptions generally regard touristic areas or a limited number of Sunday or public holidays
per year. In some jurisdictions, restrictions do not apply to small shops. In some cases, rules
are fixed at the regional or local level: for example, in Germany and Spain the restrictions
significantly vary across areas, and are less constraining in the capital cities. In addition to
this, even in countries where some limitation has been maintained, restrictions were loosened
lately. For example, in 2015 the French Parliament passed a law (“loi Macron”) to increase
the number of Sunday openings allowed yearly from 4 to 12.
In Italy, the retail trade regulation dates back to the first half of the XX century. Until
the end of the 1990s Sunday openings were generally prohibited and opening hours strictly
limited; exceptions, yet, could be decided by the regional governments, thus returning a
scattered regulatory picture over the national territory.
In 1998, then, a comprehensive reform of the sector was passed (the “Bersani Decree”)
with the aim of loosening some of the restrictions and boost competition. In particular,
the reform fixed, for the whole national territory, the set of administrative authorizations
required to open new shops and the relevant criteria to be considered (e.g., urban planning
constraints) that varied on the basis of the shop’s size, smaller shops being generally subject
9to milder requirements.5 Moreover, the reform established a general regulation of shops
opening hours that restricted both the number of Sunday openings (8 per year) and the
daily opening hours (a maximum of 13 hours within the 7AM-10PM period) for all shops.
However, two main exceptions were introduced: (i) shops could stay open every day in
December in all municipalities; (ii) all the restrictions were removed in the municipalities
which most relied on tourism. Such municipalities (henceforth “touristic municipalities”)
were included in a list compiled at the regional level. First, the regions set the criteria that
municipalities should fulfill in order to obtain such status and thus be exempted from any
restriction on shop opening hours. Then, each municipality could apply to be included in
the list. The regional governments were entrusted with the power to include in the list the
municipalities that complied with the criteria and to apply limitations on the periods of the
year or the areas of the municipality that were subject to the deregulated regime (i.e., periods
or areas most subject to touristic flows).6 The lists made by the regional administrations
were updated over time, following the same process.
In December 2011, eventually, all these rules were repealed: the Law Decree 201/2011
(“Salva Italia”) completely liberalized days and hours of shopping all over the country, thus
overcoming the distinction between touristic and non touristic municipalities.
3 Data and Descriptives
In order to analyze the impact of shop opening hours deregulation we first had to recon-
struct the regulatory framework that applied to each Italian municipality over the period of
interest. To do this we collected the relevant regional legislation and examined the admin-
istrative acts adopted by all regional governments between 1998 and 2011 so as to identify
5
In the implementation of these new rules concerning entry, some regions imposed a more restrictive
interpretation of the provisions of the Bersani Decree. Such cross-regional variation has been exploited by
Schivardi and Viviano (2011) to estimate the impact of entry barriers on productivity. Note however that
such different strictness in the application of the Bersani Decree was unrelated to the characteristics of the
municipalities that determined the shop opening hours regime applicable.
6
In all cases the regional regulations could not impose limits more rigid than the national-level benchmark
discipline.
10the municipalities that were granted the “touristic” status at some point in time.7 On top
of recovering the list of touristic municipalities, we also checked whether, according to the
regional law, the qualification of a municipality as touristic allowed shops to open 365 days
a year or whether some restrictions were imposed at the regional level.8 We were not able
to gather information on three regions: Liguria, Toscana and Umbria, which we are forced
to exclude from the analysis.9
The dataset comprises two subsets of municipalities: i) the fully deregulated i.e., those
located in regions where regional laws did not provide any restriction to Sunday and holiday
openings, and ii) the partially deregulated i.e., those subject to some time or spatial restric-
tion. In Figure 1 we plot the fraction of fully and partially deregulated municipalities by year.
The figure highlights the process of gradual deregulation to which Italian municipalities were
subject until the complete deregulation passed at the end of 2011.10
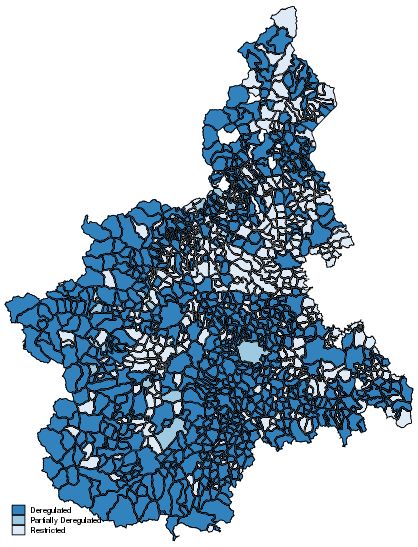
To give an idea of the regulatory regime in place before the enactment of the full dereg-
ulation, in Figure 2 we show the maps of Piedmont and Lazio - two of the biggest regions in
Italy - in 2010: dark blue areas correspond to touristic areas, whereas light blue marks the
partially deregulated municipalities; finally, grayish areas are relative to not touristic
municipalities (i.e., restricted). The difference between the two plots highlights the distinct
regulatory approaches followed by the two regional authorities: while in Piedmont we do not
record regional-level limitations to liberalization, in Lazio there were limitations in place at
the central level, therefore the fully deregulated status represented an exception to the
general rule.
7
The regional legislation is published on the institutional websites of the regional governments. This is
also the case for some of the administrative acts under consideration; for the others, we required the regional
administrations to disclose them upon request.
8
There were several regions with limitations in terms of time - e.g., stores were allowed to open up to a
maximum number of Sundays during the year - or space (typically, vast municipalities were deregulated in
their central neighborhoods only).
9
In these regions the “touristic” status was autonomously decided by the municipalities themselves with
local administrative acts.
10
In Table B.1 we report the number of municipalities which transited from the “non-touristic” to the
touristic status, per year and region, and the relative share on the total number of regional municipalities in
parentheses.
11We merge the municipality-year data on the regulatory framework with the Asia database,
from 2007 to 2016.11 Asia is an administrative dataset containing information on the total
number of workers and plants by year and sector of activity at the municipal level; it also
contains information on firms size - in particular, the data on both the number of plants and
the number of workers, is split into large (≥ 3 workers) and small plants (< 3 workers).12 The
final dataset is a balanced panel of 6,710 Italian municipalities that reports the touristic
status, the number of workers and plants in the retail sector (total and split between small and
large plants), plus socio-demographic variables taken from the latest available Census
(2011).
In Figure 3 we plot the variation in the number of retail workers (left) and establishments
(right) between 2007 and 2016. Alongside country-level measures, we also separately plot the
figures for large and small firms. We document a general decreasing trend starting after the
financial crisis of 2008 and the sovereign debt crisis of 2011, which translates in a 5%loss in
terms of number of workers and in a loss of about 10% in terms of total plants in 2016 relative
to 2007 countrywide. The effect, however, is composite, and reflects the deep changes which
characterized the market structure of the retail sector. While large firms show a discontinuous
pattern, with an expansion until 2009/2010, followed by a retraction until 2014, and a
renewed growth until 2016, small firms alternated harsh declines to periods of relative
stagnation, in both dimensions. As a result, over the period of analysis the market share of
large firms has increased at the expense of small and individual firms, and in most cases they
have taken the lead in driving the recovery.
The patterns observed were significantly different across macro-areas: in Figure 4 we pro-
vide some descriptive evidence on geographical differences, separately considering northern,
central and southern regions. For large and small firms we report the number of workers
11
Asia (Registro Statistico delle Imprese Attive), Istat.
12
The median plant size for the retail sector over the period of observation is 4.4.
12and plants per inhabitant, 2007-2016. First, the figures reveal significant and persistent
differences between the South and the rest of the country: the rate of employment in the
retail sector is about 23% lower in the South relative to the North; on the other hand, the
overall number of plants per inhabitant is quite similar but its composition differs signifi-
cantly, shops in the South being predominantly small. Secondly, as for the dynamics, we
observe that all macroregions recorded sizeable drops in both employment and the number of
plants over the period, with the trend being driven by small firms. The South experienced a
partially different pattern, with a stable employment level in retail, but with its composition
changing in favor of large plants.
4 Empirical Strategy
The application of the touristic status, the time and spatial limits, and the national-level
deregulation introduced with the 2011 reform provide exogenous variation in the regulatory
framework at the municipal level that we exploit for identification in a (dynamic) difference-
in-differences or event study setting (Autor, 2003). In particular, we are able to quantify the
effects of extended opening hours and Sunday opening on measures related to employment
on the one hand (e.g., number of workers in the retail sector), and on the market structure
on the other (i.e., total number of plants and size distribution) in the main analysis.
The existence of a subset of municipalities with limited or no prior restrictions on opening
hours (the touristic municipalities) allows us to cluster our sample in three groups: first, the
control group which includes all the municipalities that, at the beginning of our period of
analysis (2007), were already fully deregulated; second, the treatment group, which comprises
all municipalities where the restrictions were totally repealed at some point in time between
2007 and 2016;13 third, the partial control group, made of all touristic municipalities which
13
86% of these were deregulated in 2011 with the erga omnes act, while the others entered the list of
touristic municipalities in the preceding years. Only the municiaplities of Veneto and Trentino Alto-Adige
were deregulated in 2013 due to a late reception of the norm (Figure B.1).
13were deregulated only partially, and whose regulatory status was only partially affected by
the 2011 reform.
In Table 1 we present descriptive statistics for the three groups at the beginning of the
period analyzed (2007). The figures suggest that the three groups of municipalities are rather
different. Those in the control group are small but relatively rich: they display the lowest
levels of economic activity in the retail sector (both in terms of total workers and plants and
for small and large units separately), the smallest population and surface, but the highest
average income and the lowest unemployment rate. Municipalities in the partial control
group, instead, are on average those with the highest number of workers and plants in the
retail sector, the largest population and surface and the highest level of human capital (which
we proxy by the share of graduates). This group, indeed, includes all the largest cities in Italy,
(e.g., Rome, Milan and Naples) where the deregulation applied to the shops located in the city
center only.
In order to identify the effect of the deregulation of opening hours, we employ a model
which is flexible enough to exploit the variation in time provided by the treatment at the
municipal level on the one hand, and to correctly sort out the cross-sectional (i.e., municipal)
differences on the other. The resulting estimating equation reads:
Yit = α + β Liberalizationit + µi + τt [ + ψr,t ] + εit (1)
where Yit = [(log)workersit , (log)plantsit ], Liberalizationit is an indicator function for
municipality i in year t being (fully) deregulated, and τt and µi are year and municipality
fixed effects, respectively. ψr,t are region-year fixed effects which we include for robustness
to additionally control for potential regional trends. The parameter of interest - β - captures
the differential changes in Yit due to the deregulation. As the norm was offering only the pos-
sibility for shops to stay open longer hours, the coefficient of interest is yet to be interpreted
as an Intention To Treat (ITT) effect of Sunday Openings or Average Treatment effect on
14the Treated (ATT) of the deregulation. Standard errors are clustered at the municipal level,
that defines inclusion into the treatment or control group.
Note that our approach differs from a standard Diff-in-Diff in that we are using as control
group the “always treated”. Such design, already applied in several notable papers (Kotchen
and Grant, 2011; Chemin and Wasmer, 2009), follows a methodology that has been labeled
as “Difference in differences in reverse” (DDR) by Kim and Lee (2019). As for the standard
Diff-in-Diff setting, the only assumption required for the DDR to hold is that, absent the
treatment, the control and treatment groups would follow a parallel trend, indeed, the two
strategies yield exactly the same result as long as time does not affect differently treated and
untreated units.14
In the main analysis, we restrict the estimation sample to the treatment and control
groups, leaving the analysis of the partial control group as a robustness check (Section
5.2). The space and time limitations that applied to the partial control units make such
municipalities unsuitable for both being part of the treatment and of the control groups.
Indeed, the deregulation of 2011 represented an actual treatment for them, but its “intensity”
changed according to the initial limitations in terms of space or time.15
5 Results
5.1 Main results
In Table 2 we present our baseline results. In columns (1)-(2) we report the estimates of the
liberalization effect on the number of workers, and in columns (3)-(4) those on the number
of plants in each municipality. As both outcomes are expressed in logarithmic scale, the
estimated coefficients are to be interpreted as semi-elasticities. In columns (1) and (3) we
include municipality and year fixed effects, the resulting estimated effect of liberalization in
14
See Appendix A for a more formal discussion.
15
For example, in a municipality with a maximum of 32 Sunday openings allowed, the deregulation would
have had an “intensity” of 52 - 32 = 20, with 40 initial Sunday openings it would have amounted to 12, and
so on.
15the newly liberalized municipalities is a 3.4% increase in the number of individuals working
in the wholesale and retail sector, and a 2.1% increase in the number of shops.
The magnitude of these effects is lower, respectively 2.1% and 1.6%, but still significantly
different from zero when we impose the more demanding specification with region-year fixed
effects to account for local idiosyncratic shocks (columns 2 and 4).
Note that the validity of our difference-in-differences relies on the assumption that, absent
the treatment, the difference in outcomes between control and treatment groups would have
been constant over time (Parallel Trend Assumption, PTA). In order to test this assumption,
we run an event study type of analysis à la Autor (2003); more specifically, we interact the
treatment group indicator with time-to-treatment binary indicators, from t − 5 (i.e., five years
before the treatment) to t + 9, and regress the outcome variable(s) on them. To satisfy the
PTA, we require no parameter for terms before the treatment to be significantly different from
zero.
In Table 3 we report the estimated parameters, with the baseline (excluded) year at t − 1.
We present the results for both specifications - i.e., with (columns 1 and 3) and without
(columns 2 and 4) region-year fixed effects. The results confirm that the estimated coefficients
are null before the liberalization and become positive as soon as the municipality is liberalized
(time t), for both specifications. The one with year and municipality fixed effects only returns
two negative coefficients before the liberalization date, thus signaling that there may be some
concerns in terms of diverging trends; yet, the more demanding specification with region-year
fixed effects reassures us that any pre-existing difference between the two groups of
municipalities is correctly accounted for. On the other hand, the coefficients after the
treatment turn out to be constantly positive, thus suggesting that the treatment effect is
permanent - or, at least, long-lasting. The low level of statistical significance for any t > t+4 is
due to the fact that the number of treated units shrinks a lot as we increase the distance from
the treatment (Duflo et al., 2008).16
16
Only the municipalities that were deregulated before 2011 would be observable five or more years later
16In the spirit of Autor (2003), Figures 5 and 6 provide graphical evidence supporting the
absence of pretends that may bias the estimations. Following Dobkin et al. (2018), in the
graphs we also plot the counterfactual trend, i.e., the one that would have been observed in
the absence of the deregulation. This is a simple linear trend imputed on the basis of the
coefficients estimated before the treatment. This exercise confirms that the treatment effects
estimated after the liberalization are all significantly different from zero and from the imputed
counterfactual trend.
5.2 Robustness Checks
Our baseline results shall be interpreted as the effect of moving from a regime of strictly
regulated opening hours to one of fully flexible hours - i.e., 24/7. There are several munic-
ipalities, however, which already enjoyed forms of liberalization limited in time, space, or both
(the partial control group). For those cases, we would still expect a positive effect of the full
liberalization, but to a lesser extent: in Table 4, columns 1 and 6, we run the esti-mation on a
sample that includes the partially deregulated units within the control group, so as to estimate
the effect of being granted fully flexible opening schedules versus being subject to any type of
restrictions. As expected, the estimated coefficients are smaller in magnitude: in our preferred
specification the effects of being fully liberalized amount to 2.2%extra employment and to
1.1% extra plants in the wholesale and retail sector.17
We then propose a battery of robustness checks aimed at ensuring that all results obtained
do not depend on the specification, sample, or identification strategy chosen.
in our sample. Symmetrically, only the municipalities deregulated in 2013 (those in Veneto and Trentino Alto-
Adige, Table B.1) can be observed at t − 5.
17
Similarly, in Appendix Table B.2 we replicate our estimates including the “partial control” group in the
treatment group instead. Again, the results we obtain are smaller in magnitude than those of our baseline
exercise and closer to the ones in Table 4.
17A prime concern is that selection into the pool of touristic municipalities may have been
somehow endogenous - e.g., because the municipalities which could gain the most from
the liberalization had the highest incentive to lobby the regional authorities, or because
these took the potential gains in the retail sector into account in selecting the touristic
municipalities. If this were the case, our results could turn out to be significantly upward
biased. To rule out this possibility, in columns 2 and 7 we restrict our treatment group to the
municipalities that were subject to the main wave of liberalization i.e., at the end of 2011.
The new treatment group amounts to about 75% of the full group, but with this selection
we are able estimate a classical 2 × 2 difference-in-differences model:
Yit = α + β (T reatedit × P ost 2011it ) + γ T reatedit + δ P ost 2011it + εit (2)
If it was the selection effect that drove our baseline estimates, we should find lower or no
effect with the 2011-only sample: instead, the estimated coefficients are sensibly larger than
the baseline, and strongly significant.18
The next robustness check that we perform directly addresses the concern that structural
differences between the municipalities in the treatment and in the control group may be
driving our results. To this end, we estimate a propensity score model to weight the control
group during the estimation, using the municipality’s population, the share of graduates
and the local unemployment rate, all measured in 2011, as predictive variables. The results,
reported in columns 3 and 8, are in line with the baseline model and, if any, they show a
slightly larger magnitude.
An additional test of robustness follows the approach introduced by Goodman-Bacon
(2018). The proposed method addresses the concern that the treatment effect estimates
may be biased when units are treated at different points in time. In those cases, as the
author argues, the parameter of interest should be a weighted average of all possible two-
18
Moreover, in Appendix Table B.3 we estimate our baseline model restricting the sample to the pre-
2012 full deregulation. In this case the treated municipalities are those that were deregulated between 2007
and 2011 and the control ones are the ones that were then deregulated in 2012 and thus at the time were
not treated. This more standard exercise produces positive but not statistically significant coefficients of a
slightly smaller magnitude. Again, this points against the existence of an ex-ante selection into treatment.
18group/two-period difference-in-differences estimators in the data, provided that the PTA
holds for each estimation subgroup.19 In columns 4 and 9 we present the estimates obtained
with the Goodman-Bacon estimator, which are extremely robust.
In columns 5 and 10, finally, we add a battery of fixed effects at the treatment group-
year level. This allows us to absorb any possible trend that might have affected treated and
control municipalities differentially: still, the baseline results hold.
5.3 Heterogeneous effects
While the baseline results are informative on the average effect of the deregulation, to better
inform the policy implications of the reform we are interested in exploring the differentials of
such effects depending on several firm and local market characteristics.20
First, in Table 5, columns 1 and 2, we separately estimate equation (1) for municipalities in
the Center-North and in the South of Italy. We are forced to bind together central and
northern regions because our data for the Center are incomplete and most regions opted for
partial liberalizations. The results reveal that the effect on both employment and plants has
been stronger for central and northern regions. In particular, we estimate the effect on
additional workers and plants in the Center-North to be one third higher (+3.5% versus
+2.4%) and more than double (+2.5% versus +1.1%) that in southern regions. In turn, this
evidence seems to suggest that the size of the plants increased more sensibly in the South,
whereas in the North this was also accompanied by an increase in the number of shops.21
In the context of a progressive sectoral recomposition in favor of larger plants, i.e., a
19
Note, however, that the 2011-only exercise that we perform, being a simple 2×2 difference-in-differences,
already partially addressed this issue.
20
In Appendix table B.4 we run the same estimates controlling for Region-Year fixed effects, the estimated
coefficients are qualitatively similar but more imprecisely estimated because of the smaller sample size.
21
In Appendix Table B.5, we provide support to this result by using data on employment and number and
total surface of large chain store units provided by the data analytics company Nielsen. More specifically, we
find that the increase in chain stores employees and plants was driven by units in the Center-North (while we
don’t find significant effects in southern regions).
19declining trend for the small shops and a growing presence of large chain stores,22 it becomes
of first-order importance to understand whether the liberalization affected the two types of
firms differently thus mitigating or accentuating the gap. In columns 3 and 4, we repeat
the baseline exercise on the number of workers and plants for small and large firms (i.e.,
below or above three workers). We find that the increase was higher for large plants (+3.6%
and +2.5% for workers and plants, respectively) than for small shops (+2.2% and +1.8%),
although both significantly different from zero. In subsection 5.4 we extend our results to
account for possible geographical spillovers, which may display differently in the case of large
and small shops, and show the robustness of the results to this dimension, too.23
Finally, we estimate the effects along the distribution of municipalities’ size. In columns
5 and 6, we split our sample in small (i.e., < 5, 000 inhabitants) and large towns and find
that in small centers the liberalization effects were slightly stronger than in the larger ones
(i.e., +3.6% against +2.4% in terms of workers, and +2.1% against +1.6% for plants). As
for the case of plant size heterogeneities, again in this case, our results may be biased by
potential spillover effects that differently affect small and large towns.24 In the following
paragraph we directly tackle this issue so as to corroborate the proposed model.
5.4 Spatial spillovers
Potential spillover and relocation effects of place-based policy interventions have been widely
documented in the fields of regional science and urban economics (Glaeser and Gottlieb, 2008;
Monte et al., 2018; Ehrlich and Seidel, 2018; Falck et al., 2019)), as well as in industrial or-
ganization (see, for instance, applications to public procurement in Branzoli and Decarolis
22
see e.g. Ciapanna and Rondinelli (2014).
23
For example, consider the case of a potential customer living in a non-deregulated municipality: she
would be more willing to move to a nearby deregulated municipality (i.e., to pay the transportation and the
opportunity costs) in order to shop in a large department store than to shop in a small, family-owned unit.
If this is the case, the estimates of the effect on large firms may be downward biased.
24
For example, small towns, mostly those surrounded by bigger, and liberalized centers, might potentially
enjoy additional benefits from retaining the demand previously absorbed by the neighbors. Our estimated
coefficient for small towns would then be upward biased.
20(2015) and Conley and Decarolis (2016)). The displacement effects induced by the differences
in regulation across neighboring municipalities may affect our results in two main ways. On
the one hand, if sellers chose to relocate their shops from restricted to liberalized municipal-
ities, our estimate of β would be downward biased, given that the demand of treated units
would already be met, at least partially, by sellers located in nearby municipalities. On the
other hand, even if sellers do not adjust their location choices according to the liberalization
status, buyers may adjust their consumption choices by traveling to nearby municipalities to
go shopping. In such case our estimates would be upward biased: in fact, once the shops are
allowed to open flexibly in the municipality of residence, individuals will switch suppliers
opting for the local ones (i.e., will minimize transaction costs). In turn, this would shift down
employment in the control municipalities and increase it into the treated ones without a real
increase in the overall sector size. In the light of such reasonings, it becomes of utmost
importance to find out whether the estimated coefficients result from a geographical shift of
the retail activities or whether they represent an effective boost of the sector.
In order to ensure that our results are not biased by spillover, displacement or relocation
effects, we propose three different strategies. First, we aggregate our data in larger adminis-
trative units, whose boundaries are designed to be big enough as to “contain” the spillovers,
and repeat the estimation. Second, we exclude all control units with a shared boundary with a
treated municipality, as these are potentially more affected by local relocation - “spatial
exclusion approach”, Ehrlich and Seidel (2018). Third, in order to directly estimate the
magnitude of the spillover effects, we augment our difference-in-differences with variables
reflecting the number and composition of neighboring municipalities, before and after the
deregulation (Table 6).25
The first exercise to account for local spillovers consists in aggregating the data at the
Local Labor Market (LLM) level. LLMs are self-contained labor markets where most of
25
The same empirical approach to the difference-in-difference method in the presence of spillover effects
has been independently developed by Berg and Streitz (2019). In their paper, they show the consistency of the
method and quantify the bias in the baseline estimation without accounting for the spillover effects.
21the people live and work26 and therefore are the most suited geographical units to examine
labor market effects (e.g., employment, consumption) of local shocks accounting for possible
spatial spillovers. Each LLM contains both control and treated municipalities - hence, the full
sample cannot yield a binary treatment. Therefore, for each LLM (and year) we compute
the share of population living in deregulated municipalities (QLLM,t ) and proceed with a
slight modification of the estimation model, which now reads:
YLLM,t = α + β QLLM,t + µLLM + τt + εLLM,t (3)
However, we are able to identify a subset of Local Labor Markets in which either all the
municipalities were deregulated in the same year or all the municipalities were deregulated
before 2005. This distinction allows us to run the baseline equation at the LLM level,
although on a restricted sample:
YLLM,t = α + β LiberalizationLLM,t + µLLM + τt + εLLM,t (4)
The results of the two exercises are reported in columns 1-4 and 2-5 of Table 6, re-
spectively. We find that when all municipalities in a Local Labor Market are liberalized,
employment in the retail sector increases by 3.1% and the effect is even larger in our cleanest
identification strategy (3.7%). On the other hand, we find a small and not statistically sig-
nificant effect on the total number of shops in the area, suggesting that shops increased their
scale of activity (intensive margin), but did not increase their number (extensive margin).
In columns 3 and 5, then, we re-estimate our baseline model excluding the control units
that directly neighbor the treated ones. Note that the sample size shrinks very little because
in our setting the number of control units was sensibly smaller than that of the treated ones.
The resulting estimated coefficients are slightly smaller with respect to the baseline model:
2.7% and 2%, respectively for workers and plants.
26
Each LLM contains about 13 municipalities on average, with significant variability depending on the
accessibility of the area. The boundaries of each LLM are released by the National Statistical Office based
on the so-called commuting matrix, which account for the number of workers commuting from and to each
location in the country.
22In our setting, we see two possible spillover effects at play, depending on the status of the
municipality: first, shops in liberalized municipalities may capture part of the demand from
neighbor municipalities (baseline spillover ). These are stronger for restricted municipalities;
however, once liberalized they would be able to regain part of that demand (spillover on
the treated ). The substantial robustness of the liberalization parameter in our LLM-level
exercises indicates that the sum of the spillover effects within a given LLMs is essentially
null. In turn, this could either mean that the spillovers are in fact negligible, or that the
spillover effect on the treated fully offsets the baseline spillovers. In order to disentangle
these counteracting effects, we augment the baseline model of Equation (1) with the variable
lib neighit , which measures the number of control municipalities that are contiguous to the
ith municipality at each time t, and with its interaction with the liberalization variable.27
The resulting model reads:
Yit = α + β liberalizationit + µi + τt
+ γ t lib neighit + γ tt (lib neighit × liberalizationit ) + εit (5)
where γ t captures the effect on the ith unit of being surrounded by one extra liberalized
municipality (baseline spillover ), while γ tt , by capturing the interaction of liberalized neigh-
bors and the liberalization treatment, provides the estimate of the spillover on the treated.
Through model (5), we are able to disentangle the direct effect of the deregulation from that
induced by relocation.28 The results in columns 4 and 8 show that the baseline spillovers
have positive sign, i.e., the liberalized neighbors do in fact steal demand from their neighbors,
but i) it only applies to the most mobile input, the workers, ii) the magnitude of the effect
is very small compared to the direct treatment effect (in the order of one tenth of the direct
effect for every already liberalized neighboring municipality), and iii) the effect is almost
completely offset by the spillover on the treated (more formally, γˆt + γˆtt = 0).
27
The estimated effects are identified thanks to the staggered implementation of the liberalization, which
affects both the status of the ith unit and that of its neighbors at different points in time.
28
See Appendix C for a more detailed discussion of the implications of this model.
23In Table 7, we replicate all these analyses of the spillover effects splitting our sample into
small/large plants and small/large towns (respectively in panel A and panel B). The first
exercise shows that the positive effect of the deregulation was largely concentrated across
larger plants, while the second reveals no significant differences between the effects for small
and large towns.
In turn, the positive, significant and robust estimates of the treatment effect for all
variables and subsamples confirm that the liberalization had net positive effects that go well
beyond the simple geographical recomposition of the demand.
5.5 Sectoral spillovers
We finally consider the possibility that the deregulation of shop opening hours may induce
spillover effects on sectors other than the retail. To explore this channel we estimate the
baseline model on the number of workers and plants in sectors other than wholesale and retail
trade. In our view, this exercise is both a robustness check, to the extent that we should not
find any effect on the sectors that were not affected by the deregulation, and a test for possible
spillover effects. Indeed, there are sectors that were indirectly affected by the liberalization of
the retail sector either positively - it is the case for sectors complementing retail activities - or
negatively, if workers and entrepreneurs are induced to flee from a given sector towards retail
activities. In figure 7 we plot the estimated coefficients for each sector of economic activity.
Our results show that the deregulation of shop opening hours generally generated no effect
on employment in other sectors. Interestingly, yet, we find that employment increased
significantly in the sector of hotels and restaurants, thus suggesting that these activities
benefited from the fact that more shops were open at night or on Sundays. If we consider
24the effects on the number of plants, instead, we find evidence of a significant increase in the
number of banks and other financial sector’s branches. This may also be due to a general
increase in the volume of economic activity.
As a final exercise, in Table 8 we estimate the effect of shop opening hours deregulation
on overall employment and number of plants. We present results for three specifications:
the baseline model in (1), and the two specifications estimated at the Local Labor Market
level (equations (3) and (4)). All specifications include sector-year fixed effects to account
for sector-specific shocks. We find a positive and significant increase in the level of overall
employment in the economy in the order of 1.5% and no effect on the total number of plants,
the effects being robust across the three specifications.
6 Individual-level evidence
In this section we complement the main analysis with evidence at the individual level in order
to better qualify the type of employment relationships created and the type of workers
involved in the transition, i.e, the compositional effects of the deregulation. To this pur-pose,
we use the data from the Italian Labor Force Survey (LFS) which contains quarterly
individual and household level information on education, employment history and demo-
graphic characteristics. We merge the LFS data with an augmented (i.e., quarterly) version of
the dataset on retail deregulation used in the main analysis, exploiting information on
household’s municipality of residence to match the two.29
Table 9 reports the main descriptive analysis of the sample in 2007, before the deregulation
of treated municipalities. It confirms the evidence in Table 1 for which individuals living in
treated municipalities are on average more educated than those in the control group (but less
than those in the partial control group) and that the overall employment rate
29
Note that we do not have information on the municipality where individuals work. This may bias our
results to the extent that we may misclassify individuals into treatment and control groups. On the other
hand, the municipality of residence is less subject than that of work to endogeneity concerns.
25is lower. Among the workers of the retail sector, the share of self-employed higher in the
control municipalities where workers, before the treatment, were also more likely to work
on Sundays. Focusing on the employees only, we observe that in the already deregulated
municipalities they were generally more likely to hold a permanent work contract and were
paid slightly higher wages.
In this setting, our empirical specification will necessarily differ from the baseline speci-
fication in (1), because the LFS design does not require to survey households in all munici-
palities in all years. In fact, each wave covers about 1,200 municipalities and they rotate, in a
way that smaller municipalities change from one quarter to the other.30 This structure of the
data does not allow us to run regressions with municipality fixed effects, and we resort to a
specification with LLM fixed effects. The resulting estimating equation reads:
Yilq = α + β Liberalizationlq + Xilq + λl + τq + εilq (6)
where Liberalization is defined as before, λl and τq are LLM and quarter FE, respectively,
and Xilq are individual-level characteristics.31 The estimates are reported in Table 10.
The main outcome of interest (columns 1 and 2) is an indicator variable for whether
individual i, residing in municipality m in quarter q is employed in the retail sector or not,
the latter option including both non employment and employment in other sectors. Results
are consistent with those of the main analysis: the deregulation of shop opening hours
induced an overall increase in the probability of being employed of about 0.2 percentage
points. Given the share of individuals who are employed in the retail sector (i.e., roughly
30
The survey is designed as to build a representative sample of the whole population in each quarter
-hence, large municipalities are always surveyed, whereas small and very small towns appear occasionally.
31
In our main specification, we include an indicator function for the gender, the age, the age squared, and
indicator functions for the education level.
265%), we estimate a marginal effect of around 4%, qualitatively similar (slightly larger) to the
one reported in Table 2. The result is strongly robust to the inclusion of individual control
variables.32 Second (column 3), we restrict our analysis to employed individuals only and
estimate a model of workers’ relocation, i.e. whether the reform induced a change in the
sectoral composition of employment in the affected municipalities. We find that, conditional
on being employed, the probability of holding a job in this sector rose by 0.8 percentage points.
The evidence presented in Section 5 suggested that the deregulation favored a recompo-
sition of the sector towards larger plants. This should correspond, at a micro level, to an
increased probability of being an employee instead of self-employed. In column 4, thus, we es-
timate Equation (6) on an indicator function for being self-employed conditional on working
in the retail sector, and find that the deregulation lowered the share of self-employed among
retail sector workers by about 1.6 percentage points (about 7 percent). In line with this result,
in column 5, we also find that the probability of working in a chain store increased.33 Finally,
in column 6, we test whether the deregulation further induced a recomposition of the sector
towards permanent or fixed term employment relationships. The results suggest no significant
change in this respect.
We then focus on the intensive margin and test whether the deregulation affected the
likelihood of working on Sunday and the total number of hours worked weekly.
In panel A we show the estimates of the likelihood of working on Sunday. This is, in a
way, a test of the degree of compliance to the the reform. We find that overall the share of
retail sector workers working on Sundays rose by 3.4 percentage points from a baseline
probability of 19%. Employees were more affected than the self-employed (+5 p.p. vs. 2.3
p.p.). Coherently with this, we also find that those working in large multi-branch stores
32
In Appendix Table B.6 we report some heterogeneous effects of the estimation of Equation (6). We
find a stronger increase in participation for men, individuals aged over 25 and those with less than tertiary
education.
33
LFS data do not contain an indicator variable for being employed in a chain store. We proxy this
variable with the interaction between the indicator for stores with multiple branches, and with 10+ workers.
27You can also read