Quick charging the share prices - Faster EV adaptation can generate EUR 806 billion more equity value - Transport & Environment
←
→
Page content transcription
If your browser does not render page correctly, please read the page content below
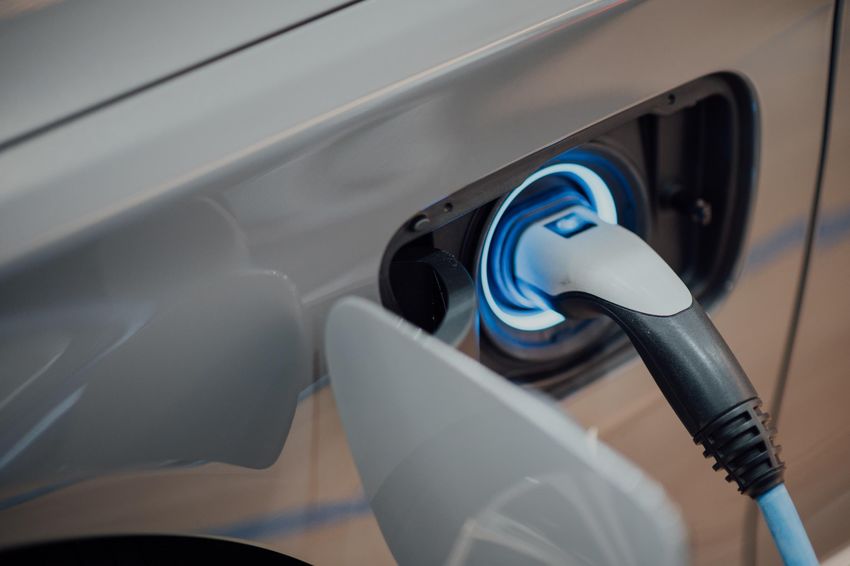
Quick charging the
share prices
Faster EV adaptation can generate
EUR 806 billion more equity value
Ender Kaynar, Gerard Rijk
19 May 2022
About this report
This report has been commissioned by Transport & Environment. The study aims to demonstrate
the potential value generation for auto manufacturers that quickly transitions to electric vehicle
business as opposed to slower strategies.

About Profundo
With profound research and advice, Profundo aims to make a practical contribution to a
sustainable world and social justice. Quality comes first, aiming at the needs of our clients.
Thematically we focus on commodity chains, the financial sector and corporate social
responsibility. More information on Profundo can be found at www.profundo.nl.

Authorship
This report was researched and written by Ender Kaynar and Gerard Rijk. Correct citation of this
document: Ender Kaynar, Gerard Rijk (2022, April), Quick charging the share prices, Amsterdam, The
Netherlands: Profundo.
Front page cover photograph by CHUTTERSNAP - Unsplash.

Acknowledgements
The authors would like to thank T&E for providing relevant data.
Disclaimer
Profundo observes the greatest possible care in collecting information and drafting publications
but cannot guarantee that this report is complete. Profundo assumes no responsibility for errors in
the sources used, nor for changes after the date of publication. The report is provided for
informational purposes and is not to be read as providing endorsements, representations or
warranties of any kind whatsoever. Profundo will not accept any liability for damage arising from
the use of this publication.
Contents
Summary and conclusion ........................................................................................................... 5
Abbreviations ........................................................................................................................... 13
Introduction ............................................................................................................................. 14
                    Profiles and strategies........................................................................................ 15
      1.1.1         Volkswagen Group ......................................................................................................... 15
      1.1.2         Toyota Motor Corporation ............................................................................................. 15
      1.1.3         Stellantis ......................................................................................................................... 16
      1.1.4         Mercedes-Benz ............................................................................................................... 16
      1.1.5         BMW Group ..................................................................................................................... 16
      1.1.6         Volvo Cars ....................................................................................................................... 17
                    ICE versus EV production costs .......................................................................... 18
      2.1           Production costs comparison ....................................................................................... 18
      2.2           Rising commodity prices delay the decline in production costs ................................ 19
      2.3           Tesla as the reference.................................................................................................... 19
                    Methodology for scenario analysis...................................................................... 21
      3.1           SOTP and DCF analysis ................................................................................................. 21
      3.1.1         Valuation methodologies ............................................................................................... 21
      3.1.2         DCF methodology ........................................................................................................... 21
      3.1.3         Operating margin estimation methodology.................................................................. 22
      3.2           Estimating value creation potential from faster EV adaptation .................................. 23
      3.3           Comparison..................................................................................................................... 23
                    CO2 emissions in valuation models ..................................................................... 24
      4.1           Introduction – Investors will discount uncertainties of ICE future ............................. 24
      4.2           Carbon cost/liability methodology ................................................................................ 24
      4.2.1         Calculating with a margin impact versus introduction of a liability............................ 24
      4.2.2         The introduction of a liability ......................................................................................... 26
                    Case study Volkswagen ...................................................................................... 28
      5.1           Forecasting, scenario and valuation methodology and assumptions ........................ 28
      5.1.1         Total vehicle sales and EV adaptation assumptions ................................................... 28
      5.1.2         Vehicle sales price assumptions................................................................................... 29
      5.1.3         Investment and operating cost assumptions............................................................... 30
      5.1.4         Other assumptions for valuation ................................................................................... 34
      5.2           Results excluding carbon liability .................................................................................. 34
      5.3           Results including carbon costs ..................................................................................... 36
                    Results for Toyota, Stellantis, Mercedes-Benz, BMW and Volvo Cars................... 37
      6.1           Toyota: The laggard within the mass market in EV adaption ..................................... 37
      6.2           Stellantis: The newly merged FCA and PSA offers the highest upside in mass market
                    ......................................................................................................................................... 37
      6.3           Mercedes-Benz: Best potential in luxury segment ....................................................... 38
      6.4           BMW: Slowest within luxury segment ........................................................................... 39
6.5 Volvo-Cars: Fastest EV adopter..................................................................................... 39
Trading Multiples Analysis ................................................................................. 41
Conclusions ....................................................................................................... 43
References ............................................................................................................................... 45
List of figures
Figure 1 Production cost comparison, C segment EV vs. ICE (2020, EUR thousand) ........... 18
Figure 2 Production cost projection, C segment EV vs. ICE (2025, 2030, EUR, share in
total) .................................................................................................................. 19
Figure 3 VW: Unit sales price projections for EV and ICE ................................................... 30
Figure 4 VW: Base case operating margin estimates......................................................... 32
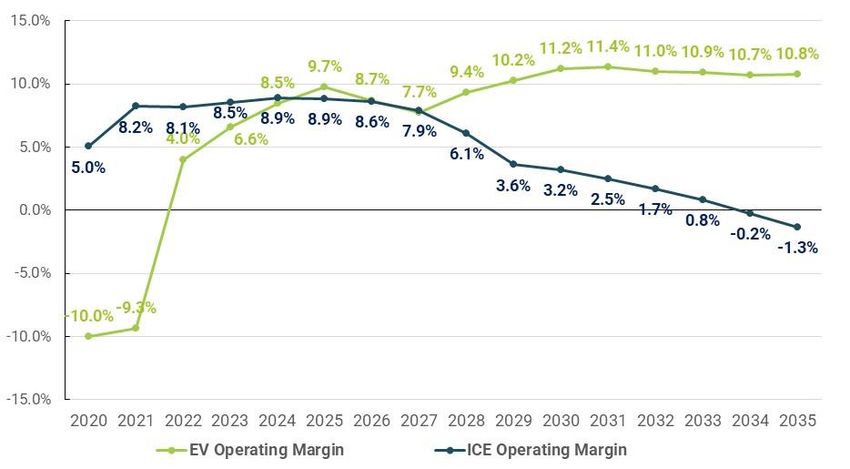
Figure 5 VW: Slow case operating margin estimates ......................................................... 33
Figure 6 VW: Quick case operating margin estimates ....................................................... 33
Figure 7 Target market value for Volkswagen vs current valuation .................................... 35
Figure 8 Carmakers’ trading multiple vs. household appliances sector’s ........................... 42
List of tables
Table 1 Volkswagen: Summary of model assumptions and results .................................... 6
Table 2 Toyota: Summary of model assumptions and results ............................................ 8
Table 3 Stellantis: Summary of model assumptions and results ......................................... 9
Table 4 Mercedes-Benz: Summary of model assumptions and results ............................. 10
Table 5 BMW: Summary of model assumptions and results ............................................. 11
Table 6 Volvo Cars: Summary of model assumptions and results .................................... 12
Table 7 VW: Company Metrics ........................................................................................ 15
Table 8 Toyota: Company Metrics ................................................................................... 15
Table 9 Stellantis: Company Metrics ............................................................................... 16
Table 10 Mercedes-Benz: Company Metrics ..................................................................... 16
Table 11 Company Metrics ............................................................................................... 16
Table 12 Volvo Cars: Company Metrics ............................................................................. 17
Table 13 Tesla: Operating figures ..................................................................................... 20
Table 14 Calculation methodologies for DCF items............................................................ 21
Table 15 Average CO2 emission per produced cars ............................................................ 26
Table 16 Example VW: Emission liability in Enterprise Value in Base Case ......................... 26
Table 17 VW: Summary of sales volume and EV adaptation assumptions........................... 28
Table 18 VW: Calculation of reference 2021 EV sales price (EUR) ...................................... 29Table 19 VW: Total investments (R&D + CAPEX) as a % of sales ........................................ 30 Table 20 Volkswagen sum of the parts summary............................................................... 34 Table 21 Volkswagen sum of the parts summary with carbon costs ................................... 36 Table 22 Toyota sum of the parts summary....................................................................... 37 Table 23 Stellantis sum of the parts summary ................................................................... 38 Table 24 Mercedes-Benz sum of the parts summary ......................................................... 38 Table 25 BMW sum of the parts summary ......................................................................... 39 Table 26 Volvo Cars sum of the parts summary................................................................. 39 Table 27 Overview of current and implied EV/EBITDA multiples ......................................... 41 Table 28 Potential / Risk compared to current market value .............................................. 43 Table 29 Valuation study results by company and case (EUR mn) ...................................... 44
Summary and conclusion
A quick EV adoption by six legacy car manufacturers could trigger a EUR 806 billion
equity value enhancement versus a slow adoption. On top of inferior operational cash
flows, slow movers will probably face higher carbon emission liabilities due to larger ICE
car park heritage while quick movers phase-out ICEs. This might raise the value
enhancement to above one trillion euros.
   •   The car industry is entering into a major transition period from Internal Combustion
       Engine (ICE) technology to Electric Vehicles (EVs). Pioneered by the American car
       manufacturing start-up Tesla, the successful business case for EVs is now being adopted
       by almost all legacy car makers with different strategies and roadmaps. Among the
       producers mainly serving the mass market, Volkswagen (VW) and Stellantis are planning to
       reach at least 50% battery electric vehicle (BEV) sales by 2030. Toyota, despite being a
       leader in hybrid electrification, has a slower roll-out plan for BEVs and aims to reach 3.5
       million sales (approximately 30% of total) by 2030. Luxury car maker Volvo Cars has the
       quickest EV transition plan, planning to phase-out ICEs to go all-electric by the end of the
       decade whereas Mercedes-Benz plans to go-all electric by 2030 in markets where
       conditions allow.
   •   The outlook for the business success of EVs looks bright while ICEs can even see
       negative operating margins after 2030. Although the production costs and sales prices of
       EVs are currently at a disadvantage against ICEs, the expected fall in battery costs along
       with improving economies of scale, will help EVs reach price parity with ICEs. Although the
       battery prices and production costs are expected to rise in 2022, as a result of the war in
       Ukraine, the long-term projections of falling EV manufacturing costs are still intact. As
       evidenced by the development of the operating metrics of Tesla in recent years, EV
       business operating margins are expected to reach and even surpass that of ICEs in the next
       2-3 years. This while margins of ICEs are set to decline as the product with old technology
       loses bargaining power against the incoming product. Especially after 2027 where most car
       segments are expected to reach price parity, we estimate diminishing, even negative
       operating margins for ICE businesses.
   •   Quicker EV transition strategies can create c. EUR 806 billion higher value for companies
       and their shareholders compared to slow scenarios. Our in-depth case study for VW and
       valuation models for the remaining 5 companies clearly show that quicker rather than
       slower EV transition strategies are set to generate higher cash flows, meaning higher equity
       values for shareholders. On average, the quick case scenarios yielded 316% upside
       potential compared to current market values of the car makers whereas the slow cases
       were only 121%. While these results are derived from only the operational cash flow
       projections, possible carbon liabilities can change the valuations quite drastically. For
       example, the slow EV transition case without carbon costs for VW yields a target equity
       value of EUR 194 billion (104% upside potential) but when the EUR 275 billion carbon costs
       are included, the target value drops to negative EUR 82 billion, implying a complete wipe-
       out of the equity value.

                                                                                           Page | 5
• Operational cash flow and equity benefits of a quick shift to EV are further escalated by
huge uncertainty about ICE carbon liability. Adding a carbon liability is a good proxy for
differences in discount rate (WACC) between ICE and EV business and the differences in
reputation risk (ICE) and opportunities (EV). The carbon liability reflects the uncertainty
whether the manufacturer or the customer will bear the costs of increasing regulation and
carbon costs of an ICE car. The carbon liability will be relatively larger for slow-movers in
the switch to EV, while quick-movers will face a relatively low liability and thus lower
uncertainties. Thus, the equity valuation outcomes showing that operational cash flows
develop more favourable in a quick shift to EV, are further escalated by a much lower
carbon liability and/or uncertainty.
• The large difference between market values and the valuation results for the companies
stem from uncertainties and calculation methodologies. The main reason why even the
slow case results are higher (except for Toyota) than the current market values of
carmakers is that the investors (overall market participants) are discounting risks such as
the aforementioned carbon liabilities as well as the execution risk in case companies fail to
make the transition to the new technology that is electric mobility. This discount is also
evident in the trading multiples of automakers where the household appliances sector (with
no apparent carbon or any significant environmental risks) on average traded at a 64%
premium (12.7x EV/EBITDA) vs. carmakers average (7.8x) in the last 5 years. Considering
that a quick transition to EVs (and ICE phase-out) can lift the majority of the uncertainties,
the successful EV manufacturers can be valued with even higher multiples. Although the
current valuation of Tesla is hard to compare and not completely indicative for other
carmakers, the current EV/EBITDA multiple of Tesla is at 46.3x which would have been 3x
higher than the average valuation result of our quick case scenario. The second reason
behind the high valuation results is the long forecast period that has been used in DCF
models, where the methodology tends to result in high terminal values when a growing
business (the EV business) forecasted far into the future, in this case 2035. In contrast the
DCF methodology cannot completely reflect the value of a declining business (ICEs).
Additionally, long forecast periods in DCFs exaggerates the impact of different discount
rates (WACC) between companies, as in the case of BMW and Volvo Cars, where BMW with
a WACC of 4.8% has much higher valuation potential than Volvo Cars with 7.2% (higher due
to larger equity share in its liabilities). All in all, despite its limitations DCF is the only
methodology to use when valuing separated businesses (EV and ICE). The main aim of this
study is not to make highly accurate market value predictions but to demonstrate the
difference in potential and risks in quick and slow EV adoption cases. Table 1 through
Table 6 summaries operational estimates and valuation results of the six carmakers in this
study.
Page | 6Table 1 Volkswagen: Summary of model assumptions and results
Operations 2022 2023 2024 2025 2030 2035
Base 7.5% 11.0% 15.0% 21.0% 50.0% 72.5%
Share of EVs Slow 7.5% 8.0% 10.0% 12.0% 35.0% 40.0%
Quick 7.5% 11.0% 15.0% 25.0% 75.0% 100.0%
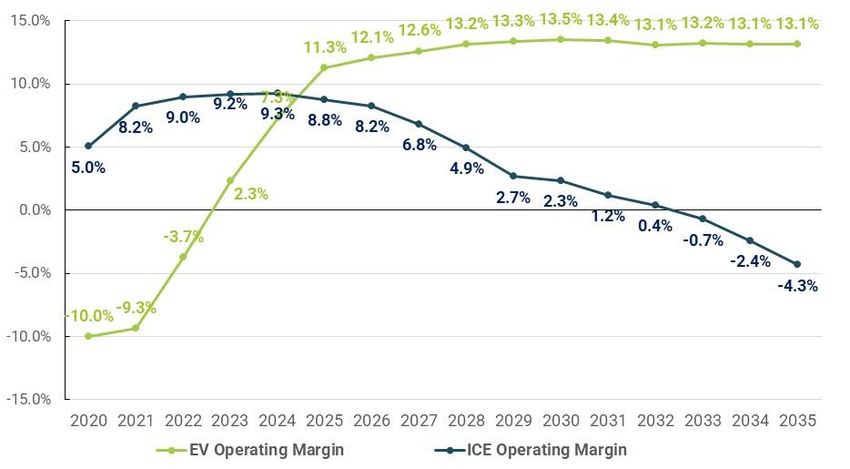
Base -3.7% 2.3% 7.3% 11.3% 13.5% 13.1%
EV operating margin Slow 4.0% 6.6% 8.5% 9.7% 11.2% 10.8%
Quick -8.4% -2.4% 2.4% 8.0% 13.2% 13.3%
Base 9.0% 9.2% 9.3% 8.8% 2.3% -4.3%
ICE operating margin Slow 8.1% 8.5% 8.9% 8.9% 3.2% -1.3%
Quick 9.6% 10.1% 10.5% 10.1% -1.2% -37.4%
Valuation Base Slow Quick
WACC 6.5% 6.5% 6.5%
Terminal growth rate 3.0% 3.0% 3.0%
Effective tax rate 30.0% 30.0% 30.0%
Calc. market value (EUR mn) 246,060 193,659 334,856
Potential / Risk to current value 159% 104% 253%
Carbon liability Base Slow Quick
# of ICEs produced (2022-2035) 91,523 117,405 65,282
Calc. carbon liability (EUR mn) 214,988 275,785 153,348
Market value after carbon liability 31,072 -82,125 181,508
Potential / Risk to current value -67% -187% 91%
Source: Volkswagen, Profundo estimates
Page | 7Table 2 Toyota: Summary of model assumptions and results
Operations 2022 2023 2024 2025 2030 2035
Base 1.0% 2.0% 5.0% 10.0% 29.0% 44.0%
Share of EVs Slow 1.0% 2.0% 3.0% 5.0% 13.0% 18.0%
Quick 1.0% 2.0% 10.0% 15.0% 50.0% 75.0%
Base -24.9% -4.8% 4.2% 9.0% 11.7% 10.7%
EV operating margin Slow 3.4% 8.0% 8.2% 9.8% 12.4% 10.7%
Quick -56.1% -30.6% -16.6% 6.9% 12.3% 10.4%
Base 8.5% 8.7% 8.8% 8.1% 5.6% 2.5%
ICE operating margin Slow 8.5% 8.8% 8.9% 8.4% 6.4% 4.0%
Quick 9.7% 10.1% 10.1% 9.6% 6.9% 2.1%
Valuation Base Slow Quick
WACC 4.1% 4.1% 4.1%
Terminal growth rate 2.0% 2.0% 2.0%
Effective tax rate 30.0% 30.0% 30.0%
Calc. market value (EUR mn) 285,102 227,709 432,671
Potential / Risk to current value 12% -11% 70%
Carbon liability Base Slow Quick
# of ICEs produced (2022-2035) 127,966 151,084 101,584
Calc. carbon liability (EUR mn) 300,593 354,895 238,621
Market value after carbon liability -15,491 -127,186 194,050
Potential / Risk to current value -106% -150% -24%
Source: Toyota, Profundo estimates
Page | 8Table 3 Stellantis: Summary of model assumptions and results
Operations 2022 2023 2024 2025 2030 2035
Base 7.5% 11.0% 15.0% 21.0% 57.5% 80.0%
Share of EVs Slow 7.5% 8.0% 10.0% 12.0% 42.5% 47.5%
Quick 7.5% 11.0% 15.0% 25.0% 80.0% 100.0%
Base 0.8% 4.2% 10.7% 12.0% 13.1% 12.4%
EV operating margin Slow 4.8% 5.9% 9.2% 8.9% 9.9% 10.1%
Quick -6.2% -0.9% 6.1% 11.5% 13.3% 13.3%
Base 11.5% 12.8% 12.3% 11.3% 6.6% -4.1%
ICE operating margin Slow 10.8% 11.8% 11.5% 10.6% 6.2% -1.0%
Quick 11.9% 13.0% 12.8% 12.1% 2.4% -22.4%
Valuation Base Slow Quick
WACC 7.1% 7.1% 7.1%
Terminal growth rate 3.0% 3.0% 3.0%
Effective tax rate 25.0% 25.0% 25.0%
Calc. market value (EUR mn) 153,288 103,836 204,041
Potential / Risk to current value 267% 148% 388%
Carbon liability Base Slow Quick
# of ICEs produced (2022-2035) 59,550 78,608 43,029
Calc. carbon liability (EUR mn) 139,883 184,649 101,075
Market value after carbon liability 13,406 -80,813 102,966
Potential / Risk to current value -68% -293% 146%
Source: Stellantis, Profundo estimates
Page | 9Table 4 Mercedes-Benz: Summary of model assumptions and results
Operations 2022 2023 2024 2025 2030 2035
Base 7.5% 15.0% 22.5% 32.5% 80.0% 100.0%
Share of EVs Slow 7.5% 10.0% 12.5% 15.0% 50.0% 55.0%
Quick 7.5% 15.0% 22.5% 35.0% 100.0% 100.0%
Base -14.5% 0.3% 9.2% 13.4% 13.1% 12.1%
EV operating margin Slow -3.0% 2.2% 6.3% 7.0% 11.3% 10.3%
Quick -14.5% 0.3% 9.2% 14.5% 14.6% 13.4%
Base 11.9% 12.7% 13.8% 13.5% 5.4% -26.2%
ICE operating margin Slow 11.7% 12.4% 13.1% 12.6% 5.6% -0.2%
Quick 11.9% 12.7% 13.8% 13.3% -11.3% -11.3%
Valuation Base Slow Quick
WACC 4.9% 4.9% 4.9%
Terminal growth rate 2.5% 2.5% 2.5%
Effective tax rate 30.0% 30.0% 30.0%
Calc. market value (EUR mn) 352,257 227,524 392,814
Potential / Risk to current value 412% 231% 471%
Carbon liability Base Slow Quick
# of ICEs produced (2022-2035) 14,176 27,511 12,169
Calc. carbon liability (EUR mn) 33,299 64,624 28,585
Market value after carbon liability 318,958 162,900 364,229
Potential / Risk to current value 364% 137% 430%
Source: Mercedes-Benz, Profundo estimates
Page | 10Table 5 BMW: Summary of model assumptions and results
Operations 2022 2023 2024 2025 2030 2035
Base 7.5% 10.0% 15.0% 20.0% 45.0% 57.5%
Share of EVs Slow 7.5% 8.0% 10.0% 12.0% 35.0% 40.0%
Quick 7.5% 10.0% 15.0% 25.0% 75.0% 100.0%
Base -7.3% -0.1% 7.8% 11.1% 11.9% 11.5%
EV operating margin Slow 0.3% 6.4% 9.4% 12.5% 12.7% 8.9%
Quick -14.8% -5.1% 3.2% 11.1% 13.4% 14.1%
Base 11.4% 11.1% 11.5% 11.4% 7.1% 0.2%
ICE operating margin Slow 10.0% 9.6% 9.9% 9.3% 3.9% -2.8%
Quick 11.4% 11.1% 11.5% 11.6% 2.0% -33.3%
Valuation Base Slow Quick
WACC 4.8% 4.8% 4.8%
Terminal growth rate 2.5% 2.5% 2.5%
Effective tax rate 30.0% 30.0% 30.0%
Calc. market value (EUR mn) 195,230 126,253 292,386
Potential / Risk to current value 282% 147% 472%
Carbon liability Base Slow Quick
# of ICEs produced (2022-2035) 27,754 32,507 18,450
Calc. carbon liability (EUR mn) 65,193 76,358 43,339
Market value after carbon liability 130,037 49,894 249,048
Potential / Risk to current value 155% -2% 388%
Source: BMW, Profundo estimates
Page | 11Table 6 Volvo Cars: Summary of model assumptions and results
Operations 2022 2023 2024 2025 2030 2035
Base 7.5% 15.0% 30.0% 50.0% 100.0% 100.0%
Share of EVs Slow 7.5% 10.0% 15.0% 25.0% 60.0% 65.0%
Quick 7.5% 15.0% 30.0% 50.0% 100.0% 100.0%
Base -31.3% -10.3% 4.0% 9.6% 13.0% 13.3%
EV operating margin Slow -1.1% 3.5% 8.3% 11.2% 11.2% 11.2%
Quick -44.1% -20.9% -4.0% 8.5% 13.3% 14.7%
Base 10.0% 11.2% 11.9% 11.3% -0.7% -0.7%
ICE operating margin Slow 7.5% 8.1% 8.5% 7.8% 2.0% -4.0%
Quick 10.1% 11.3% 12.1% 11.5% n.m. n.m.
Valuation Base Slow Quick
WACC 7.2% 7.2% 7.2%
Terminal growth rate 3.0% 3.0% 3.0%
Effective tax rate 24.4% 24.4% 24.4%
Calc. market value (EUR mn) 67,042 42,573 70,917
Potential / Risk to current value 226% 107% 245%
Carbon liability Base Slow Quick
# of ICEs produced (2022-2035) 3,503 9,314 3,028
Calc. carbon liability (EUR mn) 8,228 21,879 7,112
Market value after carbon liability 58,814 20,695 63,805
Potential / Risk to current value 186% 1% 210%
Source: Volvo Cars, Profundo estimates
Page | 12Abbreviations
BEV Battery Electric Vehicle
CAPEX Capital Expenditures
CAPM Capital Asset Pricing Model
DCF Discounted Cash Flow
EBIT Earnings Before Interest and Tax
EV/EBITDA Enterprise value over Earnings Before
Interest, Tax, Depreciation and Amortization
ICE Internal Combustion Engine
IPO Initial Public Offering
NOPAT Net Operating Profit After Tax
OPEX Operational Expenses
R&D Research and Development
SG&A Sales General and Administrative Costs
SOTP Sum of the Parts
TCO Total Cost of Ownership
WACC Weighted Average Cost of Capital
Page | 13Introduction
While the share price and valuation multiples of Tesla move ahead, the value traditional ICE
(internal combustion engine) manufacturers has been depressed in recent years despite a recent
recovery. This report will investigate whether a faster shift to Electric Vehicles (EVs) production
can unlock a potential value increase for shareholders of six car manufacturers operating in
Europe. Throughout this report, we refer to EVs excluding hybrid and plug-in hybrid powertrains.
The important question is whether a scenario of a quick strategy shift is generating more cash
flow than a slow shift. EU regulation as well as increasing regulation outside Europe will lead to a
nearly 100% EV based production for global car manufactures. (i.e. Mercedes-Benz and Volvo by
2030)
This study will investigate some car manufacturers’ argumentation that “an accelerated transition
is destroying value”. In the solution of this question, a crucial aspect is the different costs
structures related to ICE car versus EV production and distribution. Both groups will be confronted
with their own costs challenges and opportunities. EV might increasingly benefit from declining
battery costs and lower power costs, while ICE production (and use of the product) will be hurt by
rising costs related to carbon emissions. Since 2020, car manufacturers selling cars in Europe are
confronted with paying a EUR 95 fine for every gram of CO2 that is emitted for an average car in
their fleet above the 95 gram/km level. As this 95 gram will be reduced from 2025 and 2030
onwards, the total production costs and costs of ownership of an ICE might rise substantially.
Although there are uncertainties how the extra carbon costs are divided between producers and
consumers, it affects the total costs of ownership and/or the margin of car manufacturers. While
slow moving ICE manufacturers will be left with a high cost base in combination with declining
sales, and might end up in the need to close factories, the car manufacturers that shift quickly to
EVs might benefit of increasing economies of scale.
Although this study only focusses on the cash flow benefits, the quick movers (QMs) might benefit
from more attractive financing costs as investors and banks increasingly focus on low-risk
financing of sustainable activities. Finally, investors in shares and bonds of QMs might benefit
from a reputation value enhancement on their investments. Investors in slow movers (SMs) is the
shift to EV might be confronted with reputation risk.
This study will focus on six car manufacturers, and will first analyse the current profile and
strategies of each companies, their upfront investments in new technology. Secondly, an analyses
of differences between ICE and EV production cost will form the basis for forecasting in the model
to 2035. A third step is to develop a case study on Volkswagen with three scenarios, a base case, a
QMs scenario and a SMs scenario. The last step is the conclusion on opportunities and risks for
each car manufacturer. This will be based on the current knowledge of the strategies of the six
companies.
Page | 141
Profiles and strategies
1.1.1 Volkswagen Group
Volkswagen Group is the second largest automaker globally with 8.9 million vehicles delivered in
2021. Among legacy carmakers, VW is one of the leading companies in the transition to EVs,
aiming to become 100% zero emission by 2040 in all major markets, and then globally by 2050. As
of 2021, the share of battery electric vehicles (BEVs) in VW’s total vehicle sales was 5.1% (453K
units) while its aim is to approximately double BEV sales volume every second year for a 50% sales
share in 2030. To reach these goals, VW plans to invest EUR 52 billion (33% of total investment) in
BEV’s and electrification between 2022 and 2026. VW sees software and mobility services, such
as auto-pilot and car sharing, as a new (additional) revenue stream next to EV and ICE businesses
and expect this new segment to push the group operating margins above its historical trend.
Between 2022 and 2026, VW plans to invest EUR 30 billion (19% of total investment) in software
and digital technologies (on top of electrification investments). VW’s important investments
outside the group are; the solid-state battery researcher Quantumscape, battery giga factories
Northvolt AB and Gotion, and the autonomous driving company Argo (with Ford).
Table 7 VW: Company Metrics
Company # of Employees Revenues Market Capitalization
(thousands) (2020, EUR bn) (EUR bn)
Volkswagen 665 223 94.9
Source: Refinitiv Eikon, market data as of 19 April 2022
1.1.2 Toyota Motor Corporation
With 10.5 million vehicles sold in 2021, Toyota is the best-selling automaker in the world through
its Toyota and Lexus brands and subsidiaries Daihatsu and Hino Motors. Although Toyota was the
pioneer in the electrification of passenger cars with its hybrid Prius model, first launched back in
1997, the company did not introduce any full battery electric models until late 2021. With its
recently announced strategy, Toyota as a group aims to launch 30 new BEV model until 2030 and
plans to reach 3.5 million BEV sales (approximately 30% of total). The company foresees JPY 4
trillion (~EUR 30 billion) investment towards battery electric vehicles until 2030, while the same
amount is earmarked for investments in hybrid and fuel cell drivetrain technologies. Toyota
currently does not have any phase-out plans for its ICE business and its management see that it is
up to the customer to make the choice and they want to keep all options available. The
management also think that pushing for more BEVs without the necessary infrastructure (i.e.
charging stations) will be inconvenient for the customers.
Table 8 Toyota: Company Metrics
Company # of Employees Revenues Market Capitalization
(thousands) (2020, EUR bn) (EUR bn)
Toyota 366 209 255
Source: Refinitiv Eikon, market data as of 19 April 2022
Page | 151.1.3 Stellantis
Stellantis is the resulting company of the January 2021 merger between Groupe PSA (PSA
Peugeot Citroën) and Fiat Chrysler Automobiles (FCA), creating the 4th largest global automotive
OEM by volume and 3rd largest by revenue1. In 2021, the two combined groups sold 6.1 million
vehicles worldwide. The company during its March 2022 strategy update, stated its ambition to
sell 5 million BEVs (~58%) in 2030 and reach net zero emissions by 2038. Stellantis plans to invest
EUR 30 billion over the next 5 years for BEVs and expects full EV business to deliver double digit
operating margins by 2026. Stellantis has 3 battery joint venture projects, one each with LG and
Samsung for battery production in North America and one with Total and Mercedes-Benz in
Europe.
Table 9 Stellantis: Company Metrics
Company # of Employees Revenues Market Capitalization
(thousands) (2021, EUR bn) (EUR bn)
Stellantis 407 149 41.8
Source: Refinitiv Eikon, market data as of 19 April 2022
1.1.4 Mercedes-Benz
Operating in the luxury segment, Mercedes-Benz sold 2.4 million vehicles in 2021, 4% (99K units)
of which were BEVs. The management believes that the transition from internal combustion
engines to electric vehicles is feasible and already underway at Mercedes-Benz. The company is
getting ready to go all electric by the end of the decade, where market conditions allow. The share
of xEV (plug-in + BEV) in sales is expected to be up to 50% by 2025 and after that year, all newly
launched vehicle architectures will be electric-only. In total, investments into battery electric
vehicles between 2022 and 2030 will amount to over EUR 40 billion. In the meantime, capital
allocation in Mercedes-Benz is shifting from EV-first to EV-only. The company expects investments
into combustion engines and plug-in hybrid technologies to drop by 80% between 2019 and 2026.
In terms of margins, Mercedes-Benz forecasts operating margins in the BEV era to be similar to
those in the ICE era.
Table 10 Mercedes-Benz: Company Metrics
Company # of Employees Revenues Market Capitalization
(thousands) (2021, EUR bn) (EUR bn)
Mercedes-Benz 288 134 68.8
Source: Refinitiv Eikon, market data as of 19 April 2022
1.1.5 BMW Group
Comprising of BMW, MINI and Rolls-Royce brands, BMW Group sold 2.5 million vehicles in 2021,
where 104K units (4%) were fully electric vehicles. The group projects at least half of global sales
will be all-electric vehicles by 2030, with the MINI brand offering exclusively all-electric vehicles
from that year on. BMW group aims to be climate neutral in 2050. BMW is forming JVs with
Daimler for mobility services and charging solutions (BP as the third shareholder).
Table 11 Company Metrics
Company # of Employees Revenues Market Capitalization
(thousands) (2020, EUR bn) (EUR bn)
BMW 121 99 51.0
Source: Refinitiv Eikon, market data as of 19 April 2022
Page | 161.1.6 Volvo Cars
The Swedish luxury brand Volvo Cars has recently been IPO’d (October 2021). The company sold
0.7 million cars in 2021, of which 3.7% was BEVs. Volvo aims to reach 50% pure electric share by
mid-decade then all fully electric by 2030. Polestar, a 49.5% owned affiliate of Volvo Cars, is a pure
electric car company which is expected to be publicly traded during the first half of 2022 with an
implied enterprise value of USD 20 billion.2
Table 12 Volvo Cars: Company Metrics
Company # of Employees Revenues Market Capitalization
(thousands) (2021, EUR bn) (EUR bn)
Volvo Cars 41 27.8 20.6
Source: Refinitiv Eikon, market data as of 19 April 2022
Page | 172
ICE versus EV production costs
Production costs of EVs are set to decline in the coming years, driven by falling battery
prices and development of dedicated EV platforms. However, the recent surge in
commodity prices is likely to push production costs up in 2022, delaying the decline in
manufacturing costs and ultimately the price parity between EVs and ICEs.
2.1 Production costs comparison
The main difference in production costs of EVs and ICEs stem from the battery and drivetrain
costs. In 2020, the battery and drivetrain (including e-motors) of a BEV were estimated to cost
about EUR 10,700 vs EUR 5,0003 for an ICE, both in Compact (C) segment. This difference
corresponds to 90% of the total production cost difference between EVs and ICEs.
The battery cost alone constitutes to 40% of the total production cost of an EV and it is the
component where the majority of cost reduction is expected over the next several years.
Figure 1 Production cost comparison, C segment EV vs. ICE (2020, EUR thousand)
Source: Oliver Wyman3
Looking ahead, the production costs of EVs are expected to decline, at least by 50% by 2030,
according to the May 2021 study by Bloomberg NEF, commissioned by Transport and
Environment4. More than three quarters of this decline will be due to falling battery prices, where a
~60% decline is expected from 120 EUR/kWh in 2020 to 50 EUR/kWh in 2030. More power-dense
electric motors, cheaper electronics and development of dedicated platforms will be additional
drivers of production cost declines.
Page | 18Figure 2 shows the Bloomberg NEF forecasts, where the manufacturing costs of a BEV is expected
to decline below that of ICEs by 2030. The pre-tax sales prices of same segment EVs and ICEs are
expected to be at parity by 2026 on average for different segments, which is a derivation of the
manufacturing costs.
Figure 2 Production cost projection, C segment EV vs. ICE (2025, 2030, EUR, share in total)
Source: T&E, Bloomberg NEF
2.2 Rising commodity prices delay the decline in production costs
Mostly driven by the war in Ukraine, prices of materials used in battery production, as well as ICEs,
have risen significantly. Although the long-term trend of declining battery prices are kept in
projections, we now incorporate a 5% y/y increase in production costs in both EVs and ICEs in the
valuation models to reflect the current situation. This pushes the expectation of ICE – EV price
parity expectations by 1-3 years depending on the car segment.
2.3 Tesla as the reference
As the legacy auto-makers start rolling out BEVs, Tesla is probably the best company to take
reference as to how the operating metrics of the new EV businesses change as the production
increases. Last 4 years of the company is a good proxy for 1) the impact of economies of scale on
unit costs, 2) impact of declining unit prices (changing product mix, start of Model 3) and 3) the
operating margin development from -5.2% in 2018 to 10.5% in 2021.
Page | 19Perhaps the only non-indicative metric is the investment ratio because Tesla is building all
factories from scratch while the legacy car makers have the option to convert existing facilities in
to EV plants. Table 13 show the development of Tesla’s operating metrics.
Table 13 Tesla: Operating figures
TESLA (USD mn) 2018 2019 2020 2021
Total production 254,530 365,232 509,737 930,442
Automotive Sales 17,213 19,358 24,604 44,125
Unit price 68 53 48 47
y/y -22% -9% -2%
Cost of Auto sales 13,686 15,939 19,696 32,415
Auto Gross profit 3,527 3,419 4,908 11,710
Auto Gross margin 20.5% 17.7% 19.9% 26.5%
SG&A 2,835 2,646 3,145 4,463
Restructuring and other 135 149 0 -27
Total OPEX 4,430 4,138 4,636 7083
Unit costs 71 55 48 42
y/y -23% -13% -11%
Auto Operating profit -903 -719 272 4,627
Auto Operating margin -5.2% -3.7% 1.1% 10.5%
CAPEX 2,101 1,327 3,157 6,482
12.2% 6.9% 12.8% 14.7%
R&D 1,460 1,343 1,491 2,593
8.5% 6.9% 6.1% 5.9%
Total investment ratio 20.7% 13.8% 18.9% 20.6%
Source: Tesla5
Page | 203
Methodology for scenario analysis
This section will explain the methodologies that will be used to estimate the future cash
flows of car manufacturers which will form a basis to value the companies with their
current trajectory vs alternative faster or slower transition to EV scenarios. The
difference between resulting company valuations will demonstrate the value creation
potential.
3.1 SOTP and DCF analysis
The equity value of the selected car manufacturers will be calculated with a sum of the parts
approach where the ICE, EV and any other separable parts and equity investments of the
companies will be valued and summed up to reach an estimated Enterprise Value for the firm.
From this, net debt and any minority interest will be deducted and if needed, a holding (SOTP)
discount will be applied to account for the holding structure risk. The resulting value will be the
estimated or target value of the company’s equity.
3.1.1 Valuation methodologies
The car manufacturing businesses of the companies will be split in to two, ICE and EV, and each
will be valued via DCF methodology. The remaining business lines, such as customer financing,
(connected) services and third party parts (batteries) will be valued either via trading multiples or
according to their book values, based on data availability.
3.1.2 DCF methodology
The calculation methodologies for each item of the DCF analysis are shown on Table 14.
Table 14 Calculation methodologies for DCF items
Item Code Methodology Source
Sales Volume A Derived from company Company data, T&E,
strategy Bloomberg, Profundo
Sales Price B Forecasted using Profundo
current average unit
prices and battery cost
and demand outlook
(around 2027 price-
parity year)
Revenues C A*B
Operating Margin D See Section 3.1.3 Profundo estimates
Operating Profit E C*D
Tax F E * Corporate tax rate
NOPAT G E–F
Page | 21Item Code Methodology Source
Depreciation H Calculated using historic Company data,
company practise Profundo
CAPEX I Calculated using Company data,
company strategy and Profundo
announcements and
historic ratios
Working Capital J Calculated using historic Company data,
Requirement ratios Profundo
Free Cash Flow K G+H–I–J
WACC L Calculated for the Profundo calculation
current market
conditions and applied
to both ICE and EV
businesses
Source: Profundo
3.1.3 Operating margin estimation methodology
The estimation of future operating (EBIT) margin for ICE and EV businesses is the key determinant
of the valuation study. As evident in the historic variation in margins across automakers, the
operating margin is not only a function of production costs, but also dictated by product
positioning, target segment and consumer perception. Thus, the operating margin can be seen as
the result of a negotiation process between the consumer and the automaker over a long period of
time with millions of iterations. We believe that the ramp up period of a disruptive innovation in the
market, in this case EVs, create volatility in margins, for example low or even negative figures, but
as the product matures, the margins eventually will normalize to historic averages of respective
companies.
With this in mind, we see the EV business as the only product line in the long run, in line with the
policy direction of almost all major countries. ICE’s will be fully eliminated as we reach net-zero
emissions targets of countries. Thus, making the EV business the only activity area of the car
manufacturers. This suggests that as the EV sales volumes reach the critical mass (depending on
the car manufacturer), the EV business margins would most likely normalize at the historic
operating margin of the given company. In the respective DCF models, we will use a normalized
operating margin for EV businesses in line with the historic (ICE) trend of given company, taking
into account the estimated ramp up period in the company strategy to forecast the needed to
reach normalized margin levels for EV businesses.
Fixed costs and variable costs, and economies of scale. We use a more quantitative methodology
to forecast future margins, taking into account the impact of declining economies of scale and the
distinction between fixed costs (overhead) and variable costs (costs that depend on number of
cars produced).
The impact of declining economies of scale: In order to calculate the scale impact, a distinction
between fixed and variable costs will be done, where available, and will be modelled accordingly.
The main reported fixed costs are R&D costs and depreciation costs whereas the remaining cost
items, usually around 80% of total costs, are variable and modelled on a per car basis. The sudden
fall in vehicle sales during 2020 pandemic lockdowns also serves as a great reference to calculate
the future margin impact of declining economies of scale.
In this part of the analysis, the impact of increasing legislation, regulation and costs of carbon
emissions by the outgoing ICE businesses is not taken into account. This issue is explained in
section 4.
Page | 223.2 Estimating value creation potential from faster EV adaptation
After estimating the future cash flows for the current strategic outlooks of the companies, a
scenario analysis will be conducted by pulling forward the EV transition plans and faster phase-
out of ICEs. Thus, the difference between the valuation of the current strategy vs. the faster
transition will demonstrate the value creation potential. To be able to reach credible results, the
proposed strategy in the scenario analysis will incorporate time buffers, meaning that any different
plan that cannot take effect immediately, will have a later (i.e. 2 years) impact. On the other hand,
opting for a slower strategy and delaying plans are relatively easier to do and take effect the
following year, as with the slow cases in our study.
3.3 Comparison
The results will be compared both within the two groups, mass market and luxury segment, and
also as aggregated group differences will be demonstrated. The comparison will try to point out
the value effect of different EV transition strategies of car manufacturers as well as an estimated
total value creation opportunity if the sector as a whole can move more quickly towards EVs,
possibly through regulatory incentives.
Page | 234
CO2 emissions in valuation models
In addition to the emissions limit scheme currently applied to European automakers’
fleets, the emissions from every vehicle could be subject to carbon pricing through ETS
in Europe and similar schemes elsewhere in the world. This could impact the enterprise
value and the market capitalisation of a car manufacturer with a large ICE business.
4.1 Introduction – Investors will discount uncertainties of ICE future
Investors will take into account that carbon pricing initiatives might have an impact on the price
that consumers want to pay for an ICE car, and/or on the demand for ICE cars, and/or the margins
of ICE car production. Related question is how much of the burden will be at the car manufacturer,
and how much at the customer. Do car manufacturers that change quickly to EV production have a
benefit versus the slow-movers?
Total Cost of Ownership (TCO), combined with the production costs of ICEs versus EVs, is a crucial
element in the pricing of a car and in the profitability of ICE business. The risk is that the car
manufacturer might have to bear the burden due to its diminished bargaining power, thus eroding
the value of the business in proportion of the potential Scope 3 emissions produced by the ICEs in
the remaining period to 2035 when they phase out ICE production.
4.2 Carbon cost/liability methodology
4.2.1 Calculating with a margin impact versus introduction of a liability
The key question for the car manufacturers valuation model, is whether carbon costs are
introduced as a margin impact or as a liability, reducing the enterprise value of the ICE production
activity.
The car market in specific jurisdictions is already affected by the issue of carbon (CO2-equivalent)
costs. Carbon cost accounting will affect car manufacturers in two ways:
• Through regulation/legislation in production. The EU already sets targets for CO2 emissions for
the average manufactured fleet per km. This includes fines when the average product portfolio
consists of cars emitting more than 95 gram of CO2 per km. The company could pass this on to
the customer or the company could accept a margin decline.
• In case of pricing carbon emissions through fuel sales, the consumer will discount this in its
decision process when buying a new car. Other costs can be added to this, like a higher pricing
for parking an ICE car in city centres, or a ban on driving into certain areas. These elements will
add to the Total Cost of Ownership (TCO) of an ICE car.
Page | 24Current regulation does not lead to material pressure on margins of ICE’s. The EU is most
advanced with CO2 cost regulation for car manufacturers. Target levels on a new sold fleet level
are set for 2020-2024 with cars and vans to emit a maximum of respectively 95 and 147 gram
CO2/km. For 2025 these targets are reduced by 15% (2025) for cars and vans. For 2030, a
reduction of 37.5% for cars and 31% for vans is required. Penalties are currently EUR 95 per
gram/km (for a car with a weight of 1,379.88 kg) of target exceedance for the average fleet
produced.6 Now, the EU commission proposed in its “Fit for 55” package a reduction of 55% for
cars and 50% for vans in 2030 and 100% for both categories in 2035.7 In this regulation, pooling is
allowed, which means that car manufacturers can group together and act jointly to meet their
emission targets.
The EU system means that for instance a BMW 2 Serie Active Tourer (weight 1,494 kg, so adjusted
99 gram/km) with emissions of approximately 126 gram/km8 on a NEDC (New European Driving
Cycle) basis9, generates 27 grams of CO2/km above the EU level. If the whole fleet would consist
of this car, BMW would need to pay EUR 2,565 (27 X EUR 95) per car to the EU. Of a net sales price
of EUR 30,000, this is 8.6%. In its average 2020 fleet however, BMW says to have achieved a 99
g/km, close to the target of the EU.10 The actual number according to T&E is 114 gram/km11:
emissions in 2020 were reported with NEDC; from 2021, equivalent targets are set as emissions
are measured using the Worldwide Harmonised Light Vehicle Test Procedure (WLTP), and they
lead to higher absolute value of emissions to be used for carbon accounting.12
Total cost of ownership approach is the preferred way of embedding CO2 costs into the model. In
this BMW example (145 gr/km at WLTP basis), a 15-year lifetime of a vehicle with 15,000 per year
would lead to 32.63 metric tons of CO2. Although currently there is no carbon costs involved, one
could calculate with a certain value of these CO2 emissions.
Like in the Morgan Stanley analysis “EV assets vs. ICE Liability”13, the costs can be included in the
margin or can be added as a liability in the DCF and equity valuation. In the Ford example the
scenarios of USD 10 dollar/ton CO2 and USD 100/ton would lead to USD 50 billion respectively USD
500 billion liability. The study states that it is uncertain how this potential liability will be divided
between manufacturer and customer.
The current EU ETS market price is CO2/ton (EUR 75). As investors are gradually getting
accustomed with the EU ETS market, this EUR 75 would be a good assumption as potential cost. If
in the BMW 2 example the EUR 75 per ton CO2 would be used, the total emission costs would be
EUR 2,447 over the lifetime of a car (75 x 32.63). In this BMW 2 example, the choice is for two
approaches:
• Margin impact: this would be 8.1% (2,447 / 30,000) of the net sales price of the BMW.
• Liability impact: the alternative is to add this EUR 2,447 to the manufacturer’s liability in the
DCF and equity valuation.
In the USA, the Environmental Protection Agency (EPA) used the same methodology. It stated that
a typical passenger vehicle emits about 4.6 metric tons of CO2 per year. This is based on 22 miles
per gallon and 11,500 miles per year.14 In 15 years, this would mean 69 metric ton CO2 emission. At
EUR 75 per ton CO2, this adds up to EUR 5,175.
In a competitive environment where car manufacturer A adjust quickly to become a EV
manufacturer while car manufacturer B is much slower, B will be confronted with margin pressure
when the costs of CO2 emissions can be difficult passed on to customers. This certainly occurs in
an environment where production costs of EV reach parity with ICEs, and EVs will be increasingly
subsidized.
To apply the carbon costs (which is affecting the Total Cost of Ownership = TCO) into the
valuation model, the preferred methodology is through the addition of a liability. Companies and
scenarios that choose for a quick switch to EV production, will face a lower liability than
companies and scenarios that choose for a slow switch.
Page | 254.2.2 The introduction of a liability
The CO2-emissions per ‘average’ car produced sold in Europe have developed as follows in the
period 2016-2020. On a global scale, the companies have already moved close to the requirements
in the EU (95 gram CO2/km). These data are NEDC values. Note that WLTP values are higher.
Table 15 Average CO2 emission per produced cars (Europe)
Average CO2/km 2016 2017 2018 2019 2020
VW 120.2 121.5 121.9 124.0 112.4
Toyota 105.5 103.1 102.1 99.7 97.0
Stellantis 112.8 114.0 117.0 118.7 102.7
Mass market average 112.8 112.9 113.7 114.1 104.0
BMW 123.0 121.8 126.4 126.8 114.0
Daimler 125.3 127.0 134.2 137.4 118.6
Volvo Cars 121.2 124.4 132.2 131.9 106.5
Luxury market average 123.2 124.4 130.9 132.0 113.0
Source: T&E; NEDC values. WLTP values are higher.
As most manufacturers still produce mainly ICEs, these CO2 outcomes reflect the ICE business. To
calculate the potential carbon liability per car manufacturer, most logical is to calculate the
remaining number of ICEs to be produced in 2022–2035, multiply this with an CO2 emission per
average car in 2022-2035, multiplied by the total kilometres in the lifetime of a car, and finally
multiply this by the carbon price per ton (EUR 75). As the report works with three scenarios per
manufacturer, there will be three different emission cost liabilities per manufacturer.
The calculation with a carbon price of EUR 75 per ton can be justified by already existing carbon
pricing initiatives around the world15 and the existing EU ETS price.16 Based on European
Environment Agency (EEA) preliminary data for 202017, the average CO2 emissions of new cars
sold in Europe (total for all carmakers) was 107.8 g/km on the NEDC cycle and 130.4 g/km on the
WLTP cycle. Excluding pure electric vehicles (BEV), the average WLTP emissions were 139.2 g/km
in 2020. Considering that this average is only for Europe, where there are legal targets to match, we
can assume that the global figures are higher than this average. However, we opt to use 139 g/km
until the end of the calculation period to compensate for any possible reductions in ICE (incl.
PHEV) emissions.
For instance, in the base case VW will produce cumulative 92 million ICEs in the period 2022-2035.
The assumption is they might emit on average 139 gram per car. In the total lifetime, the average
car drives 225,000 km leading to 2,867 million ton CO2 emissions for all 92 million VW ICEs cars
produced in 2022-2035 (cumulative). This leads to a total carbon cost liability of EUR 214,988
million in case of EUR75/ton emission cost.
Table 16 Example VW: Emission liability in Enterprise Value in Base Case
Factor Input Formula
Cumulative # ICEs (000) 91,523 A
Emissions/km (gram) 139 B
Total km per car per year 15,000 C
# years 15 D
Page | 26Factor Input Formula
Total km per car lifetime 225,000 E= C x D
2022-2035 ICEs emissions (million ton) 2,867 F = A x E X B
Emission costs/ton (EUR) 75 G
Emission costs ICE fleet 2022-2035 (EUR million) 214,988 H=FxG
Source: Profundo
The introduction of this Carbon Liability leads to a negative Enterprise Value for VW’s ICE
business. The positive DCF based on realistic production costs excluding the potential liability of
emission costs, is completely wiped out. The end result would be a negative EUR 115 billion.
In a scenario analysis of a Quick Case, the number of ICEs will decline strongly in 2022-2035,
leading to a strong reduction of the Emission Liability (to EUR 153.3 billion). As a consequence, the
ICE including the Emission Liability could lead to a negative Enterprise Value of EUR 30.9 billion.
Including an enhancement of the EV Enterprise Value, the value of Chinese activities and
Financial Services, this would lead to a strong increase of the total Enterprise Value versus the
Base Case for VW due to a quick adjustment to EV. The outcome would be EUR 209 billion in
Enterprise Value. After deduction of Net cash, Hybrid Capital, Pension Liabilities and Minorities,
an Equity Value of EUR 182 billion would result. This is above the current Market Capitalization
(see Table 21).
Page | 275
Case study Volkswagen
The case study will present Volkswagen’s company valuation under three different EV
adaptation scenarios while hypothetically splitting the company into 4 businesses: EV
business, ICE business, China JVs and Financing business.
5.1 Forecasting, scenario and valuation methodology and assumptions
To be able to demonstrate the different business outlooks of EVs and ICEs, we performed a
hypothetical split between the two product lines. Because VW does not report financial figures on
EVs and ICEs separately, this split had to rely on company guidance and analyst assumptions,
especially on unit revenues, costs and investments. The financial figures of the Chinese JVs are
already excluded from Volkswagen’s consolidated numbers, thus only the unit sales figures had to
be separated from the total. The separation of the finance business (leasing, consumer loans etc.)
was done according to the reporting by VW. Following the splitting, 3 different EV adaptation
scenarios, Base, Quick and Slow adoption, were formed to forecast the operational outlook and the
cash flows until 2035 as the input for the DCF valuation study.
5.1.1 Total vehicle sales and EV adaptation assumptions
The total vehicle sales forecasts are based on publicly available sales targets of OEMs, where the
recovery in production and sales expected in 2022 had to be distributed to the next few years as
the chip shortage problems are still valid for the whole sector. The level of EV adaptation, in other
words the share of pure electric vehicle within the total vehicle sales, forms the basis of the
scenarios and the analysis. Please note that the EV adaptation ratios used throughout the study
are global shares of EV, not specific to any region unless stated otherwise. For the base case, the
most recently communicated strategic targets by VW were used. In its latest five-year planning
round presentation18 covering the strategic outlook for 2022-2026, the company stated that it aims
to reach ~50% BEV share in total sales by 2030. Table 17 summarises the sales volume
assumptions for the Volkswagen case study.
Table 17 VW: Summary of sales volume and EV adaptation assumptions
Case (‘000s) 2022 2023 2024 2025 2030 2035
EV share 7.5% 11.0% 15.0% 21.0% 50.0% 72.5%
Base # of EVs 713 1,073 1,500 2,229 5,638 9,070
# of ICEs 8,788 8,678 8,500 8,384 5,638 3,440
EV share 7.5% 8.0% 10.0% 12.0% 35.0% 40.0%
Slow # of EVs 713 780 1,000 1,274 3,947 5,004
# of ICEs 8,788 8,970 9,000 9,340 7,330 7,506
EV share 7.5% 11.0% 15.0% 25.0% 75.0% 100.0%
Quick # of EVs 713 1,073 1,500 2,653 8,457 12,511
Page | 28You can also read