Quantifying genetic heterogeneity between continental populations for human height and body mass index
←
→
Page content transcription
If your browser does not render page correctly, please read the page content below
www.nature.com/scientificreports
OPEN Quantifying genetic heterogeneity
between continental populations
for human height and body mass
index
Jing Guo1,2, Andrew Bakshi3,4, Ying Wang1, Longda Jiang1, Loic Yengo1,
Michael E. Goddard5,6, Peter M. Visscher1,9 & Jian Yang1,7,8,9*
Genome-wide association studies (GWAS) in samples of European ancestry have identified thousands
of genetic variants associated with complex traits in humans. However, it remains largely unclear
whether these associations can be used in non-European populations. Here, we seek to quantify
the proportion of genetic variation for a complex trait shared between continental populations.
We estimated the between-population correlation of genetic effects at all SNPs (rg ) or genome-
wide significant SNPs (rg(GWS)) for height and body mass index (BMI) in samples of European
(EUR; n = 49, 839) and African (AFR; n = 17, 426) ancestry. The r̂g between EUR and AFR was 0.75
(s.e. = 0.035) for height and 0.68 (s.e. = 0.062) for BMI, and the corresponding r̂g(GWS) was 0.82
(s.e. = 0.030) for height and 0.87 (s.e. = 0.064) for BMI, suggesting that a large proportion of GWAS
findings discovered in Europeans are likely applicable to non-Europeans for height and BMI. There
was no evidence that r̂g differs in SNP groups with different levels of between-population difference in
allele frequency or linkage disequilibrium, which, however, can be due to the lack of power.
Most traits and common diseases in humans are complex because they are influenced by many genetic variants
as well as environmental factors1,2. Genome-wide association studies (GWASs) have discovered > 70,000 genetic
variants associated with human complex traits and diseases3,4. However, most GWASs have been heavily biased
toward samples of European (EUR) ancestry (~ 79% of the GWAS participants are of EUR descent)5. Progress
has been made in recent years in uncovering the genetic architecture of traits and diseases in a broader range
of populations6–11. Given the population genetic differentiation among worldwide populations5,12–15, the extent
to which the associations discovered in EUR populations can be used in non-EUR such as Africans (AFR) and
Asians remains unclear. Genetic correlation (rg ) is the correlation between the additive genetic values of two
opulation16. However, by definition, we cannot observe the trait in AFR and EUR in the same indi-
traits in a p
viduals. Therefore, rg is better defined by the correlation between the additive effects of causal variants in the
two populations. rg can be less than 1 due to genotype by environment interactions if the two populations are in
different environments. Unfortunately, not all the causal variants for complex traits are known so we estimate rg
based on the correlation between the apparent effects of genetic markers such as SNPs. This can be estimated by
using the genomic relationship matrix (GRM) among all the individuals or, if only summary data is available, the
correlation between estimated SNP e ffects13,17–19. rg estimated from SNPs can be less than that based on causal
variants if the LD between causal variants and SNPs differs between the populations. Galinsky et al.14 estimated
this effect using simulation and found it to be small but this conclusion may not apply to rare causal variants.
1
Institute for Molecular Bioscience, The University of Queensland, Brisbane, QLD 4072, Australia. 2Human Genetics,
Wellcome Sanger Institute, Hinxton CB10 1SA, UK. 3Monash Partners Comprehensive Cancer Consortium,
Monash Biomedicine Discovery Institute Cancer Program, Prostate Cancer Research Group, Department of
Anatomy and Developmental Biology, Monash University, Clayton, VIC 3800, Australia. 4Queensland Brain
Institute, The University of Queensland, Brisbane, QLD 4072, Australia. 5Faculty of Veterinary and Agricultural
Science, University of Melbourne, Parkville, VIC, Australia. 6Biosciences Research Division, Department of
Economic Development, Jobs, Transport and Resources, Bundoora, VIC, Australia. 7School of Life Sciences,
Westlake University, Hangzhou 310024, Zhejiang, China. 8Westlake Laboratory of Life Sciences and Biomedicine,
Hangzhou 310024, Zhejiang, China. 9These authors jointly supervised this work: Peter M. Visscher and Jian
Yang. *email: jian.yang@westlake.edu.cn
Scientific Reports | (2021) 11:5240 | https://doi.org/10.1038/s41598-021-84739-z 1
Vol.:(0123456789)www.nature.com/scientificreports/
2
ĥEUR (s.e.) 2
ĥAFR (s.e.) r̂g (s.e) P (rg = 1)
Height 0.50 (0.0077) 0.39 (0.024) 0.75 (0.035) 6.8 × 10⁻¹³
BMI 0.25 (0.0080) 0.22 (0.025) 0.68 (0.062) 2.1 × 10⁻⁷
Table 1. Estimated r̂g between EUR and AFR using HapMap3 SNPs based on the ancestry specific GRMs for
height and BMI.
Previous trans-ethnic genetic studies have shown that the estimates of rg at common SNPs (e.g., those with
minor allele frequencies (MAF) > 0.01) between EUR and East Asian (EAS) populations are high for inflamma-
tory bowel diseases (r̂g = 0.76 with a standard error (s.e.) of 0.04 for Crohn’s disease and r̂g = 0.79 with s.e. = 0.04
for ulcerative colitis)20 and bipolar disorder (r̂g = 0.68)21 and modest for rheumatoid arthritis (r̂g = 0.46 with
s.e. = 0.06)13 and major depressive disorder (r̂g = 0.33 with a 95% confidence interval (CI) of 0.27–0.39)22. If
the between-population rg for a trait estimated from SNPs is not unity, then it is of interest to know whether the
between-population genetic heterogeneity differs at SNPs with different levels of between-population difference
in allele frequency (i.e., Wright’s fixation i ndex23, FST) or LD, and whether the between-population rg estimated
from all common SNPs (MAF > 0.01) can be used to measure the correlation of genetic effects between popula-
tions at the genome-wide significant SNPs. Answers to these questions are important to inform the design of
gene mapping experiments24–28, the genetic risk prediction of complex diseases5,29 in the future in non-EUR
populations and the detection of signatures of natural selection that has resulted in genetic differentiation among
worldwide populations. In this study, we focus on estimating the correlation of genetic effects at all SNPs (denoted
by rg ) between continental populations using a bivariate GREML analysis30 (treating the phenotypes in the two
populations as different traits) for two model complex traits, i.e., height and body mass index (BMI). We inves-
tigate the influence of the between-population differences in allele frequencies or LD on the between-population
genetic heterogeneity. To do this, we first used genome-wide SNP genotype data to estimate rg between AFR and
EUR populations for height and BMI. We also estimated the correlation of genetic effects between continental
populations at the genome-wide significant SNPs (rg(GWS)) identified from an EUR GWAS using the bivariate
GREML method30 or a summary level data-based method31. We then examined whether the between-population
genetic overlap is enriched (or depleted) at the SNPs with stronger between-population differentiation in allele
frequency or LD.
Results
Genetic correlation (r g ) between worldwide populations for height and BMI. We used GWAS
data on 49,839 individuals of EUR ancestry from the UK Biobank (UKB) and 17,426 individuals of AFR ancestry
from multiple publicly available datasets including the UKB (Supplementary Fig. 1; Methods). Note that we used
only ~ 50 K EUR individuals from the UKB for the ease of computation. All the individuals were not related in
a sense that the estimated pairwise genetic relatedness was < 0.05 within a population. The EUR genotype data
were imputed by the UKB (version 3) using the Haplotype Reference Consortium (HRC) and UK10K imputation
reference panel32. We imputed the AFR data to the 1000 Genomes Project (1000G) reference panel (Methods).
After quality control (QC), 1,018,256 HapMap3 SNPs with MAF > 0.01 in both the two data sets were retained
for analysis (Methods). We first used the bivariate GREML a pproach30 to estimate rg between populations as well
as the SNP-based heritability (h2SNP) in each population for height and BMI. It has been shown in Galinsky et al.14
that the estimate of rg from a between-population bivariate GREML analysis is equivalent to the correlation of
genetic effect at all SNPs. The GRM used in our bivariate GREML analysis was computed using two different
strategies: (1) SNP genotypes standardized using allele frequencies estimated from a combined sample of the
two populations (denoted as GRM-average); (2) SNP genotypes standardized using allele frequencies estimated
from each population specifically (denoted as GRM-specific; Methods). The r̂g based on GRM-specific was 0.75
(s.e. = 0.035) for height and 0.68 (s.e. = 0.062) for BMI, suggesting strong genetic overlap between EUR and
AFR for both height and BMI (Table 1). The r̂g between EUR and AFR for height was very similar to that between
EUR and SAS estimated from the UKB data reported in Galinsky et al. (0.77 with s.e. = 0.26)14. We did not
observe a substantial difference in r̂g between the analyses based on GRM-average (Supplementary Table 1) and
GRM-specific (Table 1). The ĥ2SNP in EUR and AFR from the bivariate GREML analysis were 0.50 (s.e. = 0.0077)
and 0.39 (s.e. = 0.024) for height, and 0.25 (s.e. = 0.0080) and 0.22 (s.e. = 0.025) for BMI, respectively (Table 1),
highly consistent with those from the univariate GREML a nalysis33 where the corresponding estimates were 0.50
(s.e. = 0.0078) and 0.40 (s.e. = 0.026) for height, and 0.25 (s.e. = 0.0080) and 0.23 (s.e. = 0.025) for BMI. The
first 20 principal components (PCs) were fitted in the bivariate GREML analysis to control for potential effects
due to population stratification within populations (Methods). The results were almost identical even without
adjustment for PCs (Supplementary Table 2). It is of note that the height ĥ2SNP in EUR was significantly larger
than that in AFR ( P = 1.3 × 10⁻⁴), which is consistent with the result from a recent study in European-Ameri-
cans and African-Americans15, presumably because the causal variants in non-Europeans, especially those with
MAF < 0.01, were less well tagged by the SNPs on the SNP arrays compared to those in Europeans. Such a dif-
ference was much smaller and not statistically significant for BMI ( P = 0.35), which can be partly explained
by that the imperfect tagging is proportional to trait heritability34. To further investigate the difference in SNP
tagging between populations, we estimated h2SNP in AFR and EUR in a bivariate GREML analysis based on two
subsets of HapMap3 SNPs stratified by whether a SNP is included in the Affymetrix Human Origins (AHO)
array (m = 185 k) or not (m = 832 k). Unlike the result above, there was no significant difference in the estimated
Scientific Reports | (2021) 11:5240 | https://doi.org/10.1038/s41598-021-84739-z 2
Vol:.(1234567890)www.nature.com/scientificreports/
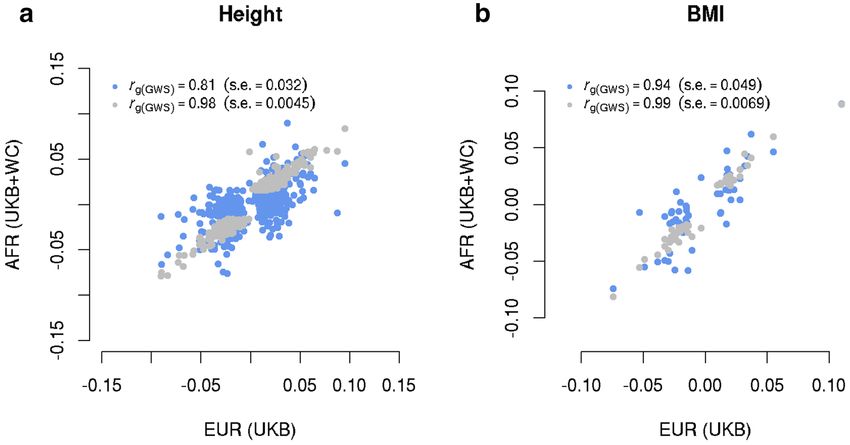
Figure 1. Estimated genetic effect correlation between AFR and EUR for height (a) and BMI (b) at genome-
wide significant SNPs. The near-independent trait-associated SNPs were discovered in GIANT with their effects
re-estimated in our EUR (n = 456, 422) and AFR (n = 23, 355) data. The blue dots show a comparison of SNP
effects between EUR and AFR and the grey ones show the comparison within EUR (i.e., GIANT vs. EUR-UKB).
height variance explained by the Human Origins SNPs between EUR and AFR (ĥ2SNP(AHO) = 0.14 with s.e. = 0.012
in EUR and ĥ2SNP(AHO) = 0.13 with s.e. = 0.031 in AFR; Pdifference = 0.77; Supplementary Table 3), suggesting that
the observed difference in the ĥ2SNP between EUR and AFR using the ~ 1 million HapMap3 is possibly attribut-
able to biases in ascertainment of SNPs towards European populations. We further estimated rg between EUR
and EAS for BMI by a summary-data-based rg approach13 using summary statistics from the GIANT consortium
(n = 253, 288)35 and the Biobank Japan project (BBJ, n = 158, 284)10 (note that the GWAS data with compara-
ble sample size for EAS and the BBJ summary-level data for height were not available to us). The r̂g between EUR
and EAS was 0.80 (s.e. = 0.037) for BMI, which was also significantly different from 1 ( P = 8.36 × 10⁻⁸), in line
with the estimate (0.75, s.e. = 0.023) from Martin et al.5 based on GWAS summary data from the UKB and BBJ.
Correlation of SNP effects between populations at the top associated SNPs. We have quantified
above the between-population rg for height and BMI using all HapMap3 SNPs with MAF > 0.01. The estimates
were high but statistically significantly smaller than 1 (Table 1), suggesting there is a between-population genetic
heterogeneity for both traits. We know from a previous study that r̂g estimated from all SNPs is close to the
estimated causal effect correlation (ρ̂b) between EUR and SAS14. We then sought to ask whether the estimated rg
from all SNPs is consistent with that estimated at genome-wide significant SNPs identified in EUR (i.e., rg(GWS) ).
We estimated rg(GWS) between EUR and AFR using the recently developed method31 that can estimate SNP
effect correlation using summary data accounting for errors in the estimated SNP effects (Methods). We used
the trait-associated SNPs identified in previous GWAS meta-analyses conducted by the GIANT consortium35,36
(with SNP effects re-estimated in our AFR and EUR samples to avoid biases due to the winner’s curse; see
“Methods”). There were 538 and 57 nearly independent SNPs for height and BMI respectively at P < 5.0 × 10⁻⁸
selected from clumping analyses (LD r2 threshold = 0.01 and window size = 1 Mb) of the GIANT summary data
(Methods)37. To avoid potential bias in estimating rg(GWS) due to remaining LD among these sentinel SNPs, we
did an additional round of clumping using a window size of 10 Mb (Methods) and obtained 531 and 56 SNPs for
height and BMI respectively. We call these the sentinel SNPs hereafter.
We first estimated rg(GWS) between our EUR sample and GIANT as a “negative control”; the estimate was 0.98
(s.e. = 0.004 5) for height and 0.99 (s.e. = 0.0069) for BMI, suggesting no significant differences in SNP effects
between the GIANT (a meta-analysis of samples of EUR ancestry) and our sample of EUR participants from the
UKB (Fig. 1). We then estimated rg(GWS) between EUR and AFR (SNP effects re-estimated in our samples). We
found an estimate of 0.81 (s.e. = 0.032) for height (Fig. 1a) and of 0.94 (s.e. = 0.049) for BMI (Fig. 1b). Since
individual-level data were available in our EUR and AFR samples, we performed a bivariate GREML analysis
to estimate rg(GWS) only using the sentinel SNPs (Methods); the estimate was 0.82 (s.e. = 0.030) for height and
0.87 (s.e. = 0.064) for BMI, similar to the corresponding estimates using the summary data above. Moreover,
summary data-based r̂g(GWS) between EUR (SNP effects re-estimated in this study) and EAS (SNP effects from
the BBJ data38) was 0.90 (s.e. = 0.043) for BMI. All these results suggest that a large proportion of GWAS findings
discovered in Europeans are likely replicable in non-Europeans for the two traits (see below for more discussion).
In addition, r̂g estimated using all SNPs was largely consistent with r̂g(GWS) for height, but some differences have
been observed for BMI (see below for discussion).
Genetic correlation estimated at SNPs stratified by population difference in allele frequency
or LD. If there is an effect of the between-population differences in allele frequencies on the between-popula-
tion genetic heterogeneity for a trait, we hypothesised that the estimate of rg at SNPs with higher FST is different
Scientific Reports | (2021) 11:5240 | https://doi.org/10.1038/s41598-021-84739-z 3
Vol.:(0123456789)www.nature.com/scientificreports/
FST stratified LDCV stratified
r̂g−l(s.e.) r̂g−h(s.e.) Pdifference r̂g−l(s.e.) r̂g−h(s.e.) Pdifference
Height 0.84 (0.15) 0.68 (0.099) 0.509 0.92 (0.12) 0.59 (0.087) 0.076
BMI 0.73 (0.19) 0.62 (0.23) 0.785 0.82 (0.29) 0.63 (0.15) 0.640
Table 2. Difference of the estimated r̂g for EUR-AFR between SNP sets stratified by allele frequency- and
LD-matched FST (and LDCV) for height and BMI respectively. l and h indicate the SNP group with lower FST
(or LDCV) and higher FST (or LDCV), respectively.
from that at SNPs with lower FST. To test this, we first calculated the FST values of the HapMap3 SNPs between
EUR and AFR. To avoid difference in within-population allele frequency or LD between the two FST groups, we
divided the SNPs into a large number of bins according to their allele frequencies and LD scores in each popula-
tion and then stratified the SNPs into two groups with equal number by their FST values in each MAF-LD bin
(Methods). We show that there was no difference in allele frequency or LD score between the two FST groups
after applying this SNP-binning strategy (Supplementary Fig. 2). We performed a two-component bivariate
GREML analysis (based on GRM-specific) to estimate rg in each FST group and found no significant difference
in r̂g between the two FST groups for both traits although the standard errors of r̂g were large (Table 2). Even if
our previous study has shown that height increasing alleles are more frequent in EUR than AFR39, which might
explain the mean difference in height phenotype between EUR and AFR, the result reported here suggests that
the population differentiation of frequencies of the height-associated SNPs does not seem to affect the genetic
correlation between populations. Nevertheless, it is possible that there is a difference in rg between the two FST
groups but the power of this study is not large enough to detect it.
We applied the same SNP-binning strategy to test whether the estimate of genetic correlation differs when
the SNPs are ascertained by difference in LD between populations (Supplementary Fig. 3). We used a metric
called LDCV (i.e., coefficient of variation of the LD scores across populations) proposed in a previous study39
to measure the differentiation of LD-score between EUR and AFR for each SNP (Methods). We stratified the
SNPs into two LDCV groups with no difference in MAF or LD score between the groups in each individual
population using the approach described above (Methods; Supplementary Fig. 4) and estimated rg by a two-
component bivariate GREML analysis. We found no significant difference in the estimate of r̂g between the two
LDCV groups (Table 2), which does not support a significant role of LD difference in the between-population
genetic heterogeneity at common SNPs but also could be due to the lack of power if the difference in rg between
the two LDCV groups is very small.
Discussion
In this study we showed a substantial genetic overlap at HapMap3 SNPs (MAF > 0.01) for height and BMI between
EUR and AFR (r̂g = 0.75 with s.e. = 0.035 for height and 0.68 with s.e. = 0.062 for BMI; Table 1) from a cross-
population bivariate GREML analysis of individual-level genotype data30 and between EUR and EAS (r̂g = 0.80
with s.e. = 0.037 for BMI) by a summary-data-based a pproach13. All these estimates were significantly smaller
than 1 (Table 1), suggesting some genetic heterogeneity between populations for both traits. We then used the
recently developed rb approach31 that is able to estimate the correlation of SNP effects between populations
accounting for estimation errors in estimated SNP effects (Fig. 1), and confirmed the estimates by a bivariate
GREML analysis using individual-level data. The bivariate GREML estimate of rg at the sentinel SNPs between
EUR and AFR was marginally larger than the estimate for height (r̂g(GWS) = 0.82 with s.e. = 0.030 vs. r̂g = 0.75
with s.e. = 0.035; P = 0.13), but the difference was larger for BMI (r̂g(GWS) = 0.87 with s.e. = 0.064 vs. r̂g = 0.68
with s.e. = 0.062; P = 0.032), which may due to a difference in genetic architecture between the two traits and/
or the relatively small number of sentinel SNPs used for BMI. The estimated strong correlation in SNP effect
between populations is in line with the finding from previous studies that GWAS results from EUR population
are largely consistent with those from non-EUR populations for a certain number of complex t raits17,40–45. How-
ever, the extent to which the EUR-based GWAS findings can be replicated in non-EUR populations can be trait-
dependent5,22. To show this, we estimated r̂g between UKB-EUR (n = ~ 450 k) and UKB-AFR (n = ~ 6,300) for 42
additional quantitative traits using P opcorn13, a summary data-based approach for estimating cross-population rg .
The median of the r̂g across the 42 traits was 0.94, consistent with our conclusion above (Supplementary Fig. 5).
We also attempted to quantify the effect of population differentiation in SNP allele frequencies on the between-
population genetic heterogeneity by comparing r̂g estimated from SNPs with higher FST to that estimated from
SNPs with lower FST but found no significant difference in r̂g between the two FST groups (Table 2). In addition, it
should be noted that differences in SNP effects between populations could reflect the differences in causal effects
and/or LD between SNPs and causal variants. Our estimated genetic effect correlation at all SNPs between EUR
and AFR for height (r̂g = 0.75 with s.e. = 0.035; Table 1) was largely consistent with the causal effect correlation
between EUR and SAS (ρ̂b = 0.78, s.e. = 0.26) estimated in a previous study14. Although the standard error of ρ̂b
is large, the causal effect correlation between EUR and AFR is similar to that between EUR and SAS. Then, the
results seem to imply that, on average, the extent to which the difference in SNP effects between populations due
to the difference in LD is unlikely to be large for common SNPs. This implication is consistent with our LDCV
partitioning analysis which showed no significant difference in r̂g between common SNPs with higher and lower
LDCV (Table 2). However, it should be noted that LDCV may differ from the between-population difference in
LD between SNPs and causal variants.
Scientific Reports | (2021) 11:5240 | https://doi.org/10.1038/s41598-021-84739-z 4
Vol:.(1234567890)www.nature.com/scientificreports/
In summary, our study confirmed a large estimate of genetic correlation at common SNPs between world-
wide populations for h eight14 and showed a similar level of between-population genetic correlation for BMI. We
observed that the estimate of SNP effect correlation at the genome-wide significant SNPs was only marginally
larger than the estimate of genetic correlation using all SNPs for height but the difference was more pronounced
for BMI. We caution that the difference between r̂g(GWS) and r̂g needs to be quantified in higher precision and the
extent to which the between-population genetic heterogeneity for a trait due to differences in allele frequency
and LD need to be tested in data sets with larger sample sizes in the future. Moreover, an observed between-
population genetic heterogeneity for a complex trait could also be due to the interactions between genetic
(G) and environmental (E) factors. The genotype-by-environment interaction component would be partially
eliminated in rg estimation in the study design where two populations differ in genetic ancestry but live in the
same environment conditions. We acknowledge that all the conclusions are restricted to common SNPs. The
between-population genetic heterogeneity for complex traits at rare variants (or the variants that are rare in one
population but common in another) remains to be explored with whole-genome sequence data in large s amples46.
Nevertheless, all our results are consistent with the conclusion that most GWAS findings at common SNPs from
EUR populations are largely applicable to non-EUR for height and BMI for variant/gene discovery purposes.
However, cautions are required for phenotype (or disease risk) prediction given the limited accuracy of genetic
prediction using EUR-based GWAS results in non-EUR populations. As discussed in recent studies5,29, a number
of genetic and non-genetic factors affect the accuracy of using predictors constructed in EUR populations in
non-EUR populations, such as the differences in genetic architecture, allele frequency and LD structure between
EUR and non-EUR populations, and the differences in environmental exposures and definitions of clinical phe-
notypes. By modelling the relative accuracy (RA, relative to the accuracy in populations of same ancestry as the
discovery population), Wang et al. quantified how much proportion of the loss of RA using EUR-based PRS in
AFR can be explained by the differences in allele frequency and LD47. They found the quantities varied between
traits, e.g., ~ 65% for height and ~ 84% for T2D, reflecting differences in genetic architecture between traits (e.g.,
heritability, polygenicity and cross-ancestry effect size correlation)47. One of the limitations of our study is that
African Americans have substantial proportions of European ancestry, and our data do not cover the full diversity
of the European and non-European populations. We focus only on the individuals that show similar ancestries
with the individuals of European and African ancestries, respectively, in the 1000G (Supplementary Fig. 1). To
examine whether the QC step of removing PC outliers is effective for removing AFR individuals with high EUR
ancestry, we estimated the percentage of European ancestry using ADMIXTURE in our AFR data before QC,
AFR after QC (outlier removal), and unrelated AFR after QC. The results show that our QC steps have effectively
removed AFR individuals with high proportions of EUR ancestry (Supplementary Fig. 6; corresponding to the
3 panels in Supplementary Fig. 1). A further QC criterion based on the estimated EUR ancestry (e.g., > 0.1) only
removed 60 AFR individuals, which did not lead to notable differences in ĥ2SNP and r̂g (e.g., height ĥ2SNP = 0.39
(s.e. = 0.024) in AFR and r̂g between EUR and AFR = 0.75 (s.e. = 0.035) using the original QC compared to
ĥ2SNP = 0.39 (s.e. = 0.024) in AFR and r̂g = 0.75 (s.e. = 0.035) with the new QC step for height; Supplementary
Table 4). To further demonstrate the effect of the admixture on the ĥ2SNP and r̂g , we divided AFR (corresponding
to panel 3 in Supplementary Fig. 6) into two groups with higher and lower proportions of European ancestry,
respectively (n = 8,847 for each group). The EUR data used in bivariate GREML analysis were two random sets
(n = 50,000 for each) from UKB-EUR. We found that compared to the original r̂g between EUR and AFR (r̂g =
0.75 with s.e. = 0.035 for height and r̂g = 0.68 with s.e. = 0.062 for BMI), the estimated r̂g appeared to be lower
using the AFR samples that have lower proportion of European ancestry (r̂g = 0.69 with s.e. = 0.060 for height
and r̂g = 0.53 with s.e. = 0.084 for BMI), and higher using AFR samples with higher proportion of European
ancestry (r̂g = 0.78 with s.e. 0.058 for height and r̂g = 0.74 with s.e. = 0.12 for BMI; Supplementary Table 5).
However, none of the difference were statistically significant, which could be due to the limited power of our data.
Methods
Data. GWAS data of 456,422 individuals of European ancestry were from the UKB (EUR-UKB). GWAS
data of 24,077 individuals of African ancestry were from the UKB (AFR-UKB, n = 8230), the Women’s Health
Initiative (WHI; n = 7480), and the National Heart, Lung, and Blood Institute’s Candidate Gene Association
Resource (CARe) including ARIC, JHS, CARDIA, CFS and MESA (n = 8367)48. QC of the UKB SNP geno-
types had been conducted by the UKB QC team32 and the EUR-UKB data had been imputed to the HRC and
UK10K reference panel. For the EUR-UKB imputed data (hard-call genotypes), we filtered out SNPs with miss-
ing genotype rate > 0.05, MAF < 0.01, imputation INFO score < 0.03 or P-value for HWE test 0.05 in each population (retained 348,501 and 17,693 unrelated individuals in the EUR-UKB and AFR,
respectively). These unrelated AFR individuals were a subset of the AFR samples after PC-based QC. The first
20 principal components (PCs) were derived from the GRM in each population. Phenotypes in each population
were adjusted for covariates (i.e., age in AFR-WC, and age and assessment centre in EUR-UKB and AFR-UKB)
Scientific Reports | (2021) 11:5240 | https://doi.org/10.1038/s41598-021-84739-z 5
Vol.:(0123456789)www.nature.com/scientificreports/
in each gender group of each cohort and inverse-normal transformed after removing outliers that were 5 s.d.
from the mean for height and 7 s.d. from the mean for BMI (because the phenotype distribution tends to be right
skewed for BMI). We choose these two traits because they are two of the most commonly studied quantitative
traits and we only have access to the individual-level data of only these two traits in WHI-AFR.
Estimation of h2SNP and r g using all HapMap3 SNPs. To estimate h2SNP and cross-population rg for
height and BMI, we conducted a bivariate GREML analysis using all HapMap3 SNPs in the unrelated individuals
(genetic relatedness < 0.05). For the ease of computation, only 50,000 EUR individuals randomly sampled from
the EUR-UKB data were included in the GREML analysis (all the AFR unrelated individuals were included in
the analysis). To build the GRM for the bivariate GRM analysis (denoted by GRM-specific), the SNP genotypes
(x−2p)
were standardized based on the allele frequencies in a specific population (i.e., √ with x being coded as 0,
2p(1−p)
1 or 2 and p being the allele frequency in EUR, for example) using GCTA (–sub-popu option)51. The bivariate
GREML analyses were then performed for height and BMI using the GRM-specific in a combined sample of
EUR and AFR. The first 20 PCs generated from the GRM-specific were fitted as covariates in the bivariate
GREML to control for population stratification. Only the samples that have both the genotype and phenotype
data were included in the bivariate GREML analysis (n = 49,839 for EUR and n = 17,426 for AFR). We also per-
formed the bivariate GREML analyses based on GRMs (and PCs thereof) for which the SNP genotypes were
standardized using the allele frequencies computed from the combined sample of EUR and AFR. The bivariate
GREML analyses were also performed to estimate rg(GWS) using the GRM-specific built from the sentinel SNPs
for both traits. To estimate rg between UKB-EUR and UKB-AFR for the additional 42 quantitative traits, we did
GWAS for ~ 6300 individuals in UKB-AFR across traits using fastGWA52. The GWAS summary data for UKB-
EUR (n = ~ 450 k) have been published in a previous study52 and are publicly available (see URLs).
To compare the difference in r̂g between SNP groups with higher and lower FST , we computed FST between
EUR and AFR for each SNP in GCTA (–fst option)51. We first split the SNPs into 125 bins according to their
MAF in EUR and 125 bins based on the frequencies of the same alleles in AFR (125*125 frequency bins in total).
We next split each frequency bin into 4 LD bins according to LD scores of the SNPs34 in EUR and 4 bins based
on LD scores in AFR. We thereby obtained 250,000 (125*125*4*4) bins in total. We then equally divided the
SNPs in each bin (m = 4 in most bins) into two groups according to the sorted FST values. There were a small
number of bins with only 3 SNPs. For those bins, we randomly allocated 1 or 2 SNPs to the high-FST group and
the remaining SNPs to the low-FST group. Finally, we combined the SNPs across all the bins with high and low
FST respectively and computed the GRM-specific for each of the two SNP groups, and fitted the two GRMs
jointly in a bivariate GREML analysis to estimate the between-population rg and the population-specific h2SNP in
each FST group for height and BMI. The first 20 PCs generated from the GRM-specific were fitted as covariates
in the GREML analysis. The same strategy was applied to the LDCV stratification based on 250,000 bins includ-
ing 20*20 frequency bins and 25*25 LD bins. The method to compute LDCV has been described e lsewhere39.
Testing the difference in r̂g between SNP sets. We tested the difference in r̂g between two SNP sets
(e.g., the two FST-stratified SNP sets described above). We computed the P-value for the difference using a χ 2
(r̂ −r̂g2 )2
statistic with one degree of freedom, where χ 2 = varg1 with r̂ and r̂g2 representing the estimates of the
(r̂g1
−r̂g2 )
g1
two SNP sets respectively, and var r̂g1 − r̂g2 = var r̂g1 + var r̂g2 − 2cov r̂g1 , r̂g2 . In the bivariate GREML
C
analysis, rg is defined as rg = √V g (p1 ,pV2 ) where Cg (p1 ,p2 ) is genetic covariance between populations; Vg (p1 ) (or
g (p1 ) g (p2 )
Vg (p2 )) is the genetic variance in a population. The sampling variance of the estimate of rg in a SNP set is
� � � � � � � �
var V̂g (p1 ) var V̂g (p2 ) var Ĉg (p1 ,p2 ) cov V̂g (p1 ) , V̂g (p2 )
var r̂g = rg2
� �
+ + +
4Vg2(p ) 4Vg2(p ) Cg2(p ,p ) 2Vg (p1 ) Vg (p2 )
1 2 1 2
� � � �
cov V̂g (p1 ) , Ĉg (p1 ,p2 ) cov V̂g (p2 ) , Ĉg (p1 ,p2 )
− −
Vg (p1 ) Cg (p1 ,p2 ) Vg (p2 ) Cg (p1 ,p2 )
The sampling covariance of the estimates of rg between two SNP sets is
cov V̂g(p1 s1 ) , V̂g(p1 s2 ) cov V̂g(p1 s1 ) , V̂g(p2 s2 ) cov V̂g(p1 s1 ) , Ĉg(p1 p2 s2 )
cov r̂g1 , r̂g2 = rg1 rg2 [ + −
4Vg(p1 s1 ) Vg(p1 s2 ) 4Vg(p1 s1 ) Vg(p2 s2 ) 2Vg(p1 s1 ) Cg(p1 p2 s2 )
cov V̂g(p2 s1 ) , V̂g(p1 s2 ) cov V̂g(p2 s1 ) , V̂g(p2 s2 ) cov V̂g(p2 s1 ) , Ĉg(p1 p2 s2 )
+ + −
4Vg(p2 s1 ) Vg(p1 s2 ) 4Vg(p2 s1 ) Vg(p2 s2 ) 2Vg(p2 s1 ) Cg(p1 p2 s2 )
cov V̂g(p1 s2 ) , Ĉg(p1 p2 s1 ) cov V̂g(p2 s2 ) , Ĉg(p1 p2 s1 ) cov Ĉg(p1 p2 s1 ) , Ĉg(p1 p2 s2 )
− − + ]
2Vg(p1 s2 ) Cg(p1 p2 s1 ) 2Vg(p2 s2 ) Cg(p1 p2 s1 ) Cg(p1 p2 s1 ) Cg(p1 p2 s2 )
where the subscripts s1 (or s2) represents a SNP set. In practice,
the parameters
in the equations above can be
replaced by their estimates to compute the estimates of var r̂g and cov r̂g1 , r̂g2 .
Scientific Reports | (2021) 11:5240 | https://doi.org/10.1038/s41598-021-84739-z 6
Vol:.(1234567890)www.nature.com/scientificreports/
Estimation of SNP effect correlation between populations from GWAS summary data. We
obtained the trait-associated SNPs for height and BMI from the GIANT meta-analyses35,36. We used the rb
method developed by Qi et al.31 to estimate the correlation of SNP effects between populations at the top associ-
ated SNPs accounting for sampling errors in the estimated SNP effects. To avoid bias due to ‘winner’s curse’, we
re-estimated the SNP effects in our samples (independent from the samples used in the GIANT meta-analysis)
using fastGWA52. Since fastGWA controls for relatedness52, we used all the samples passed QC (including close
relatives) for the GWAS analysis (n = 456, 422 for EUR and 23, 355 for AFR after PC-based QC). The pheno-
types were cleaned and normalized using the same strategy described above. The first 20 PCs were included as
covariates in the fastGWA analysis to control for population stratification. To get a set of independent SNPs
associated with a trait, we did a LD-based clumping analysis in PLINK37 (threshold P-value = 5 × 10⁻⁸, window
size = 1 Mb and LD r 2 threshold = 0.01). After the clumping analysis, there were 538 and 57 near-independent
SNPs associated with height and BMI respectively, which we call sentinel SNPs. To avoid potential bias in r̂g(GWS)
due to remaining LD between the sentinel SNPs, we performed an additional round of the clumping analysis
with a much larger window size (i.e., 10 Mb) and obtained 531 and 56 sentinel SNPs for height and BMI respec-
tively. The sampling variance of r̂g(GWS) was computed by a Jackknife resampling process31.
URLs. GCTA: http://cnsgenomics.com/software/gcta
PLINK: https://www.cog-genomics.org/plink2
Popcorn: https://github.com/brielin/Popcorn
GWAS summary data for height and BMI in GIANT: https://www.broadinstitute.org/collaboration/giant/
index.php/GIANT_consortium_data_files
GWAS summary data for BMI in Biobank Japan in NBDC Human Database:
https://humandbs.biosciencedbc.jp/en/
UKB consortium: http://www.ukbiobank.ac.uk/
UKB-EUR GWAS summary data: http://fastgwa.info/ukbimp/phenotypes
Affymetrix Human Origins array: http://www.affymetrix.com/support/technical/byproduct.affx?produ
ct=Axiom_GW_HuOrigin
ADMIXTURE: http://dalexander.github.io/admixture/publications.html
Data availability
See URLs and acknowledgements for GWAS summary data and individual data respectively.
Received: 28 November 2019; Accepted: 22 February 2021
References
1. Timpson, N. J., Greenwood, C. M. T., Soranzo, N., Lawson, D. J. & Richards, J. B. Genetic architecture: the shape of the genetic
contribution to human traits and disease. Nat. Rev. Genet. 19, 110–124 (2018).
2. Robinson, M. R. et al. Genotype-covariate interaction effects and the heritability of adult body mass index. Nat. Genet. 49,
1174–1181 (2017).
3. Buniello, A. et al. The NHGRI-EBI GWAS Catalog of published genome-wide association studies, targeted arrays and summary
statistics 2019. Nucleic Acids Res 47, D1005–D1012 (2019).
4. Visscher, P. M. et al. 10 years of GWAS discovery: Biology, function, and translation. Am. J. Hum. Genet. 101, 5–22 (2017).
5. Martin, A. R. et al. Clinical use of current polygenic risk scores may exacerbate health disparities. Nat. Genet. 51, 584–591 (2019).
6. Martin, A. R. et al. An unexpectedly complex architecture for skin pigmentation in Africans. Cell 171, 1340–1353 (2017).
7. Hoffmann, T.J. et al. A large multiethnic genome-wide association study of prostate cancer identifies novel risk variants and
substantial ethnic differences. Cancer Discov. (2015).
8. Rosenberg, N. A. et al. Genome-wide association studies in diverse populations. Nat. Rev. Genet. 11, 356–366 (2010).
9. Hindorff, L. A. et al. Prioritizing diversity in human genomics research. Nat. Rev. Genet. 19, 175–185 (2018).
10. Akiyama, M. et al. Genome-wide association study identifies 112 new loci for body mass index in the Japanese population. Nat.
Genet. 49, 1458–1467 (2017).
11. Giri, A. et al. Trans-ethnic association study of blood pressure determinants in over 750,000 individuals. Nat. Genet. 51, 51–62
(2019).
12. Kim, M. S., Patel, K. P., Teng, A. K., Berens, A. J. & Lachance, J. Genetic disease risks can be misestimated across global populations.
Genome Biol. 19, 179 (2018).
13. Brown, B.C., AGENTD Consortium, Ye, C.J., Price, A.L. & Zaitlen, N. Transethnic genetic-correlation estimates from summary
statistics. Am. J. Hum. Genet. 99, 76–88 (2016).
14. Galinsky, K. J. et al. Estimating cross-population genetic correlations of causal effect sizes. Genet. Epidemiol. 43, 180–188 (2019).
15. Veturi, Y. et al. Modeling heterogeneity in the genetic architecture of ethnically diverse groups using random effect interaction
models. Genetics 211, 1395–1407 (2019).
16. Falconer, D.S., Mackay, T.F. & Frankham, R. Introduction to quantitative genetics (4th edn). Trends Genet. 12, 280 (1996).
17. de Candia, T. R. et al. Additive genetic variation in schizophrenia risk is shared by populations of African and European descent.
Am. J. Hum. Genet. 93, 463–470 (2013).
18. Yang, J. et al. Genome-wide genetic homogeneity between sexes and populations for human height and body mass index. Hum.
Mol. Genet. 24, 7445–7449 (2015).
19. Mancuso, N. et al. The contribution of rare variation to prostate cancer heritability. Nat. Genet. 48, 30–35 (2016).
20. Liu, J. Z. et al. Association analyses identify 38 susceptibility loci for inflammatory bowel disease and highlight shared genetic risk
across populations. Nat. Genet. 47, 979–986 (2015).
21. Ikeda, M. et al. A genome-wide association study identifies two novel susceptibility loci and trans population polygenicity associ-
ated with bipolar disorder. Mol. Psychiatry 23, 639–649 (2018).
22. Bigdeli, T. B. et al. Genetic effects influencing risk for major depressive disorder in China and Europe. Transl. Psychiatry 7, e1074
(2017).
23. Wright, S. The genetical structure of populations. Ann. Eugen. 15, 323–354 (1951).
Scientific Reports | (2021) 11:5240 | https://doi.org/10.1038/s41598-021-84739-z 7
Vol.:(0123456789)www.nature.com/scientificreports/
24. Kichaev, G. & Pasaniuc, B. Leveraging functional-annotation data in trans-ethnic fine-mapping studies. Am. J. Hum. Genet. 97,
260–271 (2015).
25. Ong, R. T., Wang, X., Liu, X. & Teo, Y. Y. Efficiency of trans-ethnic genome-wide meta-analysis and fine-mapping. Eur. J. Hum.
Genet. 20, 1300–1307 (2012).
26. Morris, A. P. Transethnic meta-analysis of genomewide association studies. Genet. Epidemiol. 35, 809–822 (2011).
27. Zaitlen, N., Paşaniuc, B., Gur, T., Ziv, E. & Halperin, E. Leveraging genetic variability across populations for the identification of
causal variants. Am. J. Hum. Genet. 86, 23–33 (2010).
28. Teo, Y. Y., Ong, R. T., Sim, X., Tai, E. S. & Chia, K. S. Identifying candidate causal variants via trans-population fine-mapping.
Genet. Epidemiol. 34, 653–664 (2010).
29. Martin, A. R. et al. Human demographic history impacts genetic risk prediction across diverse populations. Am. J. Hum. Genet.
100, 635–649 (2017).
30. Lee, S. H., Yang, J., Goddard, M. E., Visscher, P. M. & Wray, N. R. Estimation of pleiotropy between complex diseases using single-
nucleotide polymorphism-derived genomic relationships and restricted maximum likelihood. Bioinformatics 28, 2540–2542 (2012).
31. Qi, T. et al. Identifying gene targets for brain-related traits using transcriptomic and methylomic data from blood. Nat. Commun.
9(2018).
32. Bycroft, C. et al. Genome-wide genetic data on ~500,000 UK Biobank participants. BioRxiv, 166298 (2017).
33. Yang, J. et al. Common SNPs explain a large proportion of the heritability for human height. Nat. Genet. 42, 565–569 (2010).
34. Yang, J. et al. Genetic variance estimation with imputed variants finds negligible missing heritability for human height and body
mass index. Nat. Genet. 47, 1114–1120 (2015).
35. Locke, A. E. et al. Genetic studies of body mass index yield new insights for obesity biology. Nature 518, 197–206 (2015).
36. Wood, A. R. et al. Defining the role of common variation in the genomic and biological architecture of adult human height. Nat.
Genet. 46, 1173–1186 (2014).
37. Purcell, S. et al. PLINK: A tool set for whole-genome association and population-based linkage analyses. Am. J. Hum. Genet. 81,
559–575 (2007).
38. Kanai, M. et al. Genetic analysis of quantitative traits in the Japanese population links cell types to complex human diseases. Nat.
Genet. 50, 390–400 (2018).
39. Guo, J. et al. Global genetic differentiation of complex traits shaped by natural selection in humans. Nat. Commun. 9, 1865 (2018).
40. Marigorta, U. M. & Navarro, A. High trans-ethnic replicability of GWAS results implies common causal variants. PLoS Genet. 9,
e1003566 (2013).
41. Marigorta, U. M., Rodriguez, J. A., Gibson, G. & Navarro, A. Replicability and prediction: Lessons and challenges from GWAS.
Trends Genet 34, 504–517 (2018).
42. Waters, K. M. et al. Generalizability of associations from prostate cancer genome-wide association studies in multiple populations.
Cancer Epidemiol. Biomark. Prev. 18, 1285–1289 (2009).
43. Waters, K.M. et al. Consistent association of type 2 diabetes risk variants found in Europeans in diverse racial and ethnic groups.
Plos Genet. 6 (2010).
44. Carlson, C. S. et al. Generalization and dilution of association results from European GWAS in populations of non-European
ancestry: The PAGE study. PLoS Biol 11, e1001661 (2013).
45. Fu, J. Y., Festen, E. A. M. & Wijmenga, C. Multi-ethnic studies in complex traits. Hum. Mol. Genet. 20, R206–R213 (2011).
46. Wainschtein, P. et al. Recovery of trait heritability from whole genome sequence data. bioRxiv, 588020 (2019).
47. Wang, Y. et al. Theoretical and empirical quantification of the accuracy of polygenic scores in ancestry divergent populations. Nat.
Commun. 11, 3865 (2020).
48. Musunuru, K. et al. Candidate gene association resource (CARe): Design, methods, and proof of concept. Circ. Cardiovas. Genet.
3, 267–275 (2010).
49. Howie, B. N., Donnelly, P. & Marchini, J. A flexible and accurate genotype imputation method for the next generation of genome-
wide association studies. PLoS Genet. 5, e1000529 (2009).
50. Yengo, L. et al. Meta-analysis of genome-wide association studies for height and body mass index in ~700,000 individuals of
European ancestry. Hum. Mol. Genet. 27, 3641–3649 (2018).
51. Yang, J., Lee, S. H., Goddard, M. E. & Visscher, P. M. GCTA: A tool for genome-wide complex trait analysis. Am. J. Hum. Genet.
88, 76–82 (2011).
52. Jiang, L. et al. A resource-efficient tool for mixed model association analysis of large-scale data. bioRxiv, 598110 (2019).
Acknowledgements
This research was supported by the Australian National Health and Medical Research Council (1078037 and
1113400), the Australian Research Council (FT180100186 and FL180100072), the Sylvia & Charles Viertel Chari-
table Foundation (Senior Medical Research Fellowship), and the Westlake Education Foundation. This study uses
AFR data from the database of Genotypes and Phenotypes (dbGaP) (accession numbers: phs000386 for AFR-
WHI; AFR-CARe including phs000557.v4.p1, phs000286.v5.p1, phs000613.v1.p2, phs000284.v2.p1, phs000283.
v7.p3 for ARIC, JHS, CARDIA, CFS and MESA) and EUR data from the UKB consortium.
Author contributions
J.Y. and P.M.V. conceived the study. J.Y. and J.G. designed the experiment. J.G. performed statistical analyses
under the assistance and guidance from A.B., Y.W., L.J., L.Y., M.E.G., P.M.V. and J.Y., A.B., Y.W., L.J. and L.Y.
contributed to data preparation. P.M.V. and J.Y. contributed resources and funding. J.G. and J.Y. wrote the manu-
script with the participation of all authors. All authors reviewed and approved the final manuscript.
Competing interests
The authors declare no competing interests.
Additional information
Supplementary Information The online version contains supplementary material available at https://doi.
org/10.1038/s41598-021-84739-z.
Correspondence and requests for materials should be addressed to J.Y.
Reprints and permissions information is available at www.nature.com/reprints.
Scientific Reports | (2021) 11:5240 | https://doi.org/10.1038/s41598-021-84739-z 8
Vol:.(1234567890)www.nature.com/scientificreports/
Publisher’s note Springer Nature remains neutral with regard to jurisdictional claims in published maps and
institutional affiliations.
Open Access This article is licensed under a Creative Commons Attribution 4.0 International
License, which permits use, sharing, adaptation, distribution and reproduction in any medium or
format, as long as you give appropriate credit to the original author(s) and the source, provide a link to the
Creative Commons licence, and indicate if changes were made. The images or other third party material in this
article are included in the article’s Creative Commons licence, unless indicated otherwise in a credit line to the
material. If material is not included in the article’s Creative Commons licence and your intended use is not
permitted by statutory regulation or exceeds the permitted use, you will need to obtain permission directly from
the copyright holder. To view a copy of this licence, visit http://creativecommons.org/licenses/by/4.0/.
© The Author(s) 2021
Scientific Reports | (2021) 11:5240 | https://doi.org/10.1038/s41598-021-84739-z 9
Vol.:(0123456789)Minerva Access is the Institutional Repository of The University of Melbourne Author/s: Guo, J; Bakshi, A; Wang, Y; Jiang, L; Yengo, L; Goddard, ME; Visscher, PM; Yang, J Title: Quantifying genetic heterogeneity between continental populations for human height and body mass index Date: 2021-03-04 Citation: Guo, J., Bakshi, A., Wang, Y., Jiang, L., Yengo, L., Goddard, M. E., Visscher, P. M. & Yang, J. (2021). Quantifying genetic heterogeneity between continental populations for human height and body mass index. SCIENTIFIC REPORTS, 11 (1), https://doi.org/10.1038/s41598- 021-84739-z. Persistent Link: http://hdl.handle.net/11343/273132 File Description: Published version License: CC BY
You can also read