Quality, Diverse Group of Mining Assets - TSX: TKO NYSE MKT: TGB
←
→
Page content transcription
If your browser does not render page correctly, please read the page content below
Quality, Diverse Group of
Mining Assets

March 2017                  TSX: TKO
                            NYSE MKT: TGB
                                            1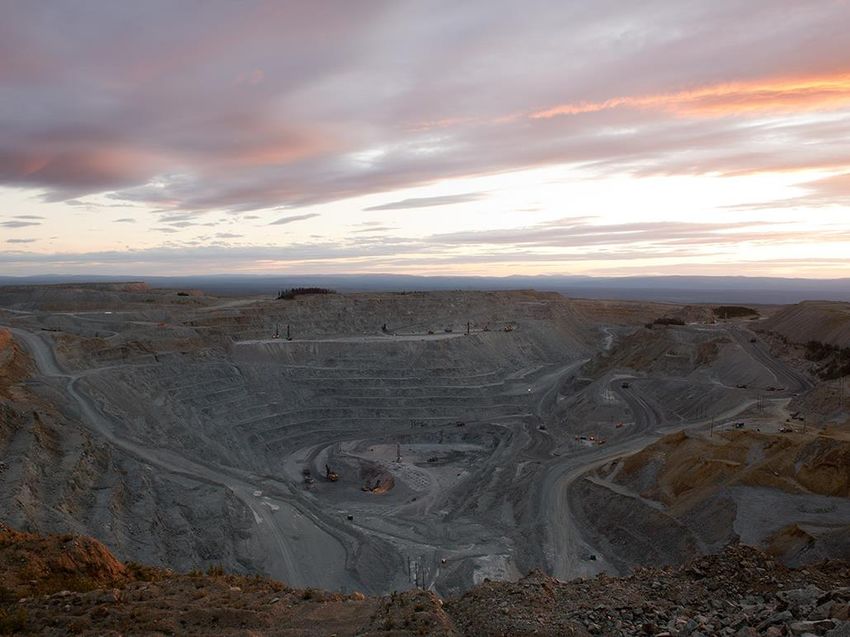
Forward Looking
Statements

 Some of the statements contained in the following material are "forward-looking
 statements". All statements in this release, other than statements of historical
 facts, that address estimated mineral resource and reserve quantities, grades
 and contained metal, and possible future mining, exploration and development
 activities, are forward-looking statements. Although the Company believes the
 expectations expressed in such forward-looking statements are based on
 reasonable assumptions, such statements should not be in any way construed as
 guarantees of future performance and actual results or developments may differ
 materially from those in the forward-looking statements. Factors that could
 cause actual results to differ materially from those in forward-looking statements
 include market prices for metals, the conclusions of detailed feasibility and
 technical analyses, lower than expected grades and quantities of resources,
 mining rates and recovery rates and the lack of availability of necessary capital,
 which may not be available to the Company on terms acceptable to it or at all.
 The Company is subject to the specific risks inherent in the mining business as
 well as general economic and business conditions. For more information on the
 Company, Investors should review the Company's annual Form 40-F filing with
 the United States Securities Commission at www.sec.gov. and its Canadian
 securities filings that are available at www.sedar.com.

                                                                                      2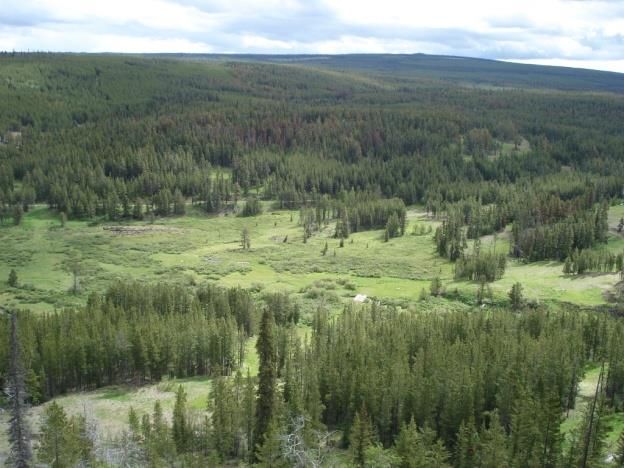
Diversified Asset Base
Gibraltar (Cu-Mo) – 75%
  4th largest open-pit copper mine in North
  America                                      Aley (Nb) – 100%
  722 million tons P&P reserve, with add’l       3rd largest niobium deposit in the world
  resources expected to convert to reserves      84 million tonne P&P reserve @ 0.50%
  22 year mine life                              Nb2O5 (286 million tonne M&I resource)
  140 million lbs cu & 2.5 million lbs mo        24 year mine life
  average annual production (LOM)                Expected to produce 9 million kgs of Nb
                                                 annually

  New Prosperity (Cu-Au) – 100%
    1.0 billion tonne ore body
    10th largest undeveloped cu-au
    project in the world, 2nd largest in
    North America
    13.3 million ounces of gold, 5.3 billion
    lbs of Cu
                                                       Florence (Cu) – 100%
                                                         345 million ton reserve @
                                                         0.36% Cu
                                                         81 million lbs cu average
                                                         annual production
                                                         21 year mine life

                                                                                        3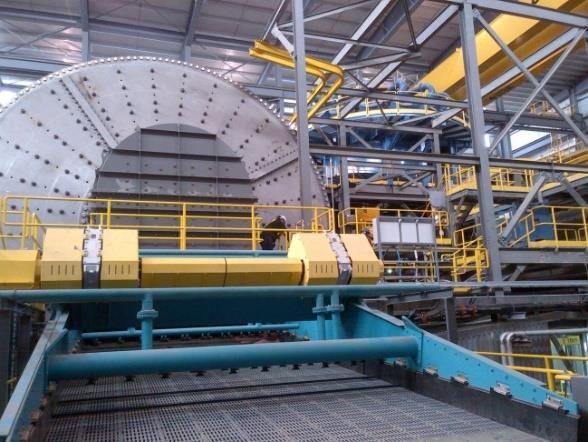
Recent Results
     Strong Finish to 2016 – An Example of performance to come…

     • Strong production performance, copper price recovery & continued C$
       weakness resulted in excellent fourth quarter results
     • Expect performance to continue throughout 2017

        Copper Production – MM lbs                Total Operating Costs (C1) – US$/lb              Cost/ton Milled – C$
                                          $2.50                                         $10.00
50
40                                        $2.00                                          $7.50
30                                        $1.50
                                                                                         $5.00
20                                        $1.00
                                          $0.50                                          $2.50
10
 0                                        $0.00                                          $0.00
        Q1        Q2      Q3         Q4                Q1       Q2       Q3        Q4            Q1       Q2       Q3       Q4

          Realized Price – US$/lb                      Adjusted EBITDA – MM$                     Cash Flow from Ops – MM$
$2.50                                      $50                                             $70

                                                                                           $50
$2.00                                      $30
                                                                                           $30
$1.50                                      $10
                                                                                           $10

$1.00                                     -$10                                            -$10
             Q1    Q2      Q3        Q4               Q1        Q2       Q3        Q4            Q1       Q2       Q3       Q4

                                                                                                                                 4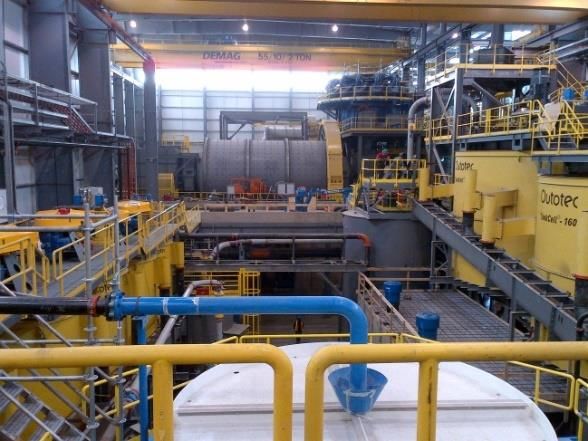
Gibraltar Silver Stream Sale for US$33 million
 Silver By-Product Acquired by Osisko Gold Royalties

• The C$44 million strengthens Taseko’s balance sheet and allows the
  Company to advance organic projects without any shareholder dilution
• Silver makes up ~1% of Gibraltar’s total revenue
• Reduced silver revenue offset by increased molybdenum by-product credit

   • Osisko will receive Taseko’s 75% share of payable silver production from Gibraltar until 5.9
     million ounces have been delivered, and 35% of silver production thereafter
   • Osisko will pay US$2.75 per ounce for all silver deliveries made under the contract
   • Osisko has been granted warrants for 3 million common shares of Taseko with a strike price
     of C$2.74 per share (based on a 50% premium to the 10-day VWAP prior to closing )
   • Expected annual silver production of approximately 200,000 ounces for the next 14 years,
     increasing to an average of 350,000 ounces for the remainder of the 23 year reserve life of
     Gibraltar
   • The stream effective date is January 1, 2017
"The Gibraltar silver stream is Osisko's first streaming transaction" commented Sean Roosen, Chair and Chief
Executive Officer of Osisko. "Taseko's management team has a history of success, and we are pleased to partner
with them as they build a strong platform within the copper sector.”

                                                                                                                 5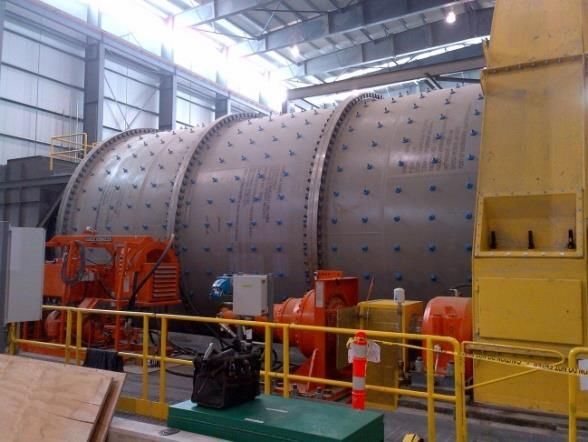
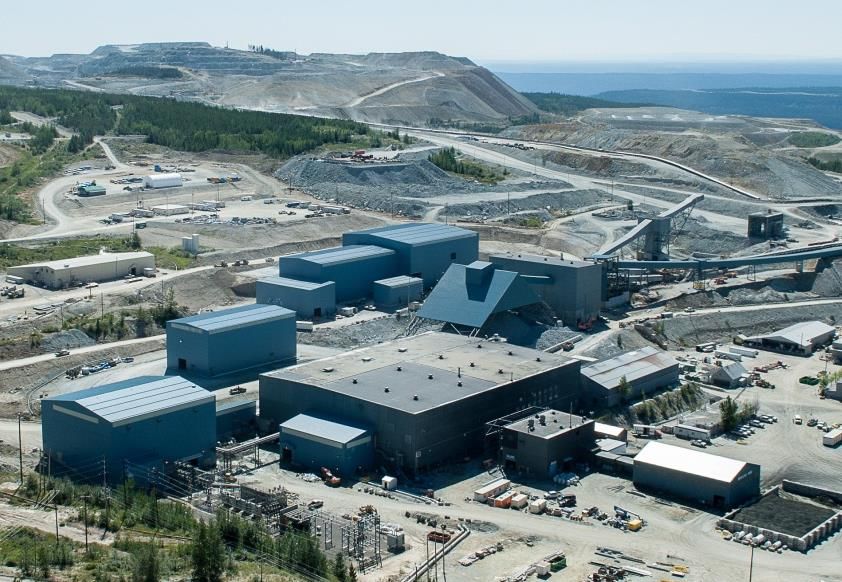
Gibraltar Copper Mine
   Canada’s Second Largest Open-Pit Copper Mine
Location:          65 km north of Williams Lake, British Columbia

Ownership:         75%

                   3.3 billion pounds recoverable copper
Mineral
Reserves:          62 million pounds recoverable molybdenum
                   Reserves Update (Dec 2015: 722m tons at 0.272% copper equivalent*)

                   Open-pit, Copper-Moly Porphyry, average annual copper
Mine Type:
                   production (LOM) 140 million lbs & 2.5 million lbs moly

Mine Life:         22 years

   •   22 year mine life at a milling rate of 85,000 tpd
             •   Average strip ratio 1.9:1
   •   Recent drilling returned exploration potential with gold mineralization and higher
       copper/silver grades
   • Replacement cost ~$1.7B
   • NPV of >$1.3B (after-tax, at $3 copper, 1.30 FX and 8% discount)

                         *Copper equivalent is based on: 85% copper recovery, US$3.00/lb copper price, 50% molybdenum
                         recovery & US$10.00/lb molybdenum price                                                        6
Gibraltar Copper Mine
  GDP3 Expansion – New 30k tpd Concentrator (commissioned in 2013)

34’ SAG Mill              20’ Ball Mill                                       160m3 Float Circuit

   Operating at steady-state              150
                                                              Gibraltar Production (100%, Mlbs Cu)

   after six years of expansion
                                          120
   activities
   Modernized mine stabilized at          90

   reduced operating costs                60

   Production expected to                 30

   increase in 2017 due to higher          0
   grades                                       2006   2007     2008   2009   2010   2011   2012   2013   2014   2015   2016

                                                                                                                               7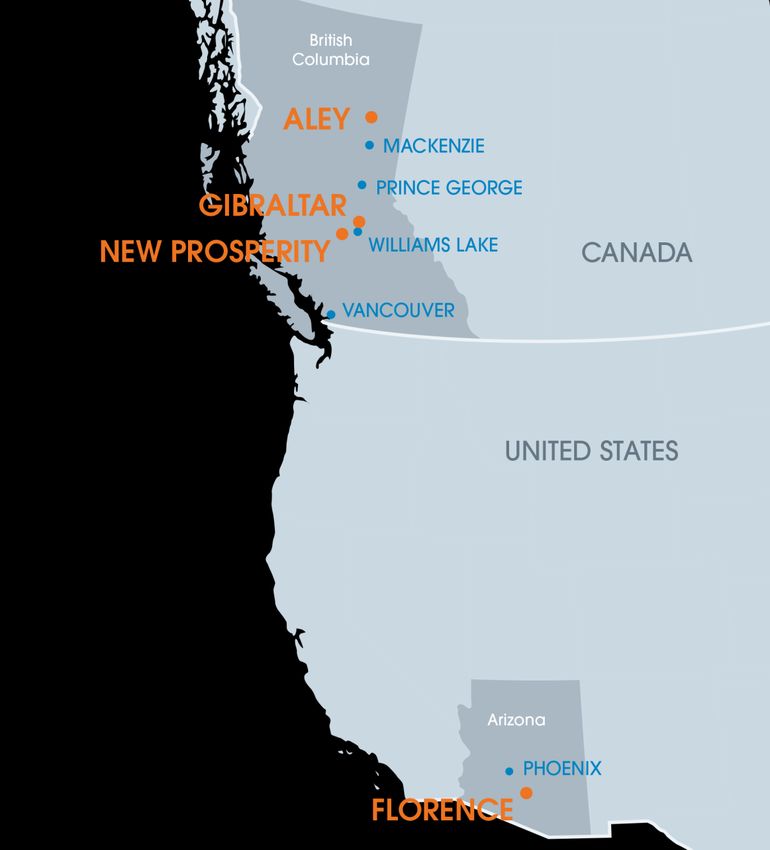
Operating Costs
Focussed on Lower Cost per Ton Milled

• Cost per ton milled sustained at low levels for past two years due to cost
  saving initiatives, including revised mine plan with lower strip ratio
• Comparable open pit mines in South America at $15-20 per ton milled

                                Cost Per Ton Milled (C$)
  $13

  $12

  $11

  $10

   $9

   $8

   $7

   $6
        2012   2013   2014   Q1 15   Q2 15   Q3 15   Q4 15   Q1 16   Q2 16   Q3 16   Q4 16

                                                                                             8
Cost Benefits

BC Advantage
     Low cost power - $0.06/kWh vs. $0.15-$0.20 elsewhere
     Established infrastructure in a favorable jurisdiction – highway access, rail, port,
     grid power (existing infrastructure funded by government)
     Skilled and efficient labor force – similar sized South American mine employs
     50%-100% more employees who are now making US$ wages
                                                       $4.50

                                                                                                         C$3.50
Significant benefit from Canadian dollar               $4.00

     ~80% of operating costs are C$ denominated        $3.50

     Hedge against $USD copper price volatility        $3.00

                                                       $2.50
Recent cost savings initiatives                                       US$ Copper           C$ Copper
                                                       $2.00
     5 year off-take agreement signed in Q4 2015           Jan-10   Jan-11   Jan-12   Jan-13   Jan-14   Jan-15   Jan-16   Jan-17

        • Clean concentrate = below market treatment & refining rates
     New ocean freight contract signed in Q1 2016 at historic low rates
     Supplier initiatives – eg. explosives, grinding media, etc.
                                                                                                                              9
Operating Costs
 Total Operating Costs per Pound (C1)

   Head grade has significant impact on reported C1 cost
   Copper grade expected to average ~0.3% into 2017 compared to
   0.26% in 2016
   Operating costs, on a per pound basis, will be positively impacted
   by 2017 copper grade and ongoing cost reduction initiatives
0.35%                                                                                                              $3.00

0.30%                                                                                                              $2.60

0.25%                                                                                                              $2.20

0.20%                                                                                                              $1.80

0.15%                                                                                                              $1.40

0.10%                                                                                                              $1.00
        Q1 13 Q2 13 Q3 13 Q4 13 Q1 14 Q2 14 Q3 14 Q4 14 Q1 15 Q2 15 Q3 15 Q4 15 Q1 16 Q2 16 Q3 16 Q4 16 E 2017 E

                                     Copper Grade              C1 Costs (US$/lb)
                                                                                                                           10
Operating Margin Sensitivity
Highly levered to copper price recovery and further cost reductions
C1 Costs (US$/lb)
Operating
Margin (C$, $1.80 $1.70 $1.60 $1.50 $1.40 $1.30
millions)
$2.10 $55 $75 $95 $110 $130 $150
Cu Price (US$/lb)
$2.30 $95 $110 $130 $150 $170 $185
$2.50 $130 $150 $170 $185 $205 $225
$2.70* $170 $185 $205 $225 $245 $260
$3.00 $225 $245 $260 $280 $300 $315
Based on LOM average copper production (140 Mlbs)
and FX rate of $C = $US 0.75
*Long-term consensus price for copper & estimated long-term Gibraltar C1 costs
Note: Production is stated as 100% basis
11Valuation Comparable
Teck’s Highland Valley Copper
• Teck recently acquired the remaining 2.5% of their HVC Copper Mine
in British Columbia
• Applying the same valuation to Gibraltar:
In situ recoverable pounds of copper Teck purchased (reserves) 82,000,000
Total paid (C$) $33,000,000
Total paid per pound (C$) $0.40
Gibraltar recoverable pounds (reserves) 3,200,000,000
Taseko share (75%) 2,400,000,000
Price Teck paid per pound (C$) $0.40
Gibraltar in situ value $960,000,000
Less Taseko LT Debt ($360,000,000)
Net Gibraltar in situ value 600,000,000
Taseko outstanding shares 221,800,000
In situ C$/share $2.71
Based on this recent transaction, Taseko is trading at ~40% of the
in situ value of Gibraltar alone
12Florence Copper Project
A Near Term, Low Cost Copper Producer
Location: Central Arizona near the community of Florence
Ownership: 100%
345 million tons grading 0.36% TCu (at a 0.05% total copper
Mineral Reserves:
cutoff) containing 1.7 billion pounds of recoverable copper
Mine Type: In-situ copper recovery
Mine Life: 21 years
Project Highlights
All major power, transportation, road and rail infrastructure in place
All required permits for Phase 1 test facility have been issued
Over $135 million spent on project by former owners Conoco, Magma and BHP Copper Inc. plus
subsequent $15 million spent by Taseko
Prefeasibility studies (2013 & 2017) and successful pilot test by BHP Copper in 1998 confirmed
the project’s economics and integrity
13Florence Copper Project
2017 Technical Study
In January, Taseko announced the results of a two-year metallurgical test program as well as an
optimization of the project well field development sequence
The updated data was used to re-cost the project which resulted in a significant improvement in
project economics
Technical Study* Highlights
Initial capital cost of US$200 million
Payback of capital 2.3 years (pre-tax)
Operating cost of US$1.10/pound LME Grade copper cathode
Average annual copper production of 81 million pounds
Total life of mine production in excess of 1.7 billion pounds of copper
21 year mine life
Net Present Value (NPV) Analysis*
Copper price US$/lb Pre-tax NPV (7.5%) / IRR
$3.00 US$920 Million / 44%
*See news release dated January 16, 2017. The NI 43-101 technical report documenting
these results will be filed on www.sedar.com within 45 days.
14Florence Copper Project
Project development costs and timeline
Phase 1 – Production Test Facility (PTF):
2017 – construction & operation
Phase 2 – Full scale production facility
Permitting – 12 months (initiated during PTF operation)
Construction – 18 months
Copper production - 2020
15Aley Niobium Project
Accretive Development Opportunity
Location: Northern British Columbia
Ownership: 100%
Mine Type: Open Pit, 10,000 tpd mill throughput
Mine Life: 24 years
Project Highlights
Proven and probable reserves of 84 million tonnes grading
0.50% Nb2O5 announced in September 2014
Pre-tax NPV of C$860 million at an 8% discount rate
Pre-tax internal rate of return of 17% with a 5.5 year payback
Anticipated operating margin of US$21/kg of niobium (Nb)
Average annual production of 9 million kilograms Nb in the form of FeNb
Project status
Permitting stage
16Copper Price Leverage
Taseko Cash Flow to Benefit Most in Copper Price Recovery
At At Spot Change
2017 CFPS
Spot +10% +20% Spot +10% Spot +20%
Copper Price $2.19 $2.41 $2.63
Large Cap
FM $1.27 $1.40 $1.53 10% 20%
FCX $2.69 $3.16 $3.63 17% 35%
TCK C$4.20 C$4.41 C$4.61 5% 10%
TRQ ($0.18) ($0.15) ($0.13) 17% 28%
Mid Cap
CS $0.13 $0.22 $0.31 69% 138%
CUM C$0.22 C$0.34 C$0.46 55% 109%
HBM $0.95 $1.11 $1.26 17% 33%
III C$1.74 C$2.02 C$2.30 16% 32%
LUN $0.47 $0.56 $0.64 19% 36%
NSU $0.18 $0.20 $0.22 11% 22%
TKO C$0.12 C$0.25 C$0.39 108% 225%
TCM $0.27 $0.32 $0.37 19% 37%
Source: Scotia Capital Inc. 17Sector Scarcity
TSX/TSXV Copper Producers - 2008
Anvil Mining Ltd.
Capstone Mining Corp.
• Lack of publicly listed intermediate producers and Centenario Copper Corp.
quality development assets stem from a decade of
Copper Mountain Mining Corp.
M&A and corporate activity with little to no new
investment in growth Equinox Minerals Ltd.
First Quantum Minerals Ltd.
Frontera Copper Corp.
Globestar Mining Corp.
TSX/TSXV Copper Producers - 2016
Hudbay Minerals Inc.
Capstone Mining Corp.
Imperial Metals Corp.
Copper Mountain Mining Corp.
Inmet Mining Corp.
First Quantum Minerals Ltd. Lundin Mining Corporation
Hudbay Minerals Inc. Mercator Minerals Ltd.
Imperial Metals Corp. Quadra Mining Ltd.
Lundin Mining Corporation Sherwood Copper Corp.
Nevsun Resources Ltd. Taseko Mines Limited
Taseko Mines Limited Thompson Creek Metals Company
TSX/TSXV Copper Developers - 2008
Turquoise Hill Resources Ltd.
Antares Minerals Inc. Global Copper Corp.
Augusta Resources Corporation Hana Mining Ltd.
• Intermediate peer group down to Chariot Resources Ltd. Kiwara Ltd.
companies, with production ranging from Citadel Resources Group Ltd. Lumina Copper Corp.
80 (Cu Mtn) to 570 Mlbs (Lundin) Continental Resources Corp. Norsemont Mining Inc.
• >50 copper transactions over the past Corriente Resources Inc. Petaquilla Copper Ltd.
Creston Moly Corp. Resevoir Minerals Inc.
decade
Curis Resources Ltd. Scandanavian Minerals Ltd.
Duluth Metals Ltd. Stingray Copper Inc.
Explorator Resources Inc. Terrane Metals Corp.
Source: Haywood Securities 18
Far West Mining Ltd. Tyler Resources Inc.Deeply Discounted Valuation
NPV
$1.0 billion
$1.2 billion
$0.8 billion
$2.1 billion
NPV Total: $5.1 billion
Market Capitalization: $0.4 billion
= 92% discount
19Appendix
20Corporate Information
Cash on Hand (12/31/16): C$89 million
LT Debt (12/31/16) : C$373 million
Listed: TSX; TKO / NYSE MKT; TGB
Shares Outstanding: 221.9 million
Market Capitalization: ~C$400 million
52 Week High/Low: C$2.12/C$0.46; US$1.63/US$0.34
Analyst Coverage: BMO, Scotia Capital, National Bank, Paradigm, TD Newcrest, RBC,
GMP
Target Range: C$0.90 - $2.10
Top Holders: SailingStone (10.2%), Vertex One (4.6%)
Insider Ownership: 5%
21New Prosperity Project
One of the Largest Gold/Copper Porphyries in the World
Location: 125 km south west of Williams Lake, British Columbia
Ownership: 100%
7.7 million ounces recoverable gold
Mineral Reserves:
3.6 billion pounds recoverable copper
Mine Type: Open-pit, 70,000 tpd mill throughput
Mine Life: +20 years
5-year production profile
Yr 1* Yr 2 Yr 3 Yr 4 Yr 5 Average
Gold (ounces) 160,000 300,000 325,000 275,000 305,000 300,000
Copper (thousands, pounds) 75,000 130,000 130,000 120,000 120,000 130,000
Provincial Authorization (Environment Assessment Certificate) in place
Life of mine average annual production ~540,000 gold eq. ozs**
* Based on 6 months production
** Based on long-term Au price US$1000/oz, Cu Price US$2.75/lb 22Aley Niobium Project
What is Niobium
Niobium
Benefits in
Steel
$9 of Niobium
used in a Car
Specifically used in manufacturing high strength, low alloy steels
Green technologies, turbines, aerospace, automobile steels, oil and gas
Global annual consumption of ferro-niobium is 210 million lbs/year
Growing at 5-7% per year
=
100 kg Weight
Reduction in Car
Current pricing of FeNb is ~US$40/kg
3 producers worldwide: CBMM, Brazil; Anglo American, Brazil;
Niobec, Canada
Anglo American recently announced the sale of their Niobium
=
5% Fuel
Efficiency
(similar sized mine to what Aley will be) and Phosphate assets Improvement
in Brazil to China Moly for US$1.7 billion
23Experienced Management Team
Russell Hallbauer, P. Eng - President & CEO and Director – Mr. Hallbauer is a professional engineer with over 35 years of
mining experience. He has a strong background in open pit and underground mining, overseeing operating joint ventures and
revitalizing mines to profitability.
Ron Thiessen, CPA - Chairman – Mr. Thiessen is an accredited public accountant in Canada. For over 25 years, he has
concentrated on the development of venture capital financing for emerging public and private companies. He is a corporate
officer and director of several publicly traded exploration and development companies.
John McManus, P. Eng – Chief Operating Officer– Mr. McManus is a professional engineer who has worked in the BC mining
industry for over 30 years. He has extensive experience in mine operation, mine engineering and environmental
management.
Stuart McDonald, CPA – CFO – Mr. McDonald is a financial executive with over 20 years of professional experience in mining
finance, corporate development, treasury management, and financial reporting. He has held a number of senior financial
positions in the mining industry including Chief Financial Officer of Quadra FNX Mining Ltd.
Brian Battison - Vice President, Corporate Affairs – Mr. Battison is a public affairs specialist with over 25 years of experience
in policy development, issue management and communication in both the private and public sectors. He has been a senior
political and policy advisor in BC and has served as Interim President & CEO of the Mining Association of BC.
Scott Jones, P. Eng - Vice President, Engineering – Mr. Jones has over 25 years of experience in the mining industry, including
property valuations, mining feasibility studies and technical engineering support as well as 10 years in open pit operations
and exploration in BC and the Yukon.
Robert Rotzinger, P. Eng – Vice President, Capital Projects – Mr. Rotzinger is a mechanical engineer and has worked at the
Gibraltar Mine since 1994 where he has taken on increasingly senior positions. He has been tasked with the management of
diverse engineering, environmental, metallurgical and mining initiatives, such as the Phase I and Phase II Gibraltar Expansions
and the GDP3 Project.
Brian Bergot – Vice President, Investor Relations – Mr. Bergot has over 25 years of experience in the natural resources
sector, holding a number of corporate and operational roles, the last 15 years of which have been focused in the investor
relations field.
24Reserves & Resources
New Prosperity
The mineral resource and reserve estimations were completed by Mineral Reserves @ C$5.50 NSR/t Cut-Off1
Taseko staff under the supervision of Scott Jones, P.Eng., Vice-
Grade Recoverable Metal Contained Metal
President, Engineering and a Qualified Person under National Size M
Instrument 43-101. Mr Jones has verified the methods used to Tonnes Au Cu (B Au (M Cu (B
determine grade and tonnage in the geological model, reviewed the Au (g/t) Cu (%)
(M oz) lb) oz) lb)
long range mine plan, and directed the updated economic
evaluation. The estimates for the reserves used long term metal P&P reserves 830 0.41 0.23 7.7 3.6 11.0 4.2
prices of US$1.65/lb for copper and US$650/oz for gold and a
foreign exchange of C$0.82 per US dollar. M&I Resources 181 0.40 0.30 - - 2.3 1.1
Gibraltar Total 1,011 0.41 0.24 - - 13.3 5.3
The resource and reserve estimation was completed by Gibraltar
mine staff under the supervision of Scott Jones, P.Eng., Vice
President, Engineering and a Qualified Person under National Size
Grade Recoverable Metal Contained Metal
Instrument 43-101. Mr. Jones has verified the methods used to (M Tons)
Category (at 0.20%
determine grade and tonnage in the geological model, reviewed the
Cu Cut-off) Cu (%) Mo (%) Cu (B lbs) Cu (B lbs)
long range mine plan, and directed the updated economic
evaluation. The estimates used long term metal prices of US$2.75/lb
P&P Reserves 722 0.26 0.008 3.2 3.7
for copper and US$11.00/lb for molybdenum and 0.85 C$/US$
foreign exchange. Mr. Jones has reviewed this release. A technical
M&I Resources 1066 0.25 0.008 - 5.3
report will be filed on www.sedar.com. Reserves and Resources
were updated as of Dec 31/15.
Aley
The reserve estimation was reviewed by Scott Jones, P.Eng., Vice-
President Engineering for Taseko and a Qualified Person under Size Contained Metal
Grade
National Instrument 43-101. Mr Jones has verified the methods used (M Tonnes)
to determine grade and tonnage in the geological model, reviewed Category Nb205 (%) Nb (M kgs)
the long range mine plan, and directed the updated economic
evaluation. The study was done using long term metal prices of P&P Reserves (@ 0.30% Nb2O5 cut-off) 84 0.50 293
US$45.00/kg for niobium and an exchange rate of US$0.90/C$1.00.
The NI 43-101 compliant reserve estimate takes into consideration M&I Resources (@ 0.20 Nb2O5 cut-off) 286 0.37 739
all geologic, mining, milling, and economic factors, and is stated
according to Canadian standards (NI43-101). (Under US standards
no reserve declaration is possible until a full feasibility study is
completed and financing and permits are acquired.)
Florence All Oxide in Bedrock
QP for the 2011 resource estimate is Russell White, RM-SME, RG.
QP for the 2013 reserve estimate is Michael Young, RM-SME, Haley Class Millions tons %TCu Grade Billion lb Copper
& Aldrich Based on 577,317 feet of drilling in 502 holes. Mineral Reserves Probable 340 0.36 2.44
Reserves and Mineral Resources at a 0.05% TCu cutoff. Mineral
reserves are contained within the measured and indicated mineral Resources Measured 296 0.35 2.10
resources. Mineral resources that are not mineral reserves do not
have demonstrated economic viability (Under US standards no Indicated 133 0.28 0.74
reserve declaration is possible until a full feasibility study is
completed and financing and permits are acquired.) M+I 429 0.33 2.84
Note: Technical reports Inferred 63 0.24 0.30 25
25
have been filed on www.sedar.com.You can also read