QOS-AWARE MULTILAYER UAV DEPLOYMENT TO PROVIDE VOWIFI SERVICE OVER 5G NETWORKS
←
→
Page content transcription
If your browser does not render page correctly, please read the page content below
Hindawi
Wireless Communications and Mobile Computing
Volume 2022, Article ID 3110572, 13 pages
https://doi.org/10.1155/2022/3110572
Research Article
QoS-Aware Multilayer UAV Deployment to Provide VoWiFi
Service over 5G Networks
Vicente Mayor , Rafael Estepa , and Antonio Estepa
Department of Telematics Engineering, Escuela Superior de Ingenieros, Universidad de Sevilla, C/Camino de los Descubrimientos s/
n, 41092 Sevilla, Spain
Correspondence should be addressed to Vicente Mayor; vmayor@us.es
Received 15 October 2021; Revised 20 December 2021; Accepted 3 January 2022; Published 28 January 2022
Academic Editor: Nagendra Kumar
Copyright © 2022 Vicente Mayor et al. This is an open access article distributed under the Creative Commons Attribution License,
which permits unrestricted use, distribution, and reproduction in any medium, provided the original work is properly cited.
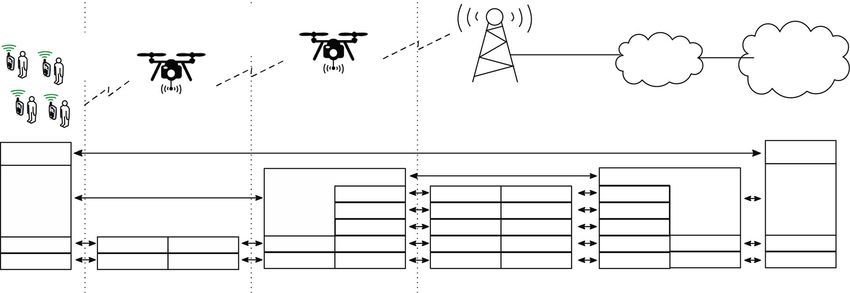
Drones equipped with wireless network cards can provide communication services in open areas. This paper proposes a
hierarchical two-layered network architecture with two types of drones according to their communication equipment: Access
and Distribution. While access drones provide WiFi access to ground users, distribution drones act as WiFi-to-5G relay
forwarding packets into the 5G Core Network. In this context, we formulate a novel optimization problem for the 3-D initial
placement of drones to provide Voice over WiFi (VoWiFi) service to ground users. Our optimization problem finds the
minimum number of drones (and their type and location) to be deployed constrained to coverage and minimum voice speech
quality. We have used a well-known metaheuristic algorithm (Particle Swarm Optimization) to solve our problem, examining
the results obtained for different terrain sizes (from 25m × 25m to 100m × 100m) and ground users (from 10 to 100). In the
most demanding case, we were able to provide VoWiFi service with four distribution drones and five access drones. Our
results show that the overall number of UAVs deployed grows with the terrain size (i.e., with users’ sparsity) and the number
of ground users.
1. Introduction for the access network). Clearly, ground users’ devices must
share the radio technology in the access network, which
Unmanned Aerial Vehicles (UAVs), also known as drones, could be a problem in practice often overlooked (e.g., scar-
have been widely studied in the literature for the last decade city of 5G users or the involvement of a telco operator).
partly due to their versatility, which lets UAVs be used in For this reason, some works have also suggested the use of
different domains [1]. The application considered in this WiFi [10–12] for the UAV-to-ground access network due
paper is the UAV-assisted deployment of wireless communi- to its low complexity, ubiquity (e.g., smartphones, tablets
cation services in open areas [2, 3]. UAVs equipped with and some IoT devices), and independence from operators.
communication electronics have been proposed in the past UAV-enabled WiFi deployments bring new opportunities
as mobile base stations or access points to enhance wireless when creating provisional communications infrastructure
coverage, improve capacity or reliability in existing infra- in SAR (Search and Rescue) missions, which is actively
structure, or even replace damaged infrastructure in emer- investigated in scientific literature nowadays [12, 13]. How-
gency situations [4, 5]. ever, designing a WiFi access network requires dealing with
Provisioning a communication service to ground users signal coverage and Quality of Service (QoS) issues at the
typically requires the deployment of a UAV-to-ground IEEE 802.11 MAC sublayer. This challenge is translated to
access network and, if not in place, a UAV-to-UAV and/or the problems addressed in the literature, such as 3-D place-
UAV-to-infrastructure network or backhaul [6]. Most ment, trajectory planning, energy efficiency, coverage, or
research papers tend to focus on only one of these networks backhaul connectivity [6, 14].
and its associated communication technology (e.g., WiMAX In this paper, we propose using UAVs to form a two-
[7], cellular 3/4G [8], or 5G [9] for the backhaul and cellular level hierarchical network that relays between IEEE 802.11
2                                                                         Wireless Communications and Mobile Computing

(WiFi) and cellular 5G for providing VoIP over WiFi                Backbone            5G Core Network
(VoWiFi) service to ground users (see Figure 1). Access net-       Network
work drones implement WiFi, while distribution/backhaul           Distribution              5G
drones implement a gateway between WiFi and 5G. This               Network
                                                                  (D-UAVs)              WiFi (5 GHz)
combination of technologies leverages the high bandwidth
of 5G (up to 1 Gbps) to aggregate VoIP traffic flows in a              Access
low number of 5G radio links, reducing the number of               Network
                                                                  (A-UAVs)
                                                                                     WiFi (2.4 GHz)
mobile subscriptions and costs in 5G equipment. In this sce-
nario, we address the problem of the initial 3-D placement of
the UAVs in both networks. As Masroor et al. put it [4], “the
placement of UAVs is an important parameter of resource
management as this can affect the transmit power, coverage,
and the QoS of the system.” More specifically, we propose a
new optimization problem that considers constraints about
signal coverage and QoS and finds the minimum number
of drones that need to be deployed, their position, and type                     Figure 1: Proposed scenario.
(i.e., access network—A-UAV—or distribution-net-
work—D-UAV). This work extends our previous research
[15, 16], where we studied the deployment of drones to form     2. Related Works
a WiFi access network for VoIP services. Now, we integrate
the access network into a 5G Core Network using a second        The optimal placement of UAVs has been identified as an
layer of drones that hove at a higher altitude and aggregate    open challenge in the context of communication services
the VoIP traffic flows. Note that in this scenario, the quality    that use drones as base stations (BS) or relaying nodes in
of service depends not only on the congestion level of the      2D, 3D, single-, and multi-UAV environments [5]. Table 1
access network but also on the distribution network and         summarizes the state of the art in UAV optimal location
5G operator backbone SLAs (Service Level Agreement). As         optimization problems for wireless coverage provisioning
such, UAVs’ optimal position may depend on users’ loca-         and clarifies how our work is different from related works.
tion, VoIP capacity, and backbone link capacity.                Works in Table 1 are classified in terms of (a) their objective
     The main contributions of this paper are as follows:       function, (b) optimization variables (e.g., initial placement,
                                                                trajectory, or resource allocation), and (c) any other con-
     (i) We mathematically formulate a new problem for          straints or considerations that might restrict its usage to a
         the optimal deployment of UAVs that includes           concrete scenario.
         coverage and QoS constraints in the access (WiFi),         Optimal UAV placement for wireless coverage counts
         distribution (WiFi), and backbone (5G) networks.       with a good deal of optimization problems in the literature.
                                                                For example, Li et al. [17] propose to maximize throughput
    (ii) We propose a novel network reference architecture
                                                                via power allocation and 3D placement for indoor communi-
         for the proposed scenario that provides seamless
                                                                cations. Maximizing the throughput has also been addressed
         Voice over WiFi (VoWiFi) access to the 5G Core
                                                                in [18], where the authors suggest a 3D UAV placement and
         Network.
                                                                power allocation optimization problem based on software-
    (iii) We provide an analytical model to estimate the        defined cellular networks, or in [19] that also employs
          speech quality in our multilayered scenario. Our      software-defined cellular networks but using rate instead of
          models assume realistic traffic conditions such as      power allocation. Similarly, Yin et al. [20] suggest deploying
          heterogeneous and nonsaturated stations.              a cellular network (FDMA) by maximizing the downlink rate
                                                                under three optimization variables: user association, resource
    (iv) We use a metaheuristic search method (i.e., Particle   allocation, and UAV placement. Other authors [21] suggest
         Swarm Optimization) to solve the previous optimi-      combining UAV placement with user association in order to
         zation problem.                                        minimize the maximum traffic demand at UAVs, achieving
    The remainder of the paper is as follows. Section 2         a fair traffic distribution among them; or the deployment of
presents a state-of-the-art analysis of UAV optimization        NOMA (Nonorthogonal Multiple Access) networks to miti-
problems for communications services. Then, Section 3           gate the path loss (i.e., maximize received signal strength) or
elaborates on the proposed network architecture and the         energy consumption due to transmit power [22, 23], respec-
voice quality assessment method. The proposed optimiza-         tively. Finally, in [24, 25], the authors propose to minimize
tion problem is defined in Section 4, and Section 5 pre-         the number of deployed UAVs while finding the positioning
sents a solution search method based on a well-known            that maximizes the coverage area while forming a robust back-
meta-heuristics algorithm (Particle Swarm Optimization).        bone network.
Then, we examine the solutions obtained for different sce-           Besides optimal initial positioning, trajectory optimiza-
narios in Section 6 and analyze the performance. Finally,       tion (i.e., a series of discrete points of a flying path that
Section 7 summarizes the paper by providing conclusions         drones follow in a continuous movement while providing
and future work.                                                wireless network coverage [4]) has also been widely
Wireless Communications and Mobile Computing                                                                                   3

                                              Table 1: Related work comparison.

                                                                                    Network
Ref.          Objective function                  Variables                                             Considerations
                                                                                  technologies
                                                               Resource                                      Speech
                                     Placement   Trajectory                  Access     Backbone SINR BW                 Energy
                                                               allocation                                    quality
[17]          max. throughput          ✓             ✗             ✗        FDMA         FDMA       ✓   ✗       ✗          ✗
[18]          max. throughput          ✓             ✗             ✓        Cellular     Cellular   ✓   ✗       ✗          ✓
[19]          max. throughput          ✓             ✗             ✓        Cellular     Cellular   ✓   ✓       ✗          ✗
[20]        max. downlink rate         ✓             ✗             ✓        Cellular     Cellular   ✓   ✗       ✗          ✗
           min. maximum traffic
[21]                                   ✓             ✗             ✓        Cellular     Cellular   ✓   ✗       ✗          ✗
                  demand
[22]           min. path loss          ✓             ✗             ✓        NOMA         Cellular   ✓   ✗       ✗          ✓
          min. transmit power or
[23]                                   ✓             ✗             ✓        NOMA         Cellular   ✓   ✗       ✗          ✓
                 max. rate
           min. UAVs and max.
[24]                                   ✓             ✓             ✓        Cellular     Cellular   ✓   ✓       ✗          ✗
                 coverage
           min. UAVs and max.
[25]                                   ✓             ✓             ✓        Cellular     Cellular   ✓   ✓       ✗          ✗
                 coverage
[26]       max. energy efficiency        ✗             ✓             ✗        mmWave Cellular         ✓   ✗       ✗          ✓
[27]       min. power allocation       ✗             ✓             ✓        OFDMA OFDMA             ✓   ✗       ✗          ✓
[28]     min. energy consumption       ✗             ✓             ✓        Cellular Cellular       ✓   ✗       ✗          ✓
         max. spectrum and energy
[29]                                   ✗             ✓             ✓         TDD           TDD      ✗   ✗       ✗          ✓
                     eff.
         max. spectrum and energy
[30]                                   ✗             ✓             ✓         TDD           TDD      ✗   ✗       ✗          ✓
                     eff.
[31]     max. minimum throughput       ✗             ✓             ✓        Cellular     Cellular   ✗   ✓       ✗          ✗
[32]      max. minimum user rate       ✗             ✓             ✓        OFDMA        OFDMA      ✓   ✗       ✗          ✗
[33]      max. minimum user rate       ✗             ✓             ✓        TDMA         TDMA       ✓   ✗       ✗          ✓
              max. end-to-end
[34]                                   ✗             ✓             ✓        Cellular     Cellular   ✓   ✗       ✗          ✓
                throughput
              max. end-to-end
[35]                                   ✗             ✓             ✓        Cellular     Cellular   ✓   ✗       ✗          ✓
                throughput
[36]      min. outage probability      ✗             ✓             ✓        Cellular     Cellular   ✓   ✗       ✗          ✓
         min. UAVs and user radio ✓ (single-
[15]                                                 ✗             ✓         WiFi          N/A      ✓   ✓      ✓           ✓
                   energy           layer)
          min. UAVs and UAVs’      ✓ (single-
[16]                                                 ✗             ✓         WiFi          N/A      ✓   ✓      ✓           ✓
                   energy           layer)
This       min. UAVs and user          ✓
                                                     ✗             ✓         WiFi           5G      ✓   ✓      ✓           ✗
paper            coverage         (multilayer)

addressed, mainly focusing on energy efficiency. Chakareski        networks. Finally, [36] proposed to minimize the probabil-
et al. [26] proposed an energy-efficient framework for             ity of outage through a joint power allocation and trajec-
deploying mmWave 5G cellular networks, in [27, 28], the          tory optimization problem.
authors proposed a joint optimization problem for trajectory         Few works have addressed the provision of VoIP service
and power allocation, and finally, [29, 30] present a joint       with drones. To the best of our knowledge, only our previous
spectrum and energy efficiency optimization problem.               work [15, 16] has done it considering a single-layer of
Through put maximization optimization via trajectory has         drones to set up a WiFi access network. In both papers, radio
also been proposed in several works. Hu et al. [31] proposed     coverage and speech quality constrained the 3D multi-UAV
a resource and trajectory optimization problem by introduc-      placement optimization problem, seeking the minimum
ing user scheduling and bandwidth allocation; and [32, 33]       deployment costs (i.e., number of UAVs deployed). Between
proposed to combine trajectory with radio resource alloca-       solutions with the same number of drones, we chose the one
tion in vehicular and UAV-enabled relaying systems.              that minimized users’ radio energy or UAVs energy, respec-
Finally, other works such as [34, 35] proposed to maxi-          tively. However, both works addressed only the WiFi access
mize the end-to-end rate by considering trajectory power         network, leaving the distribution and backbone networks for
allocation optimization while deploying multi-hop relay          future research. This paper takes a step further by
4                                                                                                             Wireless Communications and Mobile Computing

considering a two-layered hierarchical network that per-                                                     2.4 GHz band associated to the Access Point
forms access, distribution, and connection to the backbone                                                   installed at A-UAVs.
using two different radio technologies: WiFi and 5G.
Regarding the objective function, we propose to find the                                               (ii) A-UAVs play a double role: (a) for users, they act as
minimum number of deployed UAVs (independently of                                                          access points (at the 2.4 GHz band), and (b) they are
their type) needed to maximize user coverage. In light of                                                  associated with the distribution (second) layer of
Table 1, we can state that our work differs from those found                                                drones through another WiFi connection at 5 GHz.
in the literature in three main aspects: (a) a multilayered                                          (iii) D-UAVs behave as WiFi APs for associated A-
UAV placement that performs traffic aggregation, (b) more                                                    UAVs, and they also provide a backbone link to
realistic constraints for real-time voice speech quality by                                                the 5G network. As such, D-UAVs are seen as 5G
modelling the MAC sublayer of the access network, and (c)                                                  User Equipment (UE) maintaining a connection to
the deployment of a WiFi access network instead of a                                                       the 5G Core Network (i.e., GTP-U tunnels).
cellular-based one, hence minimizing any compatibility
issues regarding user smartphones.                                                                In the previous architecture, the speech quality experi-
                                                                                              enced by users is impaired on each subnetwork due to the
3. Proposed Scenario and QoS Assessment                                                       medium access control mechanism and network congestion.
                                                                                              The following section elaborates on the proposed QoS
As shown in Figure 1, our scenario consists of a two-level                                    assessment method considered in this paper (E-Model).
hierarchical network that relays between IEEE 802.11 (WiFi)
networks (i.e., for access and distribution) and cellular 5G
backhaul links. The QoS experienced by users will be influ-                                    3.2. Voice Quality Assessment. Voice quality assessment has
enced by packet loss and delay in these networks. This                                        been studied during the last decades [37]. Some of the
section is devoted to defining the network architecture and                                    approaches suggested in the literature to measure or esti-
the analytical model used to estimate the speech quality                                      mate speech quality, such as P.863 or P.563, require inva-
experienced by users in our scenario.                                                         sive monitoring (e.g., sampling the original voice signal).
                                                                                              On the contrary, the E-model [38] is an analytical model
3.1. Network Architecture. Figure 2 illustrates the proposed                                  that allows one to estimate the speech quality assuming
network architecture. The network entities (from left to                                      additive impairments to the quality. The E-model pro-
right) are as follows:                                                                        vides a quality score, namely, the R factor, that ranges
                                                                                              from 0 (poor) to 100 (excellent) that is calculated as
     (i) Ground users are equipped with WiFi-compliant                                        follows [15, 39, 40]:
         terminals (e.g., smartphones) operating at the

                                                                   Ppl
                    R = R0 − I e + ð95 − I e Þ                                       − ð0:024d + 0:11 · ðd − 177:3Þ · H ðd − 177:3ÞÞ :                                  ð1Þ
                                                         Ppl /BurstR + Bpl
                                                                                         |fflfflfflfflfflfflfflfflfflfflfflfflfflfflfflfflfflfflfflfflfflfflfflfflfflfflfflfflfflfflfflfflfflfflfflfflffl{zfflfflfflfflfflfflfflfflfflfflfflfflfflfflfflfflfflfflfflfflfflfflfflfflfflfflfflfflfflfflfflfflfflfflfflfflffl}
                              |fflfflfflfflfflfflfflfflfflfflfflfflfflfflfflfflfflfflfflfflfflfflfflfflfflffl{zfflfflfflfflfflfflfflfflfflfflfflfflfflfflfflfflfflfflfflfflfflfflfflfflfflffl}                                         Id
                                                       I e,eff

     In the previous equation, two impairments (I e,eff and I d )                                 The latest impairment, I d , is associated with the delay
are subtracted from the maximum achievable quality (R0 ),                                     in the communication chain. A widely accepted approxi-
which is a representation of the Signal-to-Noise Ratio.                                       mation for I d can be obtained from one-way delay in
     I e,eff represents a combination between impairment                                      the communication path d, where H is the Heaviside
equipment parameter at zero packet loss (I e ) and a function                                 function (HðxÞ = 0 for x < 0 and HðxÞ = 1 for x > 0. In
that depends on I e , the packet loss rate, and packet loss                                   our case, x = d − 177:3. The one-way delay d (in millisec-
behavior. I e is a codec-dependent constant associated with                                   onds) includes all additive delays from source to destina-
codec compression degradation (a list of values from ITU-                                     tion, which depend on the network topology and the
T codecs were presented in ITU-T Rec. G.113 Appendix I),                                      chosen codec (i.e., packetization delay).
Bpl represents the codec packet loss robustness, which also                                       In order to solve Equation (1), one has to model both
has a specific value for each codec (listed in ITU-T Rec.                                      network performance parameters (i.e., network delay d and
G117 Appendix I), Ppl represents the packet loss rate (in                                     the packet loss rate Ppl ). Since our scenario consists of WiFi
%) in the WiFi channel, and finally, BurstR characterizes                                      access and distribution networks and a backhaul 5G link, the
the burst ratio (i.e., equals 1 if the packet loss is random                                  overall delay and packet loss ratio should be
and greater otherwise). In this paper, we use the G.711 codec
(I e = 0 and Bpl = 25:1) and assume random losses (i.e.,
                                                                                                              Ppl = 1 −            1 − Ppl,a 1 − Ppl,d 1 − Ppl,b ,        ð2Þ
BurstR = 1).
Wireless Communications and Mobile Computing 5
VoWiFi Access-layer Distribution-layer
terminals UAV IEEE UAV
802.11ac 5G
IEEE (5 GHz)
802.11n 5G Core Data
(2.4 GHz) Network Network
VoIP VoIP
PDU PDU PDU PDU
SDAP SDAP GTP-U GTP-U Layer Layer
Layer Layer
(IP, UDP...) (IP, UDP...) PDCP PDCP UDP UDP (IP, UDP...) (IP, UDP...)
RLC RLC IP IP
802.11 MAC 802.11 MAC 802.11 MAC 802.11 MAC 5G MAC 5G MAC L2 L2 802.11 MAC 802.11 MAC
802.11 PHY 802.11 PHY 802.11 PHY 802.11PHY 5GPHY 5GPHY L1 L1 802.11 PHY 802.11 PHY
802.11 802.11 Bridge 802.11 5G-UE 5G-AN 5G-UPF DN
+
STA AP
Figure 2: Network reference architecture.
!
(b) Cð a j Þ represents the set of users associated with
d = dp + da + dd + db , ð3Þ the j-th A-UAV.
!
(c) C = ∑Ai=1 jCð a i Þj represents the number of users
where (a), (d), and (b) subscripts refer to impairments at covered by the system (and hence associated to
the access, distribution (i.e., influenced by IEEE 802.11 phys- any A-UAV).
ical and MAC sublayer), and backhaul link, respectively.
Finally dp accounts for the packetization delay, which could ! !
(ii) The speech quality function, Rðd i , a j Þ, provides the
be assumed as a constant (e.g., 20 ms for G.711 codec).
speech quality experience by users associated with
The previous performance metrics can be estimated for
the j-th A-UAV (see Equation (3)) which in turn
the IEEE 802.11 network through well-known analytical is associated with the i-th D-UAV. This function
models (see [15, 16]) that enable the prediction of the packet takes into account the level of congestion in the
loss ratio and delay in the WiFi network just by defining the access and distribution networks
number of stations, traffic models (i.e., packet size and fre-
!
quency), and stations’ received signal strength. On the other (iii) The uplink throughput function, Sðd i Þ, provides the
hand, 5G links performance can be assumed to be included aggregated throughput (in Mb/s) handled by the i
in the Service Level Agreement with the telco provider -th D-UAV. Clearly, it cannot exceed the maximum
[41], so one can easily obtain Ppl,b and d b . throughput achievable by the 5G link (Smax ).
4.2. Assumptions. For the sake of tractability, the following
4. Problem Definition assumptions are made:
In this section, we state the terminology, main assumptions,
(i) Ground users are confined in a flat outdoor terrain
and a formal definition of the problem of optimal placement
with known dimensions. Their position is also
under the scenario illustrated in Figures 1 and 2.
known (this could be implemented through users’
smartphone’s GPS or image processing).
4.1. Terminology. Table 2 summarizes the notation used in
this paper. We use three sets to represent distribution drones (ii) Users’ calls go through a compatible VoIP applica-
(D), access drones (A), and ground users (U). The location tion that uses a known audio codec.
of each element in these sets is represented in Cartesian’s
! ! (iii) APs’ channelization is arranged in such a manner
!
coordinates: d , a , and u , respectively. that the interference between adjacent radio chan-
Let us introduce some functions that will be recurrently nels is negligible. By using directional antennas,
used in this paper: one could simply adjust the radio beam pattern to
minimize inter-UAV interference.
!
(i) The coverage function, Cð x Þ, represents the set of
(iv) Ground users could potentially be simultaneously
stations associated with a specific UAV-mounted
! on a call. Thus, each A-UAV will not have more
AP identified by its location, e.g. x . For example: users associated than its VoIP Capacity [42]
! (maximum number of simultaneous calls under
(a) Cðd i Þ represents the set of A-UAVs associated a guaranteed QoS). Then, VoIP Capacity is a
with the i-th D-UAV. harder constraint than coverage and will play a6 Wireless Communications and Mobile Computing
Table 2: System terminology summary.
Symbol Example Description
! ! !
D d 1 , d 2 , ⋯, d D Set of D-UAVs’ locations
D ∣D ∣ Number of deployed D-UAVs
!
di fx i , y i , z i g Cartesian coordinates of the i-th D-UAV
n! ! !
o
A a 1 , a 2 , ⋯, a A Set of A-UAVs’ locations
A ∣A ∣ Number of deployed A-UAVs
n o
!
aj x j, y j, z j Cartesian coordinates of the j-th A-UAV
n! ! !
o
U u 1 , u 2 , ⋯, u U Set of ground users’ locations
U ∣U ∣ Number of ground users
!
uk fx k , y k , z k g Cartesian coordinates of the k-th user
!
decisive role in determining the number of A- ðd i Þ, must be greater than a threshold (Rmin ).
UAVs deployed.
! !
4.3. Optimization Problem. The formal definition of our (iii) D-UAVs uplink throughput, Sðd i Þ∀d i ∈ D, must be
optimization problem is stated in lower than 5G links capacity (Smax ).
Observe that the analytical expression in Equation (4) is
C composed of two terms: (D + A) which is an integer (always
min ðD + A Þ + 1 − ≥2 since we need to deploy at least one drone of each kind)
D ,A U
and (1 − C/U) which represent the rate of uncovered users.
C The latter is a real number always less than 1 (e.g., a coverage
subject to ≥ C min
U of 80% would provide 0.2) and, as such, is subordinated to
the first (which is an integer). So minimizing the number
! ! ! ! !
R d i , a j ≥ Rmin , ∀d i ∈ D, a j ∈ C d i , of drones in the solution always takes precedence over
coverage (which is already a problem constraint). Thus, the
! ! second term is only used to break the deadlock between var-
S d i ≤ Smax , ∀d i ∈ D,
ious solutions with the same number of drones (the one with
! !
greater coverage is preferred).
d i ∈ X D, ∀d i ∈ D,
! ! 5. Problem Resolution
a i ∈ X A, ∀ a i ∈ A,
D ≤ Dmax , The optimization problem in (4) can be solved through
metaheuristics search algorithms. In our previous work
A ≤ Amax , [15, 16], we demonstrated the effectiveness of Genetic Algo-
ð4Þ rithm and Particle Swarm Optimization, comparing their
results with exhaustive search. For simplicity’s sake, and
given our previous experience, we will use a PSO algorithm
where X D and X A stand for the collection of valid posi- (further proposed by other authors [43]) in this paper.
tions for distribution and access UAVs, respectively; so one
could restrict flying zones or establish a range of valid 5.1. Search Algorithm. Algorithm 1 contains the pseudocode
altitudes for each type of UAV. of the search algorithm used to solve the optimization prob-
The previous expression optimizes the location of Distri- lem in (4). The input of the algorithm is the set of valid posi-
bution and Access UAVs (D, A, respectively) that mini- tions for UAVs (X), the set of ground users’ location (U),
mizes the total number of UAVs deployed (D + A) while and the problem constraints (Dmax , Cmin , Rmin , Smax ). This
maximizing user coverage (C/U) subject to the following algorithm looks for the optimal location of UAVs (D, A)
constraints: that meets the problem constraint and increases the number
of drones (A, and D) until a valid solution is found. For a
(i) User coverage ratio, C/U, must exceed a threshold given number of drones (D ≤ A), their positioning is jointly
(C min ). optimized by the SolveOptim_PSO function.
! ! ! On each iteration, the SolveOptim_PSO (see Algo-
!
(ii) Offered speech quality, Rðd i , a j Þ∀d i ∈ D, a j ∈ C rithm 2) is called to find the optimal location (D∗ , A ∗ ) forWireless Communications and Mobile Computing 7
(ii) The UpdateParticle function updates the set of par-
Input: X, U, Dmax , Cmin , Rmin , Smax ticles (P ) by considering the best-found location for
Output: D, A each particle (P ∗ )
Initialization: A = 0, D = 0
while A = A + 1 and A ≤ Amax do (iii) The Check function contains the fitness evaluation
D = 0; that returns a score for a given location. Then, the
while D = D + 1 and D ≤ A ≤ Dmax do algorithm evaluates if the candidate position is valid
D, A = SolveOptim_PSO ðU, D, AÞ (f i > 0), and if it improves the best-found location
if D ≠ ∅ and A ≠ ∅ then for that particle (f i < f ∗i ). If so, the best-found loca-
return D, A
tion for that particle is updated
end
end (iv) The algorithm finishes when the exit criterion is
end achieved (e.g., the overall improvement between
return ∅ two consecutive generations is lower than 10−3 ). It
returns the location for Distribution and Access
Algorithm 1: Search algorithm pseudocode. UAVs (D∗ and A ∗ ) if any, or an empty set
otherwise
The next section elaborates on the fitness evaluation
procedure (Check function); the reader can find rest of the
(SolveOptim_PSO)
Input: X, U, D, A, C min , Rmin , Smax PSO-related functions in our previous work [16], along with
Output: D∗ , A ∗ some implementation details.
Initialization: D∗ = ∅, A ∗ = ∅
P = CreateParticles ðX, D, AÞ
5.2. Fitness Evaluation (Check Function). For every candi-
P∗ = P date solution (i.e., D, A), a fitness score has to be calculated
while !(exit criteria met) do based on the optimization problem. Let us define the score
for particle i = 1 to ∣P ∣ do of a particle (i.e., candidate solution) as f :
P i = UpdateParticle ðX, P i , P ∗i Þ;
½Di , A i = P i ; 8
> C
/∗ Evaluate the i-th particle ∗/ >
< ðD + AÞ + 1 − U , if constraints are satisfied,
f i = Check (U, Di , A i ) f=
if (f i > 0 and f i < f ∗i ) then >
> C
: − , otherwise,
/∗ Update if better ∗/
U
P ∗i = P i ;
f ∗i = f i ; ð5Þ
if f i < min ð f Þ then
/∗ Update if best ∗/ where constraints refers to coverage, quality of service, and
½D∗ , A ∗ = P i
throughput evaluation.
end
end 5.2.1. Coverage Evaluation. Checks if the total number of
end covered users (C) is greater than the threshold (Cmin ). It uses
end !
return D∗ , A ∗ the coverage function, Cð x i Þ, that returns a set of locations
!
of associated Stations for an Access Point located at x i
(i.e., in Cartesian coordinates).
Algorithm 2: Particle Swarm Optimization function
This function can be applied to any AP in the system
(i.e., both D-UAVs and A-UAVs). For example, (6) repre-
!
the specified number of UAVs (i.e., D and A input parame- sents the coverage function for the i-th D-UAV (d i ), but it
ters), returning an empty set if the problem constraints cannot ! !
can be adapted for any A-UAV just by replacing d and a
be met. During execution, candidate locations (i.e., particles) ! !
are randomly created (CreateParticles), evolved (UpdateParti- with a and u , respectively.
cle), and evaluated (Check) following a common Particle
8 9
Swarm Optimization approach: > ! !
>
>
> RSSI d , α ≥ RSSI >
>
>
>
i k min >
>
> >
>
(i) The CreateParticles function returns a set of parti- > >
< >
=
! ! !
cles randomly generated, P , by considering the !
C d i = α k ∈ A SINR d i , α k ≥ SINRmin
collection of valid positions (X) and the number >
> >
>
>
> >
>
of Distribution and Access UAVs, D and A, respec- >
> >
>
> ! ! ! ! ! >
> RSSI d i , α k > RSSI d i , α j ∀α k ≠ α j >
!
tively. Each element in P represents a candidate set : ;
of locations for all UAVs, so they can be decom-
posed into the D and A sets ð6Þ8 Wireless Communications and Mobile Computing
The previous expression returns the subset of stations Table 3: Input parameters.
that (a) are compliant with RSSI and SINR minimum
thresholds and (b) have the greatest signal intensity. Then, Parameter Value
RSSI and SINR can be calculated as follows. Users 60
Size 100m × 100m
(i) The Received Signal Strength Indicator (RSSI) VoIP codec G.711 (20 ms interval)
depends on the distance and angle between the trans-
D-UAVs’ WiFi 802.11ac at 5 GHz (80 MHz)
mitter and the receptor. Equation (7) represents the
RSSI calculus (in dBm). In this expression, an initial A-UAVs’ WiFi 802.11n at 2.4 GHz (20 MHz)
transmission power is considered (Ptx ), further add- D-UAVs’ altitude ½10, 35 m
ing power gains (G) and subtracting any losses (L). A-UAVs’ altitude ½40, 55 m
RSSImin −82 dBm
! ! ! ! SNRmin 20 dB
RSSI x , y = Ptx + G θx,y − L ∥ x − y ∥,θx,y , ð7Þ
Rmin 65
Cmin 90%
GðθÞ = 10 log10 10Gmax /20 · cos2 θ , ð8Þ
L5G−SLA 1%
Lðd, θÞ = PLoS ðθÞLLoS ðdÞ + PNLoS ðθÞLNLoS ðd Þ, ð9Þ d5G−SLA 5 ms
where 8 represent a simple gain pattern of an antenna Smax 1 Gb/s
(limited by Gmax ) and L represents a path loss expression
widely proposed in air-to-ground channel models [44–46].
It considers that ground users receive three different groups strength. Let Z be the collection of APs operating
of signals: (a) Line-of-Sight (LoS), (b) Non-Line-of-Sight at an overlapping channel (channel planning is out
(NLoS), and (c) other reflected components which cause of the scope of this paper). Then, SINR can be
multipath fading. Each group has its own probability of expressed as
occurrence depending on the environment, density, height,
and elevation angle. According to [47], the probability of
Prx
fading is significantly lower than the probability of receiving SINR = , ð14Þ
the LoS (PLoS ) and NLoS (PNLoS ) components, so we will N + ∑k∈Z I k
neglect it for simplicity. LLoS and LNLoS represent the average
path loss for LoS and NLoS components, respectively, and where Prx represents the received signal power, N
can be expressed as [44] accounts for the noise, and each I k ∀k ∈ Z stands for the
received interference from any overlapping transmissions.
Since we assume that the sources of interference are negligi-
4πf c d
LLoS ðdÞ = 20 log10 + ξLoS , ð10Þ ble due to a correct channel planning, SINR can be reduced
c
to SNR and it can be calculated as
4πf c d ! ! ! !
LNLoS ðd Þ = 20 log10 + ξNLoS , ð11Þ SINR dB x , y = RSSI x , y − F − N , ð15Þ
c dB
where the first term accounts for the free space propaga- N jdB = −174 + 10 log10 ðCBW Þ, ð16Þ
tion loss ξLoS and ξNLoS represent any additional losses due
to the environment (a list of values can be found in [45]) where N is the noise, F accounts for the receiver’s noise
and f c is the channel frequency. figure, and C BW stands for the signal bandwidth, which
Finally, the probability of receiving each component is depends on the IEEE 802.11 standard revision under
given by [48] consideration.
1 5.2.2. Speech Quality and Throughput Evaluation. The goal
PLoS ðθÞ = , ð12Þ of this evaluation is to guarantee that (a) the speech quality,
1 + αe−βθ·180/π+βα ! !
given by the QoS function Rðd i , a j Þ for every D-UAV–A-
PNLoS ðθÞ = 1 − PLoS ðθÞ, ð13Þ UAV association in the system, is over a minimum threshold
(Rmin ) and (b) that the aggregated throughput at D-UAVs
where α and β are environment-dependent constants
do not exceed the maximum capacity of 5G links (Smax ).
(e.g., rural and urban) as defined in [45] (e.g., α = β = 0 for
Both constraints can be formally represented as (17) and
no buildings).
(18), respectively.
(i) The Signal-to-Interference-plus-Noise-Ratio (SINR)
! ! ! ! !
can be calculated by subtracting every noise and R d i, a j ≥ Rmin , ∀d i ∈ D,∀ a j ∈ C d i , ð17Þ
cochannel interference from the received signalWireless Communications and Mobile Computing 9
50
40
30
z (m)
20
10
100
0
100 50
80
60
40
20
0 0 x (m)
y (m)
D-UAV Associated users
A-UAV Non covered users
Figure 3: Example solution.
0 ! 1
! ! Q
! !
1 − FERð u Þ τð u Þ
i
S d i ≤ Smax , ∀d i ∈ D: ð18Þ ! ! 1 − τ
! B i ≠u ∈S C
SWiFi a = 〠 B @
C · LPDU ,
A
! ! E½T
u ∈C ð a Þ
To verify these constraints, one has to estimate end-to-
end performance parameters such as packet loss ratio, delay, ð21Þ
and effective throughput. Then, as introduced in Section 3.2, !
the end-to-end speech quality (e.g., see R factor in (1)) can where FERð a Þ stands for the average Frame Error Rate at
be estimated through the E-model. This requires to know the access point, which can be derived from its SINR and
the end-to-end packet loss ratio (Ppl ) and delay (d). More- Modulation and Coding Scheme (MCS); E½B is the expected
over, Ppl and d can be further decomposed (see Equations number of back-off slots that a packet waits before transmis-
sion; and E½T is the average slot duration and it can be cal-
(2) and (3)) considering the three networks traversed in
culated by averaging the duration of each type of event (e.g.,
the proposed network architecture: (a) the WiFi access net-
transmission, collision) with its probability. The reader is
work, (b) the WiFi distribution network, and (c) the 5G link
encouraged to read a more detailed derivation of all these
SLA. Notice that the delay and loss in the 5G link can be
parameters in our previous works [15, 16, 40]. Finally, λ
agreed with the service provider (i.e., the telco operator)
and LPDU represent the number of packets transmitted per
and hence can be seen as constant values. However, the first
second and their payload length, respectively (e.g., 50
two (WiFi networks) have to be estimated.
packets/second and 160 Bytes for G.711 codec).
To derive the VoIP Capacity of any AP in our system, we
Finally, (2) and (3) can be completed as
extend Bianchi’s Markov-chain analytical model [49] of the
IEEE 802.11 MAC sublayer performance. Our analytical
! !
!
model takes the location of the access point (e.g., a ) and Ppl = 1 − 1 − LWiFi d i 1 − LWiFi a j ð1 − L5G−SLA Þ ,
!
its associated stations (Cð a Þ) as input parameters and
returns a τ expression for each contending station as its ð22Þ
probability of transmission attempt. The output of our ana-
lytical model can be used to derive the estimated delay, ! !
d = 20 ms + DWiFi d i + DWiFi a j + d5G−SLA , ð23Þ
packet loss ratio, and aggregated throughput at a given AP
as follows:
where 20 ms accounts for the packetization interval for
1 − FER
!
ðaÞ τ ð a ÞQ
!
! ! 1−τ
!
ðuÞ the G.711 codec. Once computed, Ppl and d can be further
! u ∈C ð a Þ substituted in (1) to obtain R.
LWiFi a = 1 − !
,
C a · λ · E ½T 5.2.3. Computational Complexity. In terms of computational
ð19Þ complexity, the most demanding procedure in our heuristic
search is the fitness evaluation (Check function). If we
assume that D is upper bounded by A and that the maxi-
h ! i
DWiFi a = E Bð a Þ · E½T ,
! mum number of calls to the Check function is upper
ð20Þ
bounded in our heuristics, the computational complexity10 Wireless Communications and Mobile Computing
4.5
4.5
4.0
4.0
3.5 3.5
A-UAVs (#)
D-UAVs (#)
3.0 3.0
2.5 2.5
2.0 2.0
1.5 1.5
1.0
1.0
20 40 60 80 100
20 40 60 80 100
Ground users
Ground users
L = 25m×25m L = 75m×75m
L = 25m×25m L = 75m×75m
L = 50m×50m L = 100m×100m
L = 50m×50m L = 100m×100m
(a) Number of deployed D-UAVs (b) Number of deployed A-UAVs
100
85
99
User coverage (%)
Speech quality (R)
80
98
75 97
70 96
65 95
20 40 60 80 100 20 40 60 80 100
Ground users Ground users
L = 25m×25m L = 75m×75m L = 25m×25m L = 75m×75m
L = 50m×50m L = 100m×100m L = 50m×50m L = 100m×100m
(c) Speech quality (d) Percentage of covered users
−58
−60
RSSI (dBm)
−62
−64
−66
−68
20 40 60 80 100
Ground users
L = 25m×25m L = 75m×75m
L = 50m×50m L = 100m×100m
(e) Average RSSI at ground users (f) Average area covered by A-UAVs
Figure 4: Numerical results.Wireless Communications and Mobile Computing 11
of the SolveOptim_PSO function can be expressed as O
ðA · UÞ; hence, the computational complexity of Algo- 100
rithm 5.1 can be expressed as OðD · A2 · UÞ.
80
Execution time (s)
6. Results
60
We have used our PSO-based search algorithm to find opti-
mal solutions in different scenarios. This section begins with 40
a 100 m × 100 m scenario and 60 ground users for illustrative
purposes. Then, we explore other scenarios changing the 20
terrain size (from 25 m × 25 m to 100 m × 100 m) and the
number of users (from 10 to 100). 0
20 40 60 80 100
6.1. Example Solution. This section provides a first example
solution in a 100 m × 100 m terrain with 60 ground users Ground users
randomly placed. The rest of the parameters used are listed L = 25m×25m L = 75m×75m
in Table 3. Such settings are common to all experiments in L = 50m×50m L = 100m×100m
this section unless otherwise specified.
The PSO-based search algorithm in Algorithm 2 has Figure 5: Performance analysis.
been implemented in Matlab 2020a, providing the results
shown in Figure 3. In this scenario, four A-UAVs and two behavior is similar various terrain sizes, the final number
D-UAVs are required to cover 58 of the 60 ground users of UAVs changes with user sparsity (m2 /U); if the terrain
while guaranteeing a minimal speech quality of 65 (R factor). is increased with the same number of ground users,
In Figure 3, ground users are represented with circles UAVs have to cover a larger area to satisfy coverage con-
filled with color (if covered) or not (if uncovered). Each straints (C/U ≥ C min ); hence, the number of drones is
ground user is associated with an A-UAV of the same color driven by the signal coverage constraint instead of the
whose location has been derived from the algorithm. Finally, speech quality constraint.
each A-UAV is associated with a D-UAV in a similar man- Figure 4(d) shows the percentage of users covered in
ner. As such, colors represent the final association between each scenario. Our results suggest that larger areas tend
different layers. According to Figure 3, two 5G links would to provide lower ratios of user coverage due to a greater
suffice to serve the 58 ground users under coverage. distance between users and A-UAVs. This, in turn, penal-
izes the path loss. Figure 4(e) represents the average
6.2. Numerical Analysis. In this section, we examine the received signal strength (RSSI) for each series of experi-
solutions found in several scenarios. In particular, the num- ments. As illustrated, the RSSI increases with the number
ber of ground users has been increased from 10 to 100 (in of ground users. This is attributable to the fact that requir-
steps of 10) in four square terrain sizes (25 m × 25 m, 50 m ing more A-UAVs to meet the speech quality requirements
× 50 m, 75 m × 75 m, and 100 m × 100 m). Each experiment (e.g., reduce congestion) also produces UAVs located
(i.e., scenario) has been repeated 30 times to obtain a 95% closer to users, hence increasing RSSI values. As a conse-
confidence interval by randomly placing ground users uni- quence, the effective area covered by each A-UAV is
formly along the terrain. Finally, Figure 4 illustrates the aver- reduced (see Figure 4(f)).
age value of the results obtained with the corresponding
confidence interval. 6.3. Computational Performance. The previous series of
Figures 4(a) and 4(b) show the optimal number of D- experiments have also been analyzed in light of computa-
UAVs and A-UAVs, respectively, for different numbers of tional performance. To this end, we measured the average
users (U) and terrain sizes. At first sight, it can be observed time spent during the execution of the algorithm. Figure 5
that the overall number of UAVs tends to grow when either illustrates the execution time in seconds for the same series
the terrain size or the number of users increases. of experiments in an Intel Core™ i5-4460 processor with
If we take a closer look into the 50 m × 50 m series, the 8GB of RAM.
number of A-UAVs experiences a steep growth after 20 The results shown in Figure 5 suggest that the execution
users. This effect is due to network congestion, so more time increases with user density (U/m2 ) for a given terrain
UAVs are required to satisfy the speech quality constraints. size, so more dense scenarios require more CPU time. How-
This behavior is reaffirmed in Figure 4(c), which represents ever, the execution time is almost linear when solving low
the speech quality, and shows that speech quality degrades user-density scenarios (e.g., 100 m × 100 m). In all cases,
when more users are added to the system. Indeed, after 70 the results were obtained in less than 100 seconds.
users, more D-UAVs are required to aggregate the traffic
from the access network so that QoS is not negatively 7. Conclusion and Further Steps
affected. In our results, it is likely that each D-UAV associ-
ates with up to three A-UAV hence reducing the number This paper has dealt with the creation of a drone-assisted
of 5G links required to provide the service. Although this VoWiFi communication service, which could be of use in12 Wireless Communications and Mobile Computing
cases such as emergency situations or covering live events [9] S. K. Khan, U. Naseem, H. Siraj, I. Razzak, and M. Imran, “The
that lack better alternative infrastructure. We have defined role of unmanned aerial vehicles and mmWave in 5g: recent
a new optimization problem for the deployment of drones advances and challenges,” Transactions on Emerging Telecom-
to create a two-layer network (access and distribution) con- munications Technologies, vol. 32, no. 7, article e4241, 2021.
nected to 5G. Our problem is aimed at finding the minimum [10] S. Morgenthaler, T. Braun, Z. Zhao, T. Staub, and
number of drones (and their type and location) required to M. Anwander, “Uavnet: a mobile wireless mesh network using
deploy the service constrained to a minimum user coverage unmanned aerial vehicles,” in 2012 IEEE Globecom Work-
and speech quality. shops, pp. 1603–1608, Anaheim, CA, USA, 2012.
Using a PSO-based search algorithm, we have calculated [11] S. Aust, R. V. Prasad, and I. G. Niemegeers, “Outdoor
the optimal solution for terrains up to 100 m × 100 m and long-range wlans: a lesson for IEEE 802.11ah,” IEEE Com-
munication Surveys and Tutorials, vol. 17, no. 3, pp. 1761–
100 users with moderate computational resources. The over-
1775, 2015.
all number of UAVs tends to increase with the terrain size
[12] M. S. Alvissalim, B. Zaman, Z. A. Hafizh et al., “Swarm quad-
(i.e., with users’ sparsity) or with the number of users. The
rotor robots for telecommunication network coverage area
next step planned is to explore new applications in this field:
expansion in disaster area,” in 2012 Proceedings of SICE
(a) to implement a model-based Call Admission Control Annual Conference (SICE), pp. 2256–2261, Akita, Japan, 2012.
(CAC) algorithm in UAVs, so new calls can be rejected if
[13] M. Erdelj, M. Król, and E. Natalizio, “Wireless sensor networks
the network is saturated; and (b) to explore new applications and multi-UAV systems for natural disaster management,”
of the 3-D UAV optimal placement, such as quality- Computer Networks, vol. 124, pp. 72–86, 2017.
guaranteed videocalls or IoT sensing through drones, that [14] H. Shakhatreh, A. H. Sawalmeh, A. Al-Fuqaha et al.,
might require a different network architecture. “Unmanned aerial vehicles (UAVS): a survey on civil applica-
tions and key research challenges,” IEEE Access, vol. 7,
pp. 48572–48634, 2019.
Data Availability
[15] V. Mayor, R. Estepa, A. Estepa, and G. Madinabeitia, “Deploy-
No data were used to support this study. ing a reliable UAV-aided communication service in disaster
areas,” Wireless Communications and Mobile Computing,
vol. 2019, Article ID 7521513, 20 pages, 2019.
Conflicts of Interest [16] “Energy-efficient UAVs deployment for QoS-guaranteed
VoWiFi service,” Sensors, vol. 20, no. 16, p. 4455, 2020.
The authors declare that there is no conflict of interest [17] Y. Li, G. Feng, M. Ghasemiahmadi, and L. Cai, “Power alloca-
regarding the publication of this article. tion and 3-d placement for floating relay supporting indoor
communications,” IEEE Transactions on Mobile Computing,
vol. 18, no. 3, pp. 618–631, 2019.
References
[18] C. Pan, C. Yin, J. Yu, and N. Kiran, “3d UAV placement and
[1] M. Hassanalian and A. Abdelkefi, “Classifications, applica- resource allocation in software defined cellular networks,” in
tions, and design challenges of drones: a review,” Progress in 2018 IEEE/CIC International Conference on Communications
Aerospace Sciences, vol. 91, pp. 99–131, 2017. in China (ICCC Workshops), pp. 136–141, Beijing, China,
[2] R. Clarke, “Understanding the drone epidemic,” Computer 2018.
Law and Security Review, vol. 30, no. 3, pp. 230–246, 2014. [19] C. Pan, J. Yi, C. Yin, J. Yu, and X. Li, “Joint 3d UAV placement
[3] F. Al-Turjman, M. Abujubbeh, A. Malekloo, and L. Mostarda, and resource allocation in software-defined cellular networks
“UAVs assessment in software-defined IoT networks: an over- with wireless backhaul,” IEEE Access, vol. 7, pp. 104279–
view,” Computer Communications, vol. 150, pp. 519–536, 104293, 2019.
2020. [20] S. Yin, L. Li, and F. R. Yu, “Resource allocation and basestation
[4] R. Masroor, M. Naeem, and W. Ejaz, “Resource management placement in downlink cellular networks assisted by multiple
in UAV-assisted wireless networks: an optimization perspec- wireless powered UAVs,” IEEE Transactions on Vehicular
tive,” Ad Hoc Networks, vol. 121, article 102596, 2021. Technology, vol. 69, no. 2, pp. 2171–2184, 2019.
[5] R. Shahzadi, M. Ali, H. Z. Khan, and M. Naeem, “UAV assisted [21] Y. Sun, T. Wang, and S. Wang, “Location optimization and
5G and beyond wireless networks: a survey,” Journal of Net- user association for unmanned aerial vehicles assisted mobile
work and Computer Applications, vol. 189, article 103114, networks,” IEEE Transactions on Vehicular Technology,
2021. vol. 68, no. 10, pp. 10056–10065, 2019.
[6] M. Mozaffari, W. Saad, M. Bennis, Y.-H. Nam, and [22] X. Liu, J. Wang, N. Zhao et al., “Placement and power alloca-
M. Debbah, “A tutorial on uavs for wireless networks: applica- tion for NOMA-UAV networks,” IEEE Wireless Communica-
tions, challenges, and open problems,” IEEE Communication tions Letters, vol. 8, no. 3, pp. 965–968, 2019.
Surveys and Tutorials, vol. 21, no. 3, pp. 2334–2360, 2019. [23] D. Hu, Q. Zhang, Q. Li, and J. Qin, “Joint position, decoding
[7] I. Dalmasso, I. Galletti, R. Giuliano, and F. Mazzenga, “Wimax order, and power allocation optimization in UAV-based
networks for emergency management based on UAVs,” in NOMA downlink communications,” IEEE Systems Journal,
2012 IEEE First AESS European Conference on Satellite Tele- vol. 14, no. 2, pp. 2949–2960, 2019.
communications (ESTEL), pp. 1–6, Rome, Italy, 2012. [24] H. Zhao, H. Wang, W. Wu, and J. Wei, “Deployment algo-
[8] S. Rohde, M. Putzke, and C. Wietfeld, “Ad hoc self-healing of rithms for UAV airborne networks toward on-demand cover-
OFDMA networks using UAV-based relays,” Ad Hoc Net- age,” IEEE Journal on Selected Areas in Communications,
works, vol. 11, no. 7, pp. 1893–1906, 2013. vol. 36, no. 9, pp. 2015–2031, 2018.Wireless Communications and Mobile Computing 13
[25] H. Wang, H. Zhao, W. Wu, J. Xiong, D. Ma, and J. Wei, [40] V. Mayor, R. Estepa, A. Estepa, and G. Madinabeitia, “Unified
“Deployment algorithms of flying base stations: 5g and beyond call admission control in corporate domains,” Computer Com-
with UAVS,” IEEE Internet of Things Journal, vol. 6, no. 6, munications, vol. 150, pp. 589–602, 2020.
pp. 10009–10027, 2019. [41] E. Hossain and M. Hasan, “5G cellular: key enabling technol-
[26] J. Chakareski, S. Naqvi, N. Mastronarde, J. Xu, F. Afghah, and ogies and research challenges,” IEEE Instrumentation and
A. Razi, “An energy efficient framework for UAV-assisted mil- Measurement Magazine, vol. 18, no. 3, pp. 11–21, 2015.
limeter wave 5g heterogeneous cellular networks,” IEEE Trans- [42] Sangho Shin and H. Schulzrinne, “Measurement and analysis
actions on Green Communications and Networking, vol. 3, of the VOIP capacity in IEEE 802.11 WLAN,” IEEE Transac-
no. 1, pp. 37–44, 2019. tions on Mobile Computing, vol. 8, no. 9, pp. 1265–1279, 2009.
[27] S. Zeng, H. Zhang, and L. Song, “Trajectory optimization and [43] J. Sánchez-García, D. G. Reina, and S. L. Toral, “A distributed
resource allocation for multi-user OFDMA UAV relay net- PSO-based exploration algorithm for a UAV network assisting
works,” in 2019 IEEE Global Communications Conference a disaster scenario,” Future Generation Computer Systems,
(GLOBECOM), pp. 1–6, Waikoloa, HI, USA, 2019. vol. 90, pp. 129–148, 2019.
[28] H. Mei, K. Yang, Q. Liu, and K. Wang, “Joint trajectory- [44] A. Al-Hourani, S. Kandeepan, and A. Jamalipour, “Modeling
resource optimization in UAV-enabled edge-cloud system air-toground path loss for low altitude platforms in urban
with virtualized mobile clone,” IEEE Internet of Things Jour- environments,” in 2014 IEEE Global Communications Confer-
nal, vol. 7, no. 7, pp. 5906–5921, 2019. ence, pp. 2898–2904, Austin, TX, USA, 2014.
[29] R. K. Patra and P. Muthuchidambaranathan, “Optimisation of [45] A. Al-Hourani, S. Kandeepan, and S. Lardner, “Optimal lap
spectrum and energy efficiency in UAV-enabled mobile relay- altitude for maximum coverage,” IEEE Wireless Communica-
ing using bisection and PSO method,” in 2018 3rd Interna- tions Letters, vol. 3, no. 6, pp. 569–572, 2014.
tional Conference for Convergence in Technology (I2CT),
pp. 1–7, Pune, India, 2018. [46] M. Mozaffari, W. Saad, M. Bennis, and M. Debbah, “Drone
small cells in the clouds: design, deployment and performance
[30] J. Zhang, Y. Zeng, and R. Zhang, “Spectrum and energy effi- analysis,” in 2015 IEEE Global Communications Conference
ciency maximization in UAV-enabled mobile relaying,” in (GLOBECOM), pp. 1–6, San Diego, CA, USA, 2015.
2017 IEEE International Conference on Communications
(ICC), pp. 1–6, Paris, France, 2017. [47] Q. Feng, J. McGeehan, E. K. Tameh, and A. R. Nix, “Path loss
models for air-to-ground radio channels in urban environ-
[31] Q. Hu, Y. Cai, A. Liu, and G. Yu, “Joint resource allocation and ments,” in 2006 IEEE 63rd Vehicular Technology Conference,
trajectory optimization for UAV-aided relay networks,” in pp. 2901–2905, Melbourne, VIC, Australia, 2006.
2019 IEEE Global Communications Conference (GLOBECOM),
pp. 1–6, Waikoloa, HI, USA, 2019. [48] Y. Zheng, Y. Wang, and F. Meng, “Modeling and simulation of
pathloss and fading for air-ground link of haps within a net-
[32] M. Samir, M. Chraiti, C. Assi, and A. Ghrayeb, “Joint optimi- work simulator,” in 2013 International Conference on Cyber-
zation of UAV trajectory and radio resource allocation for Enabled Distributed Computing and Knowledge Discovery,
drive-thru vehicular networks,” in 2019 IEEE Wireless Com- pp. 421–426, Beijing, China, 2013.
munications and Networking Conference (WCNC), pp. 1–6,
Marrakesh, Morocco, 2019. [49] G. Bianchi, “Performance analysis of the IEEE 802.11 distrib-
uted coordination function,” IEEE Journal on Selected Areas
[33] Q. Chen, “Joint trajectory and resource optimization for UAV-
in Communications, vol. 18, no. 3, pp. 535–547, 2000.
enabled relaying systems,” IEEE Access, vol. 8, pp. 24108–
24119, 2020.
[34] X. Jiang, Z. Wu, Z. Yin, and Z. Yang, “Power and trajectory
optimization for UAV-enabled amplify-and-forward relay
networks,” IEEE Access, vol. 6, pp. 48688–48696, 2018.
[35] G. Zhang, H. Yan, Y. Zeng, M. Cui, and Y. Liu, “Trajectory
optimization and power allocation for multi-hop UAV relay-
ing communications,” IEEE Access, vol. 6, pp. 48566–48576,
2018.
[36] S. Zeng, H. Zhang, K. Bian, and L. Song, “UAV relaying:
power allocation and trajectory optimization using decode-
and-forward protocol,” in 2018 IEEE International Confer-
ence on Communications Workshops (ICC Workshops),
pp. 1–6, Kansas City, MO, USA, 2018.
[37] S. Karapantazis and F.-N. Pavlidou, “VoIP: a comprehensive
survey on a promising technology,” Computer Networks,
vol. 53, no. 12, pp. 2050–2090, 2009.
[38] ITU-T, Recommendation G and Recommendation, G, “107:
The E-model, a computational model for use in transmission
planning,” Recommendation ITU-T, 2005.
[39] H. Assem, D. Malone, J. Dunne, and P. O’Sullivan, “Monitor-
ing VOIP call quality using improved simplified e-model,,” in
2013 International Conference on Computing, Networking and
Communications (ICNC), pp. 927–931, San Diego, CA, USA,
2013.You can also read