Q2 2021 results ESG leader with a sustainable dividend yield - 30 July 2021 - Aperam

Page created by Todd Gibson
 
CONTINUE READING
Q2 2021 results ESG leader with a sustainable dividend yield - 30 July 2021 - Aperam
Q2 2021 results

ESG leader with a
sustainable dividend yield

 30 July 2021
                        1
Q2 2021 results ESG leader with a sustainable dividend yield - 30 July 2021 - Aperam
Disclaimer

  Forward-Looking Statements

  This document may contain forward-looking information and statements about Aperam SA and its subsidiaries.
  These statements include financial projections and estimates and their underlying assumptions, statements
  regarding plans, objectives and expectations with respect to future operations, products and services, and
  statements regarding future performance. Forward-looking statements may be identified by the words “believe,”
  “expect,” “anticipate,” “target” or similar expressions. Although Aperam’s management believes that the
  expectations reflected in such forward-looking statements are reasonable, investors and holders of Aperam’s
  securities are cautioned that forward-looking information and statements are subject to numerous risks and
  uncertainties, many of which are difficult to predict and generally beyond the control of Aperam, in particular, the
  length and severity of the COVID-19 (coronavirus) outbreak, including its impacts in the sector, macroeconomic
  conditions and in Aperam's principal local markets, that could cause actual results and developments to differ
  materially and adversely from those expressed in, or implied or projected by, the forward-looking information and
  statements. These risks and uncertainties include those discussed or identified in Aperam’s filings with the
  Luxembourg Stock Market Authority for the Financial Markets (Commission de Surveillance du Secteur Financier).
  The information is valid only at the time of release and Aperam does not assume any obligation to update or
  revise its forward-looking statements on the basis of new information, future events, subject to applicable
  regulation.

                                                                                                                         2
Q2 2021 results ESG leader with a sustainable dividend yield - 30 July 2021 - Aperam
Content

 1. Q2 2021 highlights                                   page   4

 2. Financial results                                    page 12

 3. Value Strategy                                       page 16

 4. ESG                                                  page 25

 5. Business Overview                                    page 39

        •   Group Segments & corporate structure         page 40

        •   Stainless & Electrical Steel Europe          page 47

        •   Stainless & Electrical Steel South America   page 52

        •   Services & Solution                          page 57

        •   Alloys & Specialties                         page 60

        •   Appendix                                     page 64

                                                                    3
Q2 2021 results ESG leader with a sustainable dividend yield - 30 July 2021 - Aperam
Q2 2021 Operational highlights
Again record earnings on the back of normalizing markets
and self-help
                                        Q2 2021 key developments

         Normalized volumes and normalized pricing in both
         Europe and Brazil

         Aperam demonstrates ESG leadership by getting first
         sites audited by Responsible Steel. Certification pending

         Leadership Journey® phase 4: EUR15m gains in Q2 2021
         (EUR22m since start of program)

         EU: prelim. anti-dumping duties on CR 304 from
         Indonesia & India + Safeguard extended for 3 years
         Brazil: Launch of Anti-subsidy investigation (Indonesia
         CR 304)

         ELG approval process progresses and remains on track

                                            Back to normal

                                                                     4
Q2 2021 results ESG leader with a sustainable dividend yield - 30 July 2021 - Aperam
Europe and Brazil recovery
Demand recovery, cost improvement and effective
protection against dumping support earnings growth
                      Stainless & Electrical Europe                                                 Stainless & Electrical Brazil

                                                                         2020 vs                                                                           2020 vs
                                                                         normal                                                                            normal
    Price*

                                                                                   Mix
                                                                         -43%                                                                              -11pp
               2014

                      2015

                              2016

                                     2017

                                            2018

                                                   2019

                                                          2020

                                                                 H1-21

                                                                                            2014

                                                                                                     2015

                                                                                                            2016

                                                                                                                    2017

                                                                                                                            2018

                                                                                                                                    2019

                                                                                                                                            2020

                                                                                                                                                    H121
                             EU base price            hist avg                                        Stainless share                      Normal

                                                                         2020 vs                                                                           2020 vs
                                                                         normal                                                                            normal
    Volume

                                                                                   Volume
                                                                         -15%                                                                              -10%
               2014

                      2015

                              2016

                                     2017

                                            2018

                                                   2019

                                                          2020

                                                                 H1 21

                                                                                            2014

                                                                                                    2015

                                                                                                            2016

                                                                                                                   2017

                                                                                                                           2018

                                                                                                                                   2019

                                                                                                                                           2020

                                                                                                                                                   H1 21
                  S&E Europe shipments               Normal demand                                 Brazil shipments                Normal demand

                                 Extremely challenging market was hiding
                               EUR223m Leadership Journey ® gains 2018-2020

*Source: CRU
                                                                                                                                                                   5
Q2 2021 results ESG leader with a sustainable dividend yield - 30 July 2021 - Aperam
Market update
Market environment has fully normalized

                                                                 End markets have recovered

Automotive & Transport                       • Normal production and solid outlook. Components shortage and restocking balance each other

Consumer Goods                               • Demand is strong with a stable outlook

Construction                                 • Recovery is visible but slower than expected partly due to raw material shortages

Food, Health & Catering                      • Normal demand in food & health. Hospitality has normalized

Industry, Energy,
                                             • Slow recovery, especially in oil & gas recovery
Chemical

     Distributor inventory is seasonally below normal*                                          Import market share in line with historic average

  90,000                                                                   105
                                                                                                                                                                                                             50.0%
  85,000                                                                   95                            400,000
  80,000                                                                   85                                                                                                                                40.0%
                                                                                                         300,000

                                                                                                tonnes
  75,000
                                                                           75                                                                                                                                30.0%
  70,000                                                                                                 200,000
  65,000                                                                   65
                                                                                                         100,000                                                                                             20.0%
  60,000                                                                   55
  55,000                                                                   45                                 0                                                                                              10.0%
           Q2 17
           Q3 17
           Q4 17
           Q1 18
           Q2 18
           Q3 18
           Q4 18
           Q1 19
           Q2 19
           Q3 19
           Q4 19
           Q1 20
           Q2 20
           Q3 20
           Q4 20
           Q1 21
           Q2 21*

                                                                                                                   Q1-16
                                                                                                                           Q3-16
                                                                                                                                   Q1-17
                                                                                                                                            Q3-17
                                                                                                                                                    Q1-18
                                                                                                                                                            Q3-18
                                                                                                                                                                    Q1-19
                                                                                                                                                                            Q3-19
                                                                                                                                                                                    Q1-20
                                                                                                                                                                                             Q3-20
                                                                                                                                                                                                     Q1-21
                    German distributors inventory (t)         Days
                                                                                                           Imports                         CR market share                                  HR market share

 Weak      Below normal       Normal        Strong      *based on May data as June data was not available in time
                                                                                                                                                                                                                     6
Q2 2021 results ESG leader with a sustainable dividend yield - 30 July 2021 - Aperam
Q2 2021 Segments
Brazil and S&S generate the best quarter ever. S&E Europe
normalizes
          Stainless & Electrical Steel                                      Services & Solutions                              Alloys & Specialties

                            449                                                           265
                                                                                                                                       1,905
                                                                                216                                            1,714
                                                                                                                      1,264
                  290
                                         adj EBITDA*                                              adj EBITDA*                                   adj EBITDA*
                                         (EURm)                                                   (EURm)                                        (EURm)
                            212                                                            50                                           16
                                         a dj EBITDA/t                38        45                a dj EBITDA/t                                 a dj EBITDA/t
        118                                                                                                            11       12
                  140                    (€)                                                      (€)                                           (€)

         43                                                           5

      Q2 20      Q1 21     Q2 21                                    Q2 20      Q1 21      Q2 21                       Q2 20    Q1 21   Q2 21

• Shipments stabilize at a high level:                        • Shipments -9% qoq +12% yoy                        • Shipments -3% qoq +20% yoy
   -2% qoq, +30% yoy as lower
                                                              • QoQ higher adj EBITDA mainly reflects             • QoQ: higher adj. EBITDA was driven
  restocking balances seasonal increase
                                                                better pricing which compensates for                by higher volumes and lower costs
• QoQ: Europe adj EBITDA reflects                               lower volumes. Inventory valuation
                                                                                                                  • YoY: higher adj EBITDA was driven by
  slightly lower volumes better pricing                         gains were comparable
                                                                                                                    significantly higher volumes, higher
  and comparable inventory valuation
                                                              • YoY: higher adj EBITDA due to higher                prices and inventory valuation gains
  gains. Brazil generated the best quarter
                                                                volumes, better pricing and inventory
  ever due to higher prices and volumes
                                                                valuation gains
• YoY: adj EBITDA improves due to
  higher volumes, better prices and
  inventory valuation gains

                          Adj. EBITDA of EUR545/t in Q2 2021 (+ EUR190/t qoq, +EUR414/t yoy)
* Difference with total Aperam’s quarterly adj EBITDA due to Others & Eliminations line
                                                                                                                                                                7
Q2 2021 results ESG leader with a sustainable dividend yield - 30 July 2021 - Aperam
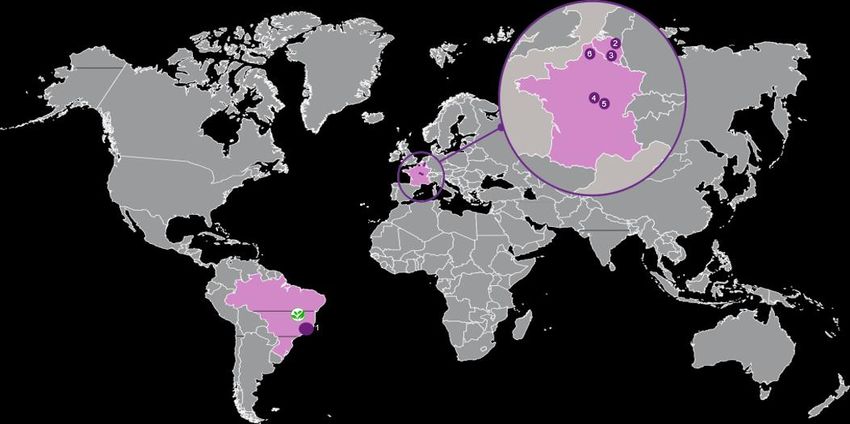
Q2 2021 Financial highlights
Again record earnings, solid cash flow and a fully de-levered
balance sheet
          Strong earnings, positive FCF and strong balance sheet                     Q2 key comments

                                                                          • Stable shipments at a high level.
                                                                            Solid demand in Europe and Brazil
 EURm                          Q2 21    Q1 21     qoq    Q2 20     yoy
                                                                          • Adj EBITDA at all time high: Brazil
 Sales                          1,272   1,177      8%       818    56%      with a peak quarter and pricing
 adj. EBITDA                     262      175     50%        49    435%     recovers in Europe; comparable
                                                                            inventory valuation gains
 EBITDA                          271      175     55%        49    453%
                                                                          • Stated EBITDA contains exceptional
 Basic EPS (EUR)                 2.67     1.45    84%       0.27   900%     gain of EUR9m (PIS/Cofins)
 Steel shipments (000t)          481      493      -2%      376    28%    • EPS increased due to higher adj.
                                                                            EBITDA and a low tax rate of 6.6%
 adj EBITDA/tonne (EUR)          545      355     53%       130    318%
                                                                            (tax contains a EUR32m profit from
 adj EBITDA margin             20.6%    14.9%     39%      6.0%    244%     tax loss carry forward)
 Operating cash flow             115      106      8%        57    102%   • Strong operating CF despite
                                                                            seasonal & raw material price driven
 CAPEX                            -27      -46   -41%        -23   17%      NWC build due to low interest and
 Free cash flow*                   87      58     50%        34    156%     cash tax payments
 Dividends paid                   -36      -35     3%        -37    -3%   • Solid FCF more than covers the
                                                                            dividend. Debt free balance sheet is
 Net financial debt                 1      56    -98%       123    -99%     ready to take on ELG

                       A normal environment highlights
                                                  XXX Aperam’s financial strength

                                                                                                                  8
Q2 2021 results ESG leader with a sustainable dividend yield - 30 July 2021 - Aperam
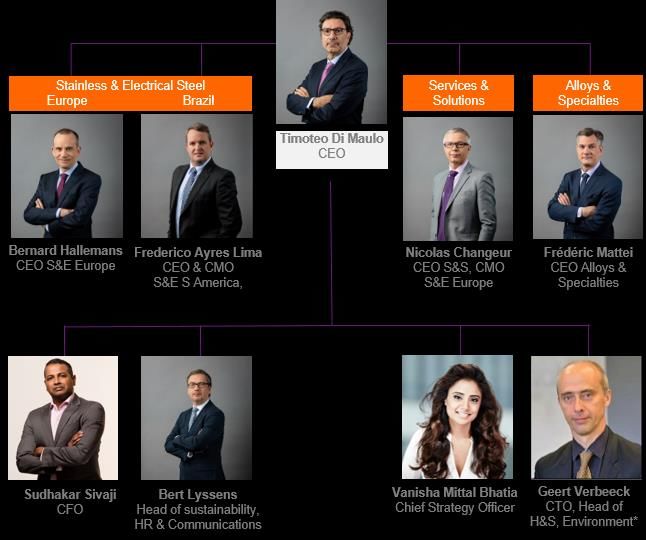
Leadership Journey® Phase 4 (2021-2023)
A mix of cost improvements and growth to
defend Aperam’s cost leadership in Europe
                                           Phase 4 target gains                                 Target savings composition                                                          Cash out

                                     160                                                                                                                                50
                                             Σ EUR150m                                                                                                                                             Σ EUR90m
   Leadership Journey gains (EURm)

                                     140                                                                     Growth &                                                   45
                                                                       Sche-                                                                                                 Schematic

                                                                                                                                             LJ cash out gains (EURm)
                                                                                                             product portfolio                                          40
                                     120                               matic                                                                                            35
                                     100                                                                     Raw material &                                             30
                                      80                                                                     purchasing                                                 25
                                                              Sche-
                                      60                      matic                                                                                                     20                 Sche-
                                                                                                             Fixed costs
                                                                                                                                                                        15                 matic
                                      40
                                             Schematic                                                                                                                  10                              Sche-
                                      20                                                                                                                                                                matic
                                                                                                             Variable costs                                              5
                                       0                                                                                                                                 0
                                              2021            2022         2023                                                                                                2021         2022        2023

                                                Q1       Q2     Q3    Q4                                                                                                       Q1     Q2    Q3     Q4

  Footprint Europe                                                           Structural cost cuts                          Growth                                                          Brazil
  Gueugnon development                                                       Purchasing & sourcing gains     Top line strategy & distribution                              NGO upgrade
   towards specialties                                                        Automation & centralization     Gueugnon transformation                                       HGO mix improvement
  CR center reduction to 3                                                   Ramp up of Genk CRM              enables growth in value
  Site specialisation increases                                                                                added & specialty products
                                                                              FTE reductions
   load of most efficient lines                                                                                Dedicated Alloys growth plan

                                                  A more efficient and lower cost footprint opens up growth opportunities

                                                                                                                                                                                                                9
Q2 2021 results ESG leader with a sustainable dividend yield - 30 July 2021 - Aperam
Outlook
Q3 2021 guidance & other forward looking items

  Q3 2021 Outlook
  •      Q3 2021 shipments are expected at a slightly lower level qoq

  •      Adj. EBITDA is expected at a comparable level versus the record Q2 2021 base
            –     Supportive pricing
            –     Inventory valuation gains at a comparable level

  •      We guide for comparable free cash flow in Q3 2021 despite higher working capital

  Other items:

  •      Cash return to shareholders via a share buyback (EUR100m / max 2.45m shares)
  •      FY 2021 group capex raised to ~EUR165m from EUR130m (accelerated Leadership Journey® phase 5
         investments in AOD and Imphy HRM)
  •      FY 2021 P&L effective tax rate expected at ~20% of which ~ half will be cash tax in CF
  •      FY 2021 base dividend EUR1.75 (amounts to EUR140 million)
  •      Leadership Journey® Phase 4: EUR150 million savings target by end of 2023
  •      ELG acquisition: closing expected in Q4-21*

                                    We expect the best H2 result in Aperam’s history

* Subject to regulatory approvals
                                                                                                        10
Corporate Access

                                Upcoming corporate access events

    •   6 & 7 Sep        Capital Markets Day, Genk (BEL)            Aperam

    •   8 Sep            Steel & Mining Conference                  Credit Suisse

    •   9 Sep            Benelux Conference                         ING

    •   14 Sep           Autumn Conference                          Kepler Cheuvreux

    •   23 Sep           Baader Investment Conference               Baader/ Alphavalue

    •   06 Oct           The European ESG/ SRI Conference           Societe Generale

        We are looking forward to discuss Aperam’s long term strategy in more detail

                                                                                         11
Financial Results

Middle East Training Center, Beirut Rafic Hariri International Airport, Lebanon - Khatib & Alami Executed using grade316L with Uginox Méca 8ND fini

                                                                                                                                                      12
Financial results
Q2 2021: Highest ever adj. EBITDA

   Q2 volumes increased 28% yoy versus a low base.                Q2 adj. EBITDA reflects solid volumes, higher prices
    Demand remains solid in both Europe and Brazil                              and tight cost control

                                                                                                                              20.6%

                                                                                                                              262
                                                      493
                                                            481                                                       14.9%
    465
                                                                                                              11.9%
                        438                                                                                           175
                                     432    431
          418                                                        8.7%
                                                                            8.1% 8.5%                  7.7%
                 402                                                                     6.7%
                                                                                                6.0%          109
                              376                                    95
                                                                             79    85
                                                                                         70            65
                                                                                                49

   Q2 19 Q3 19 Q4 19 Q1 20 Q2 20 Q3 20 Q4 20 Q1 21 Q2 21            Q2 19 Q3 19 Q4 19 Q1 20 Q2 20 Q3 20 Q4 20 Q1 21 Q2 21

                 Shipments (thousand metric tonnes)                       Adj. EBITDA (m€)        Adj. EBITDA as % of Sales

                Q2 reflects a fully normalized environment and inventory valuation gains

                                                                                                                                      13
Financial results
Q2 2021: Record earnings in Brazil, S&S and A&S together
with a solid recovery in Europe yields an all time high EPS
        Adj EBITDA: all segments achieve record results                                                   Q2 EPS sets a new all time high*

                                                                      262                                                                                        2.67

                                                              175

                                                                                                                                                          1.45
                                                       109
          95                                                                                                                                    1.26
                                                                                                                                                                 213
                 79      85
                                 70             65
                                        49                                                       0.69
                                                                                                                                                          116
                                                                                                         0.47                                   101
                                                                                                                 0.36   0.36             0.30
                                                                                                  57                              0.27
                                                                                                         37       29     29       21     24

                                                                                                Q2 19 Q3 19 Q4 19 Q1 20 Q2 20 Q3 20 Q4 20 Q1 21 Q2 21
       Q2 19 Q3 19 Q4 19 Q1 20 Q2 20 Q3 20 Q4 20 Q1 21 Q2 21

                        S&E       A&S        S&S       Other                                                    Net result (m€)                 EPS (€)

                                              All segments contributed to earnings growth
*Q4-19: Income tax expense contains a EUR26m impairment of the deferred tax asset *Q2-20 Financial result contains a EUR15m interest payment on Brazil PIS/COFINS
position *Q4-20 contains a EUR51m financial result gain related to PIS/Cofins *Q2-21 contains a EUR10m PIS/Cofins gain and a EUR32m DTA from tax loss carry             14
forwards
Financial results
Q2 2021: Solid free cash flow despite seasonal & raw material
price induced working capital build. Debt free balance sheet
        Higher EBITDA translates into a solid FCF despite
                                                                                          Strong balance sheet and NFD decreases qoq and yoy
                 seasonal working capital build

      EURm

                           140

          72
                                                       55
                                                               88                 87
                   45                                                      58
                                             34
                                    18
          Q2 19

                   Q3 19

                           Q4 19

                                    Q1 20

                                             Q2 20

                                                       Q3 20

                                                               Q4 20

                                                                          Q1 21

                                                                                  Q2 21

          Change in working capital                  Capex             Free Cash Flow

         Aperam’s dividend rests on a solid balance sheet and a structurally high FCF generation
* Includes interest, taxes and other items
                                                                                                                                               15
Value Strategy

Bodega Irius, Barbastro, Huesca - Spain J. Marino Pascual y Asoc. Arquitectura
©Adobe
  Adriana Landaluce Executed using grade 316L with Uginox Top finish
       stock                                                                     © Adobe Stock

                                                                                    16
Investment case & value strategy
Guiding principle: Combining growth, mix and cost
improvements to restore a normal level of profitability
                                                              Aperam foundation

                                       Progressive dividend policy
                                                   High cash generation

                                                                   Performance & cost

                                                                                          Differntiated, stable
                                        Only stainless mill

                                                                    leader in Europe
                 Own distribution

                                                                                                                  Industry leading
                                                                                            Alloys business

                                                                                                                    ESG position
                                          in S. America
                  & e-business

      Value added
                                    Cost improvement                                    Growth                    De-commoditization
       distribution
                                                       Solid balance sheet

             LJ 4 adds new dimensions to a proven cost improving track record

                                                                                                                                       17
Investment case & value strategy
Financial policy: Strong balance sheet, investment in long term
earnings growth and solid cash returns to shareholders
                                                    Financial Policy                                                                       2021e

                                                                 Return excess cash to                                            Share buyback
    5
                                                                       investors                                             EUR100m max2.45m shares

    4                                                                      Dividend                                                  Dividend of EUR1.75
                                                base dividend, progressively increases over time*                                        =ෝ EUR140m

    3                                     Value accretive growth + M&A                                                           ~EUR35m capex
                                                                   min IRR 15%                                                EUR357m ELG acquisition²

                           Company Sustainability, Upgrade and                                                                  ~EUR80m maintenance
    2                                                                                                                            ~EUR50m Leadership
                                    Transformation                                                                                   Journey®

    1                                     Strong balance sheet
               Ratios consistent with investment grade ratios , NFD / EBITDA of
Investment case & value strategy
Leadership Journey® Self help has turned Aperam into a
resilient, profitable and cash generative company
      Phase 1 (USD350m):                          Phase 2 (USD225m):             Phase 3 (EUR200m):           Phase 4 (EUR150m):
      2011-13 Restructuring                      2014-17 Asset upgrade          2018-20 Transformation      2021-23 Footprint & Growth

                Realized cost savings                        Number of production lines                       Headcount (FTE)
  1000   EURm

   800
                                                                                -26%                                        -11%
   600

   400

   200

     0
           2011
           2012
           2013
           2014
           2015
           2016
           2017
           2018
           2019
           2020
          2021e
          2022e
          2023e

                                                                 2011                  2020                  2011                  2020

           Adj EBITDA & base price                                  Free cash flow                                 Dividend paid

                                                          EURm                                       EURm
                             +4%

                             -46%                                                                                   +216%
                                                                        +550%
                                                                                       195                                         139

                                                                                                              44
                                                                  30
                2011                 2020
                adj EBITDA          Base price                   2011                  2020                  2011                  2020

Source: CRU (base price), Aperam accounting data
                                                                                                                                          19
Investment case & value strategy
Track record: Aperam a solid performer in every part of the
cycle
                                                                        Transformation yields a positive net income even
  Solid operating performance despite market headwind
                                                                             in a recessionary market environment

                                             12.7%                                                                   4.00     3.39
                                    11.8%                                                                    2.47                      2.19    2.19
                            10.6%                      10.8%                                        1.99
                     8.9%                                                                   0.91
                                                           8.0% 8.1%
                                            567                                                                       320
            5.7%                                    504                                                                        286
                             451    455                                   -1.08 -0.96                        193                               175
   4.1%                                                                                             155                                148
                    368                                    340                                71
                                                                  293       -86      -74
            220
     168
                                                                         2012 2013 2014 2015 2016 2017 2018 2019 2020
    2012 2013 2014 2015 2016 2017 2018 2019 2020
                                                                                           Net result (m€)                       EPS (€)
                   Adj. EBITDA (m€)               adj. EBITDA margin

                                                                         2019 & 2020 volumes reflect soft real demand in
          A strong balance sheet is corporate policy
                                                                        both EU and Brazil and trade war induced imports

      26%
             23%

                                                                                                                               1,972
                     20%

                                                                                                                      1,936
                                                                                                             1,917
                             14%

                                                                                                   1,886
                                    6%

                                                                                           1,813
                                                          3%     3%

                                                                                                                                       1,786
                                                   2%
      619                                   -2%

                                                                                  1,728
              501    442
                                                                        1,683

                                                                                                                                                1,677
                             290    147                    75    67
                                            -63    48

      2012 2013 2014 2015 2016 2017 2018 2019 2020                      2012 2013 2014 2015 2016 2017 2018 2019 2020

             Net debt (m€)               Gearing (%)                                               Aperam shipments (kt)

                                                                                                                                                        20
Investment case & value strategy
Resilience: Strong balance sheet, high liquidity and low
maintenance capex
                                                                                                           Low maintenance capex + solid investment
   A strong balance sheet adds safety in a volatile industry*
                                                                                                                   in growth improvement

          3.7                                                                                        200
                    2.3                                                                              175
                                                                                                     150                                   84
                           1.1                                                                                                    47
                                   0.6                                                               125                                             61                ~80
             619                           0.3                  0.2    0.2    0.3                    100                34
                    501 442                       -0.1 0.1                            0.0                    44
                                                                                                                                                               50
                                                                                                      75
                                  290                                                                 50                         117       108
                                                         48     75     67     56                                        84                           90                ~85
                                          147 -63                                      1                     75                                                59
                                                                                                      25
                                                                                                       0
             2012

                    2013

                           2014

                                   2015

                                           2016

                                                  2017

                                                         2018

                                                                2019

                                                                       2020

                                                                              Q1 21

                                                                                      Q2 21
                                                                                                            2015       2016      2017     2018      2019      2020    2021e

                                                                                                            Replacement capex (EURm)              Growth / Improvement
                      Net debt (m€)                      Net debt / LTM EBITDA

                Balanced maturity profile & ample liquidity                                      Flexible mix and broad range of financing instruments2

       800
       700
       600                                                                                                        Schuldschein
                                  No credit arrangement contains
       500                                                                                                                                                Leasing &
       400                        any earnings related covenant                                                                                             other
       300
       200
       100
         0
                      2021 2022 2023 2024 2025 2026 2027 2028 2029 2030

         EIB loan                         Leasing & other              Schuldschein
         Com. Paper & other               Cash & equiv.                RCF                                                                       EIB loan

*Aperam intends to maintain a strong balance sheet that is consistent with investment grade ratios   2Financing   documentation is in line with investment grade standards and
contains no pledges of assets or earnings covenants                                                                                                                              21
Investment case & value strategy
Shareholder focus: We care about investors and can support
it due to a high & stable FCF
                                                          Solid cash generation through the cycle

                                                                                                                                                    112%
                                                                                                                                                             88%
                       High profitability                                                                 78%        85%
                                                                                                                                67%      59%
                                                                                                45%
                                                                                                                     377        374                  400
                                                                                                          354
                                                                                                                                            295               303
                       Low cash taxes*
                                                                                                 184

                                                                                                2014     2015       2016        2017     2018       2019     2020
                      Low cash interest                                                            Cash-flow from operations (m€)                 Cash flow conversion

                Solid average 8% free cash flow yield*                                          Best in class cash distribution to shareholders

                       9%                                     12%                             (EURm)
                                 8%       6%
             6%                                     5%
                                                              281       7%
                                260                                                                                                    93                     100
                                                                                                             90            70
                                          211                          195
                      241                                                                                                              142          139       140
                                                                                                             106         130
                                                    108                                           87
             106
                                                                                                 2016       2017        2018           2019        2020      2021e
            2014      2015     2016      2017      2018      2019      2020
                                                                                                                   Dividends      Share buy backs
                      Free Cash Flow                      FCF Yield

*at year end 2020 the recognized deferred tax asset on tax losses amounted to EUR97m and the unrecognized deferred tax asset amounted to EUR405m
                                                                                                                                                                         22
Investment case & value strategy
Portfolio improvement: Top line strategy

                              Constant innovation to shift portfolio into attractive growth / margin segments

                                                                                                            New products in sales
   Growth

                                                                  Niches

                                                                                        Index 2015=100
                                                             Margin management /
                                                               demand driven

                      New Asian
                     competition
                                           Margin                                                        2015   2016   2017   2018   2019   2020

    Guiding principle: strengthen product & service differentiation
    •       Increase competitiveness against other materials by improving existing solutions
    •       Innovate and apply existing solutions to new target markets
    •       Develop innovative new products
    •       Optimize product & customer mix
    •       Redefine distribution channels
 Aperam product areas (size indicates volumes)
                                                                                                                                                   23
Investment case & value strategy
ESG excellence: Take a look at Aperam from an ESG
perspective
                  Our mission is to produce reliable, 100% recyclable, green stainless steel

 Products         Non toxic, long lifespan and 100% infinitely recyclable without loss of quality

 Climate change   We have the lowest CO2 footprint in the stainless industry globally*
                                                                                               *scope 1 & 2

 Environment      We are recycling champion and 33% of our energy intake is renewable

 Process          We have ambitious ESG targets and a convincing track record

 Social           We value our diverse workforce, invest in training & 86% rate us a good employer

 Governance       The majority of our board is independent

 Compliance       We have a robust compliance framework and a zero tolerance policy

    Please find our complete ESG presentation & report at: www.aperam.com/sustainability

                                                                                                              24
ESG
Silène luminaris sive Muflier de Borges, Miguel Chevalier Fondation Clément, Le François, Martinique – France Fabrication : Serrurerie La Parette, Roquefort-la Bédoule
Aperam stainless steel used : Aperam 316 Hot Rolled

                  Aperam produces the greenest stainless steel globally

                                                                                                                                                                          25
ESG summary
ESG is core at Aperam and starts at the top

                                                  We take E, S and G seriously

 Governance & Stakeholders                                                     Social
 • Our high ethical standards are reflected in our                             • Our people are colleagues with whom we share
   robust corporate governance and structured                                    values and a common future
   compliance program with a zero tolerance                                          – Their safety is our non-negotiable
                                                                                        priority
   policy for non compliant behavior
                                                                                      – Their motivation and creativity is our
 • our Board of directors is composed of a
                                                                                         greatest asset
   majority of independent directors. Board
   Committees are independent members only                                            – Their development is a key to our
                                                                                         success.
 • We aim to be a partner of choice for our
   customers and suppliers                                                     • We actively promote diversity

 • Our Corporate Responsibility is reflected by                                • We believe in a positive dialogue and have
   local programs and stakeholder engagement                                     collective labour agreements in place throughout
                                                                                 Aperam
 • Our approach is fed with and supporting the
   multi-stakeholder ResponsibleSteelTM initiative

 Environment
 • As an energy-intensive company, we consider environmental consciousness as a necessary prerequisite to our sustainable
   profitability
 • Recycle: Our products are infinitely recyclable and our main input in Europe is recycled scrap
 • We have an industry leading CO2 footprint with the greenest” stainless steel globally due to our FSC-certified forest in Brazil
 • We have clear targets in place to improve our environmental performance and are a member of Responsible Steel®

                                                                                                                                     26
ESG summary
Product & process: Aperam produces a superior product in
a sustainable and responsible way
                                     Our mission is to produce reliable, 100% recyclable, green stainless steel
            Superior product                                                 Renewable energy                                                      Recycling

                                                                        Stainless Steel
             Very long useful life                                       100% recyclable                                                  Non toxic

             Corrosion resistant                                      Mechanically strong                                         Abrasion resistant

            Fire & acid resistant                                        Magnetic (or not)                                   Aesthethically pleasing

                                               Renewable energy
        Our blast furnace in Brazil uses only charcoal as fuel - produced from our sustainably cultivated
                                              FSC-certified forests
                                                                Recycling
                                      Aperam’s main input in Europe is recycled scrap (>80%)
                                   Our Recyco unit recycles dust, sludges & residues for us and third parties
Best practice forest management, recognized by the Forest Stewardship Council’s (FSC®) certification, which standards and principles conciliate ecological protection (flora and
fauna, but also water reserves) with social benefits and economic feasibility. Our forests are made of selected cloned saplings which are considered among the best on the market 27
and they are separated by firewalls and strips of natural vegetation to take into account both fire-prevention, biodiversity preservation and local development (beekeeping).
ESG summary
Our products: We are part of the solution

     Stainless steel is a high added-value material that, due to its unique properties, has a key role in the energy transition

                                       e-Mobility solutions
                                       Aperam’s solutions enable e-vehicle components such as converters, inverters, onboard-charges, motors, EPS, cooling
                                       systems, air conditioning systems, current sensors, charging stations, fuel cells and battery packs

                                       Clean air
                                       Stainless and alloys help the marine transport sector minimizing emissions. Aperam offers scrubbing systems that remove over
                                       90% of Sulphur and 80% of particles. Corrosion resistance grades with high mechanical properties are required

                                       Cryogenic applications
                                       They require a material that can withstand very low temperatures. Aperam solutions (stainless and INVAR M93 LNG tanker) are
                                       specially designed for cryogenic storage; transporting natural gas, ethane, or ethylene; and handling liquefied air gases like
                                       nitrogen, oxygen and argon

                                       Sustainable water supply
                                       Due to its inert nature, stainless is the material of choice for water supply (e.g. tanks and fountains, water boilers, sanitary
                                       piping systems, etc.) and water treatment (e.g. sewerage, distillation, desalination) applications

                                       Solar power
                                       Alloys are resistant to heat, corrosion, fatigue, and creep. It is the ideal material for the receiver tubes used to ensure the flow of
                                       molten salt and for glass metal sealing. Stainless, is the material of choice for the structural and fixing elements used in solar
                                       power systems

                                       Renewable energy
                                       > Electrical steels enable high performing wind generators due to their high permeability.
                                       > The magnetic properties of alloys convert and shape an electrical signal from generation to end use
                                       > Anemometric towers built of stainless steel enjoy an increased life span, reduced maintenance costs, improved safety

                                       The hydrogen economy
                                       Stainless steel and alloys are already used in a number of important hydrogen applications eg fuel cells, production and storage
                                       installations, and transportation*. Aperam is a big supporter of the shift to hydrogen and a proud member of HydrogenEurope

* Eg electrodes in alkaline electrolyzers, catalysts for steam methane reforming, storage and transportation
                                                                                                                                                                           28
ESG summary
Recycling & scrap: Aperam is at the heart of the European
circular economy. Scrap is our dominating raw material
                                                                            Scrap is a closed loop in Europe²

                                                                                             Automotive Construction             Other
                                                                                                                               Transport                  • Aperam uses more than
                                                                                               14 years        50 years        30 years                     85% scrap in its austenitic
            Customers                                                                            90%             85%             90%                        grades
                  (Fabrication &                               End product                       12%             18%              3%                      • Scrap is sourced
                  Manufacturing)                                                              Machinery      Appliances, Metal Goods                        regionally in Europe
                                                                                                             Electronics                                  • Aperam’s location at the
                                                                             Life cycle       25 years        15 years        15 years                     heart of Europe minimizes
                                                                        Recycling rate          90%             80%             80%
                                                                                                                                                            transportation costs &
                                                                          % of end use          29%             8%              29%
                                                                                                                                                            environmental impact
             Stainless steel

                                                                                                                                                          • Aperam’s Recyco unit
                                                                                                                                                            recovers metal content
                                                                                                                                                            from waste material*
                                              New scrap
                                            5-25% Ø 6 months
                                                                     Scrap                             Old scrap
                                                                                                    ~70% Ø 27 years                                       Recycling content of
                                                                    collection                                                                            stainless steel by region:

                               Revert scrap
                                 ~11%,
ESG summary
Environment: Bio Energia & recycling give Aperam a best in
class climate change footprint
                           Aperam energy mix 2020                                             Aperam’s has the smallest CO2 footprint in the industry*

                                                                                                   CO2 t/t scope 1+2

                                         3%
                                                                                                                                                        1.8
                                                                                                                                     1.0
                      28%                                                                                       0.5
                                                             39%
                                                                                                           Aperam          Global stainless       Global steel

                                                                                                   CO2 t/t **

                                                                                                                            Factor
                                                                                                                             >4x
                                     30%                                                                                                           >8
                                                                                                                      ~2

              Charcoal          Natural Gas          Electricity      Other                                     EU industry                NPI based producers

                                    Our sustainably cultivated forest in Brazil is a unique asset
Source: Aperam estimates & calculation, ISSF data, CRU       *Data is for austenitic HR steel, scope 1+2
**scope 1 + 2 + total raw material emissions and transport                                                                                                       30
ESG summary
Aperam supports the United Nations’ Sustainable
Development Goals
                        We take broad responsibility: our Products and Environmental and Social action

                                                     Gender balance ranks                     In our forestry, located on
                                                     highly on our priority list              hydric-stressed areas like
                                                     since 2017 and has a                     our other plants, lowering
Health & Safety is Aperam’s primary         special commitment from                  water consumption and improving
concern and the priority in all our         management. Aperam established           the quality of discharge are key
proceedings                                 specific objectives for creating more    elements of our environmental
                                            gender balance in our workforce          strategy

         More than 30% of Aperam’s                    Research & Development                  Aperam is committed to a
         energy comes from                            and innovation are top                  sustainable cohabitation
         renewables, mainly as                        priorities for Aperam. We               with our neighboring
biomass (charcoal) and, via pilot           also help our customers to adapt         communities, allowing host cities to
projects, wind and solar                    their own processes (welding,            thrive and addressing inhabitants’
                                            stamping, etc.) to make the most of      legitimate requests
                                            their tools

        Aperam is a recycling                         Our BioEnergia cultivated               Ethics are a key component
        champion: We use the                          forest produces charcoal                to Aperam’s values. We
        maximum amount of                             which we use instead of met             comply with all applicable
recycled material in our production         coal & coke. The forest also acts as     regulations, interact transparently
(eg 85%+ scrap in Europe) and also          a FSC certified carbon sink. Aperam      with authorities and support the fight
take good care to leverage wastes           plants are constantly reducing their     against corruption, money laundering
and by-products in line with our zero-      energy consumption and participate       and anti-competitive practices -
waste target                                in our climate action plan               among others

 Environment   Social      Governance                                                                                       31
ESG summary
Health & safety performance

                                             Health & Safety frequency rate

  3.0

  2.5

  2.0

  1.5

  1.0

  0.5

  0.0
        2007

               2008

                      2009

                               2010

                                      2011

                                             2012

                                                    2013

                                                            2014

                                                                   2015

                                                                          2016

                                                                                 2017

                                                                                        2018

                                                                                               2019

                                                                                                      2020

                                                                                                             H1-21
                             Health & Safety of our people is our prime objective

                                                                                                                     32
ESG summary
Social: Our people are our asset

               Criteria                                                Target                                                  Aperam 2020 status

        Lost-time injury
         frequency rate
ESG summary
Environment: A best in class footprint²

                Criteria                                               Target 2030                                                    Aperam 2020 status

        Energy intensity*                                   11.1 GJ/t           -11% vs 2015                                             13.4 GJ/t           +5%             !

          CO2 intensity**                                   0.39 t/t            -30% vs 2015                                            0.47 t/t             -14%           

      Water consumption                                     5.8 m3 /t          -40% vs 2015                                             11.6 m3 /t          +14%             !

           Dust intensity                                   70 g/t              -70% vs 2015                                            152 g/t              -36%           

        Zero Waste target                                     >97% reused / recycled                                                    94.3%             +0.8pp            

                                     Lower production volumes hurt some KPI’s in 2019 & 2020

      We aim to exceed environmental legislation and are committed to continuous improvement
*amounts to -11% on electricity & natural gas     **Scope 1+2. An internal CO2 price of €60/t is applied to all investments. We review and adjust this if necessary to maintain
the incentive for CO2 savings    ²per ton of slab                                                                                                                                 34
ESG summary
Environment: Aperam has a convincing environmental track
record and clear improvement targets. Low volumes impacted 2019 & 2020
                        CO2 emissions (t/t crude steel)*                             Energy consumption (GJ/t crude steel)

         0.78
                 0.72                                                           14.7
             0.70
                     0.61                                                   14.0    13.814.013.613.6
                                             0.58                                                                       13.313.4
                                                                                                    13.012.812.8
                                         0.55    0.49                                                           12.412.5
                             0.50                    0.49 0.500.47                                                                     12.1
                                 0.480.48

                                                                     0.39

                                                                            2008
                                                                            2009
                                                                            2010
                                                                            2011
                                                                            2012
                                                                            2013
                                                                            2014
                                                                            2015
                                                                            2016
                                                                            2017
                                                                            2018
                                                                            2019
                                                                            2020

                                                                                                                                        2030
         2008
         2009
         2010
         2011
         2012
         2013
         2014
         2015
         2016
         2017
         2018
         2019
         2020

                        Dust emissions (g/t crude steel)             2030                           Water intake (m3/t)

                     254                                                                                 11.8 11.6
         211 213 240     185 162
                                                                            11.5 10.7 10.2 10.1
                                                                                                10.1 9.9
                                 147 152                                                                                               5.9
                                                                     70
          2013

                 2014

                          2015

                                 2016

                                        2017

                                               2018

                                                       2019

                                                              2020

                                                                     2030

                                                                              2013

                                                                                      2014

                                                                                             2015

                                                                                                    2016

                                                                                                           2017

                                                                                                                  2018

                                                                                                                         2019

                                                                                                                                2020

                                                                                                                                       2030
target             Actual               *scope 1 & 2
                                                                                                                                               35
ESG summary
Aperam’s CO2 footprint: Aperam Europe fulfils the EU
Taxonomy = environmentally sustainable economic activity
 Aperam has a industry leading CO2 footprint and produces the greenest stainless steel globally
0.49 t CO2 /t*

                  Raw materials                                                EU Taxonomy**
                                                    Electricity                Threshold 0.352 t/t
                  Stainless scrap                                              APAM 0.27 t Co2 / t          EU ETS (= scope 1)
   Europe

                  Ferronickel                   Consumables:                                                                                                                                                    Electricity
                  Ferrochrome                   Graphite Electrode                                          Nat. gas                         Electricity                      Electricity
                  Other alloys                  Natural gas                                                                                                                                                      Nat. gas

                                        Electric Arc     Molten               Slab                                                               Hot             HR                Cold            CR          Annealing &
                                                                                            Slab            Furnace           Slab
                                         Furnace         metal               Caster                                                             rolling         band              rolling         band           Pickling

                  FSC certified            Raw materials                Raw materials     Consumables
                    forest                 Iron ore                     SS scrap          Graphite Electrode
                                           Limestone
                                 Wood

                                                                                          Electricity
0.41 t CO2 /t*

                     Charcoal                               Blast                   Electric Arc
                                         Charcoal
                    production                             Furnace                   Furnace
    Brazil

                                        Co2 neutral                                                                                                                                                   Nat. gas                   Nat. gas
                                                                                        Molten
                                                             Pig iron

                                                                                        metal

                                                                                                                Nat. gas                   Electricity                  Electricity
                                                                                                                                                                                                     Electricity               Electricity
                    Stainless

                                   Raw materials
                                   Ferronickel           Second Molten                 Slab                                                    Hot           HR             Cold          CR         Annealing
                                   Ferrochrome                                                       Slab        Furnace        Slab
                                                        Metallurgy metal              Caster                                                  rolling       band           rolling       band        & Pickling
                                   Other alloys
                    Electrical

                                   Raw materials
                                   Silicon               Second Molten                 Slab                                                    Hot          HR              Cold          CR          Decarb.                  High temp.
                                                                                                     Slab        Furnace        Slab
                                                        Metallurgy metal              Caster                                                  rolling      band            rolling       band        Annealing                 Annealing

 Scope 1   Scope 2   Scope 3                                Scope 1 – All Direct Emissions from the activities of an organisation or under their control. Scope 2 – Indirect Emissions from electricity purchased and used by the
                              Product          Process /
                                                            organisation. Scope 3 – All Other Indirect Emissions from activities of the organisation, occurring from sources that they do not own or control*per tonne of slab, scope 1 + 2
emissions emissions emissions                  equipment
                                                            based on ISO14404 **EU Taxonomy* requires 0.352 t CO2/t scope 1+2 or 90% scrap                                                                                                    36
ESG summary
Governance: Our leadership team

                          Key facts & compensation                            A diverse & experienced team

     • Entrusted with day-to-day management of the Company

     • Appointed by the Board of Directors

     • Experience and industry know how

     • Average age: 49 / 6 Nationalities

     • CEO: is ultimately responsible for Aperam’s sustainability
       performance and compliance

     • CTO, is also Head of Health, Safety & Environment

     • Compensation aligned with long term interest of the
       Company and its stakeholders
               Multiplier for performance related bonus includes
                H&S factors (1 year plan)
               Long term incentive plans based on EPS and TSR
                evolution (3 year plan) vs relevant peers and index

             Aperam benefits from the experience and industry know-how of its Leadership Team
*also responsible for environmental & industrial risk on a group wide basis
                                                                                                             37
ESG summary
Governance: Board of directors and shareholder structure

                             Principles of our board                                 Shareholder structure

     ●     Responsible for strategic direction and oversight of the
           business, as well as for appointing senior management
     ●     Election subject to shareholder approval. Directors are                      13%            11%
           elected for 3 year terms
     ●     Chairman: Mr. Lakshmi N. Mittal                                                                          11%
     ●     7 members with a majority of independent directors
           (4 independent directors out of 7)
     ●     Mrs. Ros Rivaz is lead independent director                                                                   10%

     ●     2 Board Committees composed of 100% of
           independent directors and reporting to the Board of                 41%                                      4%
           Directors:                                                                                              4%
                                                                                                              4%
              ▬     Audit and Risk Management Committee                                                2%
                    covering also ESG matters ; Chair: Ms.
                    Bernadette Baudier
              ▬     Remuneration, Nomination and Corporate
                    Governance Committee ; Chair: Mr. Alain
                                                                      N America               France                         UK
                    Kinsch                                            Benelux                 Germany                        Scandinavia
                                                                      Other Europe            Mittal Family                  Private & NA

     Diverse skills, backgrounds, knowledge, experience, geographic locations, nationalities and
                  gender are reflected on our board and ensure effective governance
Source: IHS Markit, Aperam
                                                                                                                                            38
Business overview

                                                            Musée ©
Musée des Confluences in Lyon, France. Architect: Coop Himmelb(l)au des Confluences,
                                                                     Sergio          Lyon - France
                                                                            Pirrone. Stainless steel COOP   HIMMELB(L)AU
                                                                                                     used: Aperam         © Sergio
                                                                                                                  316L/1.4404      PirroneMe
                                                                                                                              with Uginox  Executed using grade 316L - microblasted finish

                                                                                                                                                                                 39
Group segments &
corporate structure

                      40
Business overview
Aperam is a global stainless, electrical & specialty steel
producer. #2 in Europe and the only producer in S. America
                                                        Production assets in Europe and South America

   €3.6bn                                                                                                                                 Revenue by industry
   Sales

   9,400
 Employees

   2.5mt
  Capacity

                                                                                                                                              Revenue by region

   14 steel
   service
                                                             1
   centers

     FSC
   certified
   forest in
    Brazil

1 Timóteo, Brazil   2 Genk, Belgium   3 Châtelet, Belgium   4 Imphy, France   5 Gueugnon, France   6 Isbergues, France   BioEnergia, Brazil
                                                                                                                                                                       41

                                                                                                                                                                  41
Business overview
Group: Segments & corporate structure*

         Stainless & Electrical Steel                               Services & Solutions                         Alloys & Specialties

 2.5mt production capacity                                                                             40 kt production capacity
 1.6mt of gross shipments                                 646kt of gross shipments                     31kt of gross shipments
 77% of group adj EBITDA                                  13% of group adj EBITDA                      15% of group adj EBITDA

 One of the largest global producers of                   S&S is Aperam’s distribution arm. S&S        Fourth largest producer of nickel alloys
 stainless steel**                                        provides value added and customized          globally
 Europe:                                                  solutions through further processing
                                                                                                       Aperam specializes in nickel alloys and
                                                          according to specific customer
 2 Electric Arc Furnaces use scrap as                                                                  specific stainless steels
                                                          requirements. S&S core activities:
 major input material
                                                                                                       Our products take the form of bars,
 Stainless steel flat product output                      •   direct sale of Aperam products to end
                                                                                                       semis, cold-rolled strips, wire and wire
                                                              users
 South America:                                                                                        rods, and plates, and are offered in a
                                                          •   distribution of Aperam and third party
 2 blast furnace use iron ore and charcoal                                                             wide range of grades
                                                              material
 produced from own forests                                •   transformation services, according to    High value items that are often sold on a
 2 EAF use recycled scrap                                     specific customer requirements           kg basis
 Stainless flat products & electrical steel

                Aperam covers the complete stainless value chain with industry leading assets
                                           in Europe and Brazil
*gross shipments and adj EBITDA are before eliminations
** By production capacity                                                                                                                         42
Business overview
Group: Segments & corporate structure II

                                            Production assets in Europe and South America

  Châtelet, Belgium     Genk, Belgium             Gueugnon, France        Isbergues, France       Timóteo, Brazil            Imphy, France

  Location & facts      Location & facts          Location & facts        Location & facts        Location & facts           Location & facts
  Melt shop             Melt shop                 Cold-rolling mill       Cold-rolling mill       Melt shop                  Melt shop
  Hot rolling mill      Cold-rolling mill         Finishing               Finishing               Cold-rolling mill          Cold-rolling mill
                        Finishing                                                                 Finishing                  Finishing

  Capacity              Capacity                  Capacity                Capacity                Capacity*                  Capacity
  Slabs      1,000 kt   Slabs          1,000 kt   Finished       400 kt   Finished      350 kt    Slabs           900kt      EAF             60kt
  HSM        2,800 kt   2 m wide capacity         Specialized in Bright   LC2i: integrated line   Stainless finished         1 VIM, 2 VAR,
                        316 and duplex            Annealing (BA)                                                  350kt      Rotary continuous
                        grades                    products and                                    Electrical CR:             Caster for long
                                                  stabilized ferritics.                           Grain oriented 60kt        products
                        Cold-rolling     700 kt
                                                                                                  Non GO          170kt      Wire hot rolling mill:
                                                                                                  SP Carbon       200kt      40kt
                                                                                                  *some lines are flexibly
                                                                                                  used     for   different
                                                                                                                             6 Cold rolling mills
                                                                                                  products

                                                                                                                                                      43
Business overview
Group: Segments & corporate structure III

                                                                      Aperam’s value chain

           Slabs                       Hot rolling                     Cold rolling / Finishing                             Service

                                                                         Isbergues                             Direct
          Châtelet                                                         0.35Mt                              Sale
           1.0Mt                                                                                               Service
                                                                                                               Center
                                         Châtelet                           Genk           Stainless
                                          2.8Mt                             0.7Mt             flat
                                                                                                               Direct
            Genk                                                                                               Sale

                                                                                                                                          End customers
            1.0Mt                                                       Gueugnon                               Service    Steel service
                                                                          0.4Mt                                Center        centers

                                                                                                                         Transformation
                                                                         Electrical                            Direct
                                                                          0.18Mt         Electrical flat       Sale
          Timoteo                        Timoteo
           0.9Mt                          0.88Mt                                                               Service
                                                                         Stainless       Stainless flat
                                                                          0.35Mt                               Center

                                         Chatelet                                                              Direct
           Imphy                                                                          Ni alloys &          Sale
                                                                           Imphy
           0.06Mt                                                                         specialties
                                           Imphy                                                               Service
                                                                                                               Center

    Stainless & Electrical Steel Europe
                                             }
    Stainless & Electrical Steel South America   Stainless & Electrical Steel
                                                                                        Alloys & Specialties
                                                                                        Services & Solutions                                              44
Business overview
Group: A balanced risk profile and customer structure

                    Shipment split by segment 2020*                           Adj EBITDA contribution by segment 2020*

                                                                                         12%
                      28%                                    S&E Europe                                                   S&E Europe
                                                                                                        33%
                                                             S&E S. America        14%
                                            45%                                                                           S&E S. America
                     1%                                       A&S                                                         A&S
                                                              S&S                                                         S&S
                          26%
                                                                                            41%

                              Revenue by region 2020                             Revenue by customer industry 2020

                                                  Asia &     Brazil
                                                                                                              Building & Construction
                                                                                         7%
                               27%         8%      Africa    US                   10%             27%         Catering & Appliances
      Europe                          8%                     Other Americas
                         7%                                                                                   General Industry
                   68%                                       Germany            17%
                                       18%
                       12%                                                                                    Automotive
                                            24%              Italy
                                     4%                                                                       Energy & Chemicals
                               22%                                                                18%
                                                             France
                                                  Americas                            21%
                                                                                                              Transport
                                                             Other Europe

* Calculated on segmental data before eliminations
                                                                                                                                           45
Business overview
Group: Self help has transformed the group. Higher cash
generation and profitability even in adverse market conditions
             Adj EBITDA by segment (EURm)                                              Shipment by segment (kt)

                                          559                                                                       1,972
                                                  504                                                   1,917 1,936
                           451    455                                                           1,886
                  368                                                                  1,813
                                                          340                                                                  1,786
                                                                 293           1,728
           220                                                         1,683                                                           1,677
    168

    2012   2013   2014     2015   2016    2017   2018    2019   2020   2012    2013    2014     2015    2016   2017    2018    2019    2020

           S&E           A&S        S&S          Group Adj. EBITDA             S&E         A&S           S&S          Group Net Shipments

                        Adj EBITDA/t (EUR)                                                 Adj EBITDA margin

                                                                                                        11.8% 12.5%
                                                                                                10.6%                  10.8%
                                                                                       8.9%
                                                                                                                               8.0%    8.1%
                                                                               5.7%
                                                                       4.1%
                                          289

                                                  256
                           239

                                  237
                  203

                                                          190

                                                                 175
           127
     100

    2012   2013   2014     2015   2016    2017   2018    2019          2012    2013    2014     2015    2016   2017    2018    2019    2020

           S&E           S&S       A&S           Group Adj. EBITDA/t           S&E        A&S           S&S      Group adj EBITDA margin

                                                                                                                                               46
Stainless & Electrical Steel
Europe

                               47
Business overview
S&E Steel Europe: Self-help measures yield a robust
operational performance despite a price and volume squeeze
            Major adj EBITDA contributor 2020                                      Robust profitability capitalizing on restructuring

                                                                                                                                     12.8%
                                                                                                                           11.1%
                                                                                                                  8.8%                        9.1%
                    12%                                                                                   6.7%                        352
                                                                                                                                                     6.0%
                                      33%
                                                               S&E Europe                                                                                   4.6%
                                                                                                 2.7%                       258               260
              14%                                                                                                  220
                                                               S&E S. America          0.5%
                                                               A&S                                        153                                        150
                                                                                        12                                                                   101
                                                               S&S                                57
                       41%                                                             2012 2013 2014 2015 2016 2017 2018 2019 2020
                                                                                                 Adj. EBITDA (m€)                  Adj. EBITDA margin (%)

 European shipments reflect import pressure, destocking                                    European stainless steel demand came
               and weak real demand                                                            under cyclical pressure in 2020

                                                                                                                  Pre-crisis level (2016)
                                                                                 6.0

                                                                                 5.0
                                                       1,267
                                               1,253
                                       1,241
                              1,190

                                                                 1,113
                    1,082

                                                                         1,050
            1,004
      994

                                                                                 4.0

                                                                                 3.0
                                                                                          2012

                                                                                                   2013

                                                                                                           2014

                                                                                                                    2015

                                                                                                                            2016

                                                                                                                                       2017

                                                                                                                                              2018

                                                                                                                                                     2019

                                                                                                                                                            2020
     2012 2013 2014 2015 2016 2017 2018 2019 2020
                            EU S&E Shipments (kt)                                      Stainless European ap. consumption (mt - slab equivalent)

                                                                                                                                                                   48
Business overview
S&E Steel Europe: Leverage Aperam’s unique position

      European stainless steel industrial footprint               Aperam key competitive advantage

    Finishing line
    Steel making                                                      • The only integrated upstream operations
                                                      Sourcing
                                                         Sourcing       in the heart of Europe
                                                                      • Superior access to raw material flows

                                 Outokumpu

                                                                      • Best location to serve the biggest
                                                          Logistics     consumption areas of Europe
                                                      Logistics       • Efficient logistics between sites
                     Aperam                                             results in industry leading working capital
                                                                        management

                                                                     • Full range of products with flexible
                                                                       capacity
    Acerinox                    Terni                     Production • Increase scrap recycling to minimize
                                                      Production
                                                                       environmental impact
                                                                     • Aim to become cost leader in the key
                                                                       products

            Located in the heart of European scrap generation and stainless consumption

                                                                                                                  49
Business overview
EU trade action: Further actions against unfair trade have
been initiated
                               Safeguard                                      Anti-dumping (AD)                                Countervailing duties (CVD)

              •   Maintain traditional trade flows               •   Duty on imports that are priced below               •   Neutralize effect of subsidies that
   Aim

                                                                     fair market value                                       benefit certain imports
              •   Volume focused
                                                                 •   Price focused                                       •   Price focused

              •                                                  •                                                       •
Countries

                  All countries globally (if not explicitly          Hot rolled: China, Indonesia, Taiwan                    Cold rolled: Case opened by EU
 affected

                  exempt)                                            since Oct. 2020 for 5 years                             commission in February 2021 against
              •   Effective since February 2019 till July        •   Cold rolled: China , Taiwan since                       India, Indonesia
                  2024                                               2015, Indonesia, India since May 2021

              •   HR quota 364kt pa*                             •   HR: China 9.2% - 19.5%, Indonesia                   •   To be determined
                  CR quota 861kt pa*                                 17.3%, Taiwan 4.1% - 7.5%
  Measure

              •   Largest importers have a country
                                                                 •   CR: China 25.3%, Taiwan 6.8%
                  quota. A residual quota for all others
                                                                     NEW: India (13.6-34.6%), Indonesia
              •   25% duty for shipments > quota                     (19.9-20.2%)

                                                                 •                                                       •
initiatives

                                                                     Renewal: of cold rolled duty against                    Investigation: of cold rolled duty
                                                                     China & Taiwan (due Q4 2021)                            against Indonesia & India (~25% of CR
   New

                                                                                                                             imports, decision due Q4 2021)

                                                            WTO dispute has been lodged officially

              Safeguard quotas are excessively generous. AD is effective in levelling the playing field
*Effective quota from 1 July 2021 to 30 June 2022. Quotas are quarterly from 07/20. There is one global SS Hot Rolled quotas since July 2020
 SS CR: country quotas S. Korea, Taiwan, India, USA, Turkey, Malaysia, Vietnam **could be difference between domestic market price and export price or cost based   50
Business overview
EU stainless steel imports: Anti dumping is effective in HR
products. Safeguard with minimal effect only in CR products
                                       Hot rolled imports & market share                                                                                 Total stainless imports & market share

                                 150,000                                                                                              50.0%
                Hot rolled (t)

                                                                                                                                      40.0%
                                 100,000
                                                                                                                                      30.0%            450,000                                                                                            40%
                                                                                                                                      20.0%
                                  50,000
                                                                                                                                                       400,000
                                                                                                                                      10.0%
                                      0                                                                                               0.0%                                                                                                                35%
                                                                                                                                                       350,000
                                           Q1-16
                                                   Q3-16
                                                           Q1-17
                                                                   Q3-17
                                                                           Q1-18
                                                                                    Q3-18
                                                                                             Q1-19
                                                                                                     Q3-19
                                                                                                             Q1-20
                                                                                                                     Q3-20
                                                                                                                              Q1-21
                                                                                                                                                       300,000
                                    Indonesia                      Other countries                                   Market share %                                                                                                                       30%
                                                                                                                                                       250,000

                                                                                                                                              tonnes
                                                                                                                                                       200,000
                                                                                                                                                                                                                                                          25%
                                      Cold rolled imports & market share
                                                                                                                                                       150,000

                                                                                                                                                       100,000
                                 300,000                                                                                              40.0%                                                                                                               20%
       Cold rolled (t)

                                                                                                                                      30.0%             50,000
                                 200,000
                                                                                                                                      20.0%
                                                                                                                                                            0                                                                                             15%
                                 100,000

                                                                                                                                                                 Q1-16
                                                                                                                                                                         Q3-16
                                                                                                                                                                                 Q1-17
                                                                                                                                                                                         Q3-17
                                                                                                                                                                                                 Q1-18
                                                                                                                                                                                                         Q3-18
                                                                                                                                                                                                                 Q1-19
                                                                                                                                                                                                                         Q3-19
                                                                                                                                                                                                                                 Q1-20
                                                                                                                                                                                                                                          Q3-20
                                                                                                                                                                                                                                                  Q1-21
                                                                                                                                      10.0%

                                      0                                                                                               0.0%
                                                                                                                                                         Indonesia & India                           All other                           Market share %
                                           Q1-16
                                                   Q3-16
                                                           Q1-17
                                                                   Q3-17
                                                                           Q1-18
                                                                                     Q3-18
                                                                                             Q1-19
                                                                                                     Q3-19
                                                                                                             Q1-20
                                                                                                                      Q3-20
                                                                                                                              Q1-21

                                   Indonesia & India                               All other                         Market share %

SS Hot Rolled products have one global quota. Countries with a SS CR quota: S. Korea, Taiwan, India, USA, Turkey, Malaysia, Vietnam. All other countries if not exempt fall
under the residual quota                                                                                                                                                                                                                                        51
Stainless & Electrical Steel
South America

                               52
Business overview
S&E Steel South America: A flexible, agile and highly
profitable asset
   A significant adj EBITDA contributor 2020 despite
                                                                       Earnings reflect weak domestic economic environment
                 demanding conditions

                                                                                                17%     19%                       17%            17%
                                                                                       13%                      14%       13%            13%
                  12%
                                                                                                        176
                                                                                                167                               162
                                                      S&E Europe              8%
                                 33%
            14%
                                                      S&E S. America                   120                                                       126
                                                                                                                113        118
                                                                                                                                         109
                                                      A&S
                                                      S&S                      82
                   41%                                                        2012 2013 2014 2015 2016 2017 2018 2019 2020
                                                                                        Adj. EBITDA (m€)                Adj. EBITDA margin (%)

                                                                          Weak economic growth continues to weigh on
  Stable shipments due to mix of domestic and exports
                                                                              stainless steel consumption in Brazil

                                                                       0.45
                                                                                                                            Pre-crisis level (2014)
                                                                       0.40

                                                                       0.35

           649    654      652    656    638    656                    0.30
     617                                               610     591
                                                                       0.25

                                                                       0.20
                                                                                2012

                                                                                         2013

                                                                                                 2014

                                                                                                         2015

                                                                                                                 2016

                                                                                                                           2017

                                                                                                                                  2018

                                                                                                                                          2019

                                                                                                                                                 2020
    2012 2013 2014 2015 2016 2017 2018 2019 2020
                        Brazil S&E shipments (kt)                                   Stainless BRA ap. consumption (mt - slab equivalent)

                                                                                                                                                        53
Business overview
S&E Steel South America: Our Brazil asset is unique – flexibly
switches between products and markets to maximize profitability
       Aperam South America footprint                                            Mix²                                             Upstream integration

                                                                             Exports                        Raw material:

                                                                                                                               Cost competitive & CO2 neutral
                                                                       Domestic
                           Caracas                                                                          Bio Energia        charcoal from our FSC certified
                           (Venezuela)                                 Business
                                                                   (incl S. America)
                                                                                                                               forests heats the blast furnace
     Colombia

   Ecuador                                                                                                  Product range:

         Peru
                               Timoteo                                                                                         Complete stainless steel range
                                                                                                            Stainless Steel
                           Sumaré                                                                                              austenitic, ferritic, duplex, martensitic
                        Campinas
                                      Ribeirão Pires
                                       Caxias do Sul

                                                                                         Declining margin
                                      Montevideo (Uruguay)
                                                                     Timoteo melt shop                                         used eg in stationary machines and
                                                                       ~900kt capacity
                                  Buenos Aires (Argentina)                                                  Grain oriented
                                                                                                                               transformers due to its magnetic
                                                                                                            electrical steel
                                                                                                                               properties*

                                                                                                            Non grain
                                                                                                                               used in electric motors and
                                                                                                            oriented
                                                                                                                               generators**
                Melt shop, Hot/Cold rolling                                                                 electrical steel
                Service Centers
                Tubes mills and Cutting centers
                                                                                                                               High or medium alloyed & other
                Rep offices, sales agencies                                                                 Special carbon
                                                                                                                               specialties complete the product
                                                                                                            steel
                                                                                                                               portfolio

                  Sustained solid double digit adj EBITDA margin proves the flexibility & agility
                                           of our operations in Brazil
*Grain oriented steel (GO & HGO) has the magnetic properties optimized in one direction during hot rolling. **Non-grain oriented steel (NGO) has identical magnetic properties
in all directions ²schematic only                                                                                                                                                54
Business overview
S&E Steel South America: Brazil offers ample opportunity
for both cyclical and structural growth
  Brazil consumes substantially below the global trend line                                                                                       Brazil opportunities

                                                                                                                          Short term: reviving the economy. Large scale infrastructure &
                                                                                                                           energy projects have been missing + Aperam LJ4 growth strategy
                                                                                                                           with investment into high margin products (HGO)
                                                                                              China
                                                   10
                                                                                                                          Medium term: Tax reform that put our customers in a position to
        Stainless CR consumption per capita (kg)

                                                                                                                           compete on a global level will drive volume and yield a positive
                                                                                                                           mix effect
                                                    8
                                                                                                                          Long term: Higher standard of living will drive stainless steel
                                                                                                                Poland     consumption. Currently Brazil at 1.4kg / capita vs China
                                                                                                                EU
                                                    6           Vi etnam
                                                                                                                           >9kg/capita and a GDP implied consumption of >3.5kg/capita
                                                                            Asia
                                                                                                                         Examples of stainless steel solutions in the Agrobusiness:
                                                                                    Thailand
                                                    4                                   Turkey World
                                                                                                       N Ameri ca
                                                                                               Ma laysia

                                                                    S. Afri ca
                                                    2         India         S.E Asia
                                                               S. Asia                   BrazilMexi co                     Equipment for the         Equipment for         Slats of metallic
                                                                        Indonesia                Russia
                                                             Egypt                    L America         Romania              transport and           washing gases         conveyor belt for
                                                                     Ukraine Iran Argentina          Mi ddle East         sterilization of Palm      from biomass           the transport of
                                                    0        Africa
                                                                                                                                   fruits               burning               sugarcane
                                                     1,000              6,000               11,000             16,000
                                                                           GDP per capita (USD)                           Largest global producer of:         Largest global exporter of:
                                                                                                                          • Coffee       Orange               • Meat         Poultry
                                                                                                                          • Sugarcane and sugar               • Sugar        Ethanol

                                                                      Brazil has tremendous potential for volume & mix improvement
Source: IMF, CRU, Aperam
                                                                                                                                                                                               55
Business overview
S&E Steel South America: 3 pillars of trade protection
against unfair market behavior
                     Import duty                                    Logistics                              Anti dumping duty

                                                                                                Anti dumping duties:

                                                                                                Stainless flat products:
                                                                                                • China: up to USD629/t, Taiwan up to
                                                                                                   USD705/t since 4.10.19 for 5 years
                                                                      Brazil           EU 28    Stainless steel welded tubes:
                                                                                                • China & Taiwan: up to USD911/t
                                                 Area (mn km2)         8.51     -45%    4.66       since 29.07.13 for 5 years. Renewal
                                                 Consumption (kt)      270      x12     3,355      investigation launched 16.07.18
                                                                                                •   Malaysia, Thailand and Vietnam:
                                                 •   Costly & time consuming transportation         USD367/t up to USD888/t
                                                     by truck only                                  since 13.06.18, for 5 years
  General import duty:
                                                                                                Electrical steel (non grain oriented):
  •   14% import duty on all stainless steel     •   Aperam has the most comprehensive          • China, South Korea, Taiwan, Germany:
      imports irrespective of origin                 network of service centers and agents in      USD90/t – USD166.3/t
                                                     South America                                 since 15.07.19 for 5 years

                                  Tariff measures to support fair market environment in Brazil
Sources: SBB/Platts, Steelfirst
                                                                                                                                         56
Services & Solutions

                       57
Business overview
Services & Solutions: stronger partnership with customers
enhances margins
 A significant adj EBITDA contributor 2020 despite trough             A profitable Services & Solutions thanks to its focus on
                        conditions                                                  service oriented customers

                                                                        100                                                               19,000
                                                                         80                                                               17,000
                  12%
                                                                                                         83                               15,000
                                                     S&E Europe          60                65
                                33%                                                                            70
            14%
                                                     S&E S. America                                                                       13,000
                                                                         40
                                                                                                                      43   45             11,000
                                                     A&S                                         38                              38
                                                                         20                                                               9,000
                                                     S&S                        16
                                                                          0            7                                                  7,000
                    41%
                                                                              2012 2013 2014 2015 2016 2017 2018 2019 2020
                                                                                       EBITDA €m                      Nickel LME price

  Increasing focus on downstream value added services                 A majority of “in house“ exposure to end users to best
                      and solutions                                   serve their needs and provide best services & solutions

                                                                                                Direct distribution
                                      818      819                             Apera
                                799                                              m
                  721     746                                                  Aperam                                             End
           679                                       706                      Stainle
                                                                              Stainless
     661                                                     646                ss&&                     Aperam                     -
                                                                                                                                  End-
                                                                                                        Services &
                                                                                                                                  user
                                                                                                                                  users
                                                                                                        Solutions
                                                                              Electrical
                                                                              Electric                                              s
                                                                                Steel
     2012 2013 2014 2015 2016 2017 2018 2019 2020                                al
                                                                               Steel                  Independent
                                                                                                       distributors
                          S&S shipments (kt)                                                            and other

                                                                                                                                                   58
Business overview
Services & Solutions: Adding value downstream

                                           Services & Solutions value chain

       Input           - - - - - - - - Service Centers - - - - - - - -

   Hot rolled coil /         Cutting/           Polishing
                                                                       Packaging     Logistics   Customer
   Cold rolled coil          Slitting           Brushing

                                                Slit /      Machined
                             &      Slit
                                                deburred    deburred      Square   Round

                           - - - - - - - Tube making - - - - - - -
                            Forming
                                               Expanding
   Hot rolled coil /        Welding
                                               Cutting             Packaging       Logistics     Customer
   Cold rolled coil         Pickling
                                               Bending
                           Annealing

                                                                                                            59
Alloys & Specialties

                       60
Business overview
Alloys & Specialties: attractive niche market with high margins

                                                                         High profitability due to end products & end user
            Aperam’s high value-added segment 2020
                                                                                             orientation

                                                                                                                                               1,407 1,278 1,385 1,456
                                                                           1,191 1,219 1,264 1,147
                       12%                                                                                                         864                                           50
                                                        S&E Europe             43       44                44                                         46            46                          45
                                   33%                                                                                   39
                 14%
                                                        S&E S. America
                                                                                                                                       26
                                                        A&S
                                                        S&S
                        41%                                                2012 2013 2014 2015 2016 2017 2018 2019 2020
                                                                                            Adj. EBITDA (m€)                                          Adj. EBITDA/t

          Stable shipments but markedly improved mix                     Nickel Alloys a growing and premium niche market

                                                                               400
                                                                               350
                                                                                                                  CAGR 2.2% pa
                                                                               300
                                                                               250
          36    36     35     34           33      36     36              kt   200
                                    30                           31
                                                                               150
                                                                               100
                                                                                50
        2012 2013 2014 2015 2016 2017 2018 2019 2020                             0
                                                                                     1990
                                                                                            1992
                                                                                                   1994
                                                                                                           1996
                                                                                                                  1998
                                                                                                                         2000
                                                                                                                                2002
                                                                                                                                       2004
                                                                                                                                              2006
                                                                                                                                                     2008
                                                                                                                                                            2010
                                                                                                                                                                   2012
                                                                                                                                                                          2014
                                                                                                                                                                                 2016
                                                                                                                                                                                        2018
                                                                                                                                                                                               2020
                              A&S shipments (kt)

Source: SMR, Aperam
                                                                                                                                                                                                      61
Business overview
Alloys & Specialties: attractive niche market with high margins

           Aperam is a global top player in nickel alloys
                                                                                      Aperam Alloys & Specialties geographical footprint
                and strong in long products (kt)
                                                                                              Rescal                   Amilly

                                                                                                                                                       Imhua
                                                                                              Wire                     The magnetic parts
                                                                                              drawing                  company
                                                                                                        n
                                                                                                         n
                                                                                                       nnn
                                                                                                       n
                                                                                                                                                       n
                                                                                                                                          n
                                                                                                   Imphy
                                                                                                                                            ICS (JV)

                                                                                                Melt shop, wire rod mill,                 Diversification into
                                                                                                cold rolling, bars, R&D                   industrial clads

            Alloys & Specialties sales by industry 2020

                                                                                                             Major products
                                                 Marine                                Wire rod ~45%     Plates ~5%         Strips ~40%         Bars ~10%

                                                                         Upstream
                         6%                      Oil & Gas
                   14%             28%
                                                 Chemical industry /
                                                 welding / environment
                 6%                              Aerospace

                                                 E&E
                                                                         Downstream

                   16%
                               29%               Automotive /
                                                 Transportation
                                                 Others

Source: SMR, Aperam
*PCC (Special Metals) NYK (Nippon Yakin Kogyo)                                                                                                                 62
Business overview
Alloys & Specialties: Specialty alloys add stability and
profitable growth element
    Innovation is key for premium                …to cater for highly sophisticated                     …yielding growth opportunities and
            specialties…                              and evolving needs…                                        margin stability

          R&D intensive industry                 High growth end market applications                     Less exposed to commodity cycles

 Intensive technical effort required to         “Kilogram” market: unique products                    Cost of raw materials passed through to
   market new products                            designed to enable precision and high-                  customers
 Benchmark customers in advanced                 tech solutions globally                               Long-standing client relationships
   industries require tailored, certified and    Highly diversified end-markets                        Good visibility on volumes with high
   highly sophisticated solutions                                                                         proportion of recurring revenue

 Key R&D figures (based on 2019)                 Key end-markets / application types                    EBITDA margins by Aperam division
                                                                                                        14%
                                                               Heating                                  12%
                                                                             LNG tankers,
                                                               resistance,   special welding            10%
    Cooperation contracts                26                    watches                                   8%
                                                      Gearbox,                                           6%
                                                      fasteners,                       Gas turbines,
                                                      turbo
                                                                                                         4%
    Total registered patents           341            chargers
                                                                                       heat
                                                                                       exchangers
                                                                                                         2%
                                                                                                         0%
                                                          Smart

                                                                                                              2010
                                                                                                                     2011

                                                                                                                                                 2015
                                                                                                                                                        2016

                                                                                                                                                                                    2020
                                                                                                                            2012
                                                                                                                                   2013
                                                                                                                                          2014

                                                                                                                                                               2017
                                                                                                                                                                      2018
                                                                                                                                                                             2019
   Sales of new products               14%                phones,                  Fasteners,
                                                          LED TV,                  landing gears,
                                                                      Electrical
                                                          seals                    turbine                             S&S                   A&S                      S&E
                                                                      safety,
                                                                                   engines
                                                                      sensors

                                     A very profitable, growing and stable niche market

                                                                                                                                                                                           63
Appendix

                                                                                           64
                                     Résidence Hôtelière du Rail, Montparnasse station, Paris - France
           - aasb_agence d‘architecture suzelbrout - Executed using grade 304L, with Uginox Mat finish
Appendix
Key prices and exchange rates

                                       Nickel                                                          Nickel pig iron                                                         Stainless scrap

     21,000                                                                       220                                                                      1,900
     19,000                                                                       200                                                                      1,700
     17,000                                                                       180                                                                      1,500
     15,000                                                                       160                                                                      1,300
     13,000                                                                       140                                                                      1,100
     11,000                                                                       120                                                                        900
      9,000                                                                       100                                                                        700
                 Jan 19

                              Jul 19

                                           Jan 20

                                                      Jul 20

                                                                Jan 21

                                                                         Jul 21

                                                                                        Jan 19

                                                                                                       Jul 19

                                                                                                                    Jan 20

                                                                                                                               Jul 20

                                                                                                                                         Jan 21

                                                                                                                                                  Jul 21

                                                                                                                                                                      Jan 19

                                                                                                                                                                                  Jul 19

                                                                                                                                                                                               Jan 20

                                                                                                                                                                                                          Jul 20

                                                                                                                                                                                                                    Jan 21

                                                                                                                                                                                                                             Jul 21
                                   Nickel LME (USD/t)                                                           NPI 10-15% (USD/unit)                                                   EU 18/8 scrap (USD/t)

                           Ferrochrome                                                               Stainless steel 304                                                                BRL / USD

     2.25                                                                         5,000                                                                    6.00
     2.00                                                                         4,000                                                                    5.50
     1.75                                                                         3,000                                                                    5.00
     1.50
                                                                                  2,000                                                                    4.50
     1.25
                                                                                  1,000                                                                    4.00
     1.00
                                                                                            Jan 19

                                                                                                          Jul 19

                                                                                                                      Jan 20

                                                                                                                                Jul 20

                                                                                                                                         Jan 21

                                                                                                                                                  Jul 21
     0.75                                                                                                                                                  3.50

                                                                                                                                                                  Jan 19

                                                                                                                                                                               Jul 19

                                                                                                                                                                                            Jan 20

                                                                                                                                                                                                        Jul 20

                                                                                                                                                                                                                   Jan 21

                                                                                                                                                                                                                             Jul 21
            Jan 19

                          Jul 19

                                        Jan 20

                                                    Jul 20

                                                               Jan 21

                                                                         Jul 21

                                                                                                                CR304 Europe (USD/t)
                          EU FeCr benchmark (USD/lb)                                                            CR304 Asia (USD/t)                                                              BRL/USD

Source: Bloomberg, Fastmarkets
                                                                                                                                                                                                                                      65
Appendix
Key stainless product categories by alloy content

                  Martensitic                                  Ferritic (400 series)                             Austenitic (300 series)
You can also read