Q2 2021 Earnings Conference Call - NASDAQ: EQIX Presented on July 28, 2021 - Equinix Investor Relations
←
→
Page content transcription
If your browser does not render page correctly, please read the page content below
Q2 2021 Earnings
Conference Call
NASDAQ: EQIX
Presented on July 28, 2021
© 2021 Equinix.com 1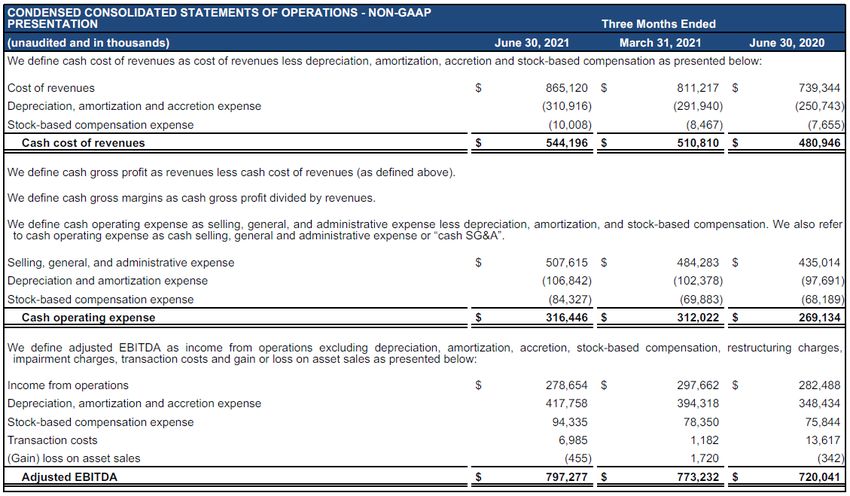
Public Disclosure Statement
Forward-Looking Statements
Except for historical information, this presentation contains forward-looking statements which include words such as “believe,” “anticipate,”
and “expect”. These forward-looking statements involve risks and uncertainties that may cause Equinix’s actual results to differ materially
from the expectations discussed in such forward-looking statements. Factors that might cause such differences include, but are not limited
to, risks to our business and operating results related to the COVID-19 pandemic, the challenges of acquiring, operating and constructing
IBX data centers and developing, deploying and delivering Equinix products and solutions; unanticipated costs or difficulties relating to the
integration of companies we have acquired or will acquire into Equinix; a failure to receive significant revenues from customers in recently
built-out or acquired data centers; failure to complete any financing arrangements contemplated from time to time; competition from
existing and new competitors; the ability to generate sufficient cash flow or otherwise obtain funds to repay new or outstanding
indebtedness; the loss or decline in business from our key customers; risks related to our taxation as a REIT and other risks described
from time to time in Equinix filings with the Securities and Exchange Commission. Refer to our annual report on Form 10-K filed with the
SEC on February 19, 2021 and our upcoming quarterly report on Form 10-Q. In addition, the COVID-19 pandemic and the global
economic climate may amplify many of the risks described above and in our filings. Equinix does not assume any obligation to update the
forward-looking information contained in this presentation.
Non-GAAP Information
This presentation contains references to certain non-GAAP financial measures. For definitions of terms including, but not limited to, “Cash
Gross Profit,” “Cash Gross Margins,” “Cash SG&A,” “Adjusted EBITDA,” “Funds From Operations,” “Adjusted Funds From Operations,”
and “Adjusted Net Operating Income,” and a detailed reconciliation between the non-GAAP financial results presented in this presentation
and the corresponding GAAP measures, please refer to the supplemental data and the appendix of this presentation.
© 2021 Equinix.com 2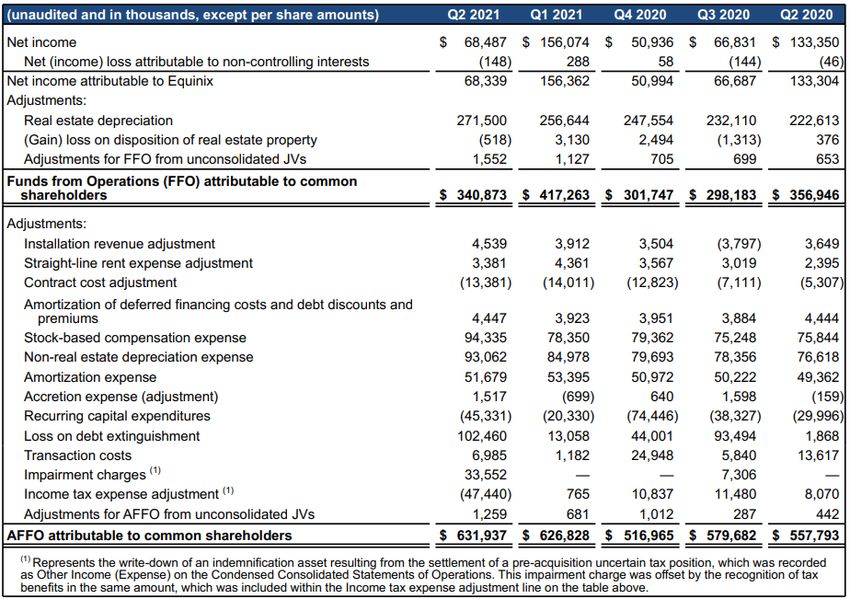
Q2 2021 Financial Highlights
Revenues Recurring Revenues Non-recurring Revenues
Revenues Growth
Q2 21
($M) $1,596 $1,658 QoQ YoY
$1,520 $1,564
$1,470
As-reported 4% 13%
Normalized and (1)
4% 8%
$1,432 $1,466 $1,511 $1,542 Constant Currency
$1,398
(1)
Normalized MRR 2% 6%
Q2 20 Q3 20 Q4 20 Q1 21 Q2 21 Adjusted EBITDA Q2 21
Growth QoQ YoY
Adjusted EBITDA & AFFO
As-reported 3% 11%
$6.35 $6.48 $5.76 $6.98 $7.01 AFFO per Share (Diluted)
Normalized and (1)
Adjusted EBITDA AFFO
3% 7%
Constant Currency
$773 $797
$720 $737 $711
Q2 21
Adjusted EBITDA
AFFO Growth
QoQ YoY
margin of 48.1%
or 48.3% As-reported 1% 13%
$558 $580 $627 $632 excluding
$517
integration costs Normalized and
(1) 1% 10%
Constant Currency
Q2 20 Q3 20 Q4 20 Q1 21 Q2 21
Delivered our 74th quarter of consecutive revenue growth with record bookings in Q2 2021 and healthy interconnection
activity benefiting from our global reach and interconnected ecosystems
(1) Revenues and adjusted EBITDA normalized for acquisitions, integration costs related to acquisitions and other adjustments. Normalized MRR excludes non-recurring revenues. AFFO normalized for the incremental net interest expense related to acquisition
financing and other gains and losses. Constant currency assumes average currency rates used in our financial results remained the same over the comparative periods and removes the impact of gains or losses related to balance sheet remeasurement
© 2021 Equinix.com 3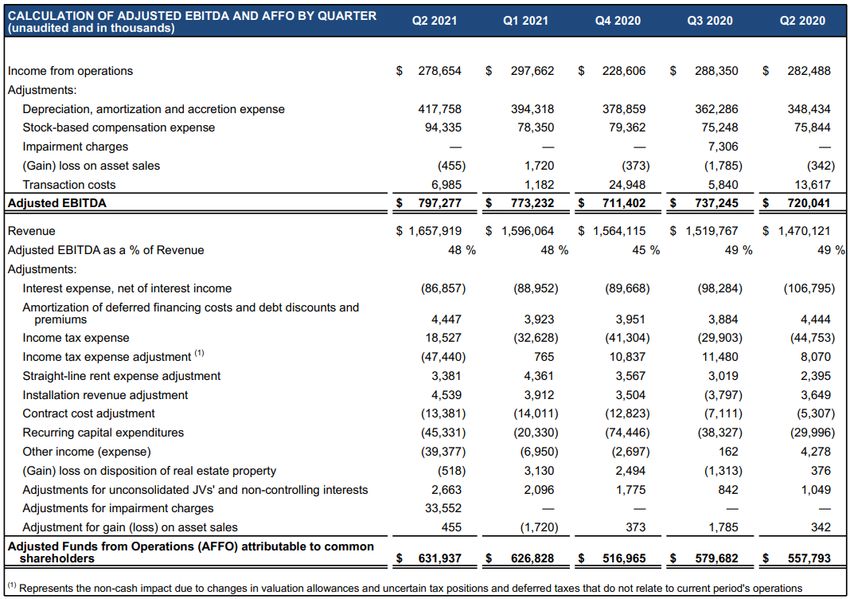
Q2 2021 Consolidated Results
$M except for AFFO per Share and Q2 21
Non-Financial Metrics Guidance Actual QoQ YoY
Revenues (1) $1,630 - 1,660 $1,658 4% 13%
Cash Gross Profit $1,114 3% 13%
Cash Gross Margin % 67.2%
Cash SG&A $316 1% 18%
Cash SG&A % 19.1%
(2)
Adjusted EBITDA $769 - 789 $797 3% 11%
Adjusted EBITDA Margin % ~47% 48.1%
Net Income $68 -56% -49% Impact of loss on
debt extinguishment
Net Income Margin % 4.1%
Adjusted Funds from Operations (AFFO) $632 1% 13%
AFFO per Share (Diluted) $7.01 1% 11%
Recurring Capital Expenditures $40 - 50 $45 123% 51%
(3)
Cabs Billing 253,100 2% 5%
(3)(4)
MRR per Cab $1,941 0% 3%
(3)
Total Interconnections 406,600 2% 8%
(1) Q2 21 Actual includes a negative impact of approximately $3 million when compared to Q1 21 average FX rates, a benefit of approximately $11 million when compared to our prior FX guidance rates, and a benefit of approximately $34 million when compared to
Q2 20 average FX rates, including the net effect from our hedging transactions
(2) Q2 21 Actual includes a negative impact of approximately $1 million when compared to Q1 21 average FX rates, a benefit of approximately $6 million when compared to our prior FX guidance rates, and a benefit of approximately $17 million when compared to
Q2 20 average FX rates, including the net effect from our hedging transactions
(3) All non-financial metrics exclude assets sold to the APAC and EMEA xScale JVs, and assets acquired from Axtel, Bell Canada and Packet
(4) MRR per Cab excludes Axtel, Bell Canada assets, Bit-isle MIS, Brazil, Colombia, APAC and EMEA xScale JVs, JV fee income, Infomart non-IBX tenant income and Packet. MRR per Cab up $14 QoQ on a constant currency basis. Constant currency basis
assumes average currency rates used in our financial results remained the same over the comparative periods
© 2021 Equinix.com 4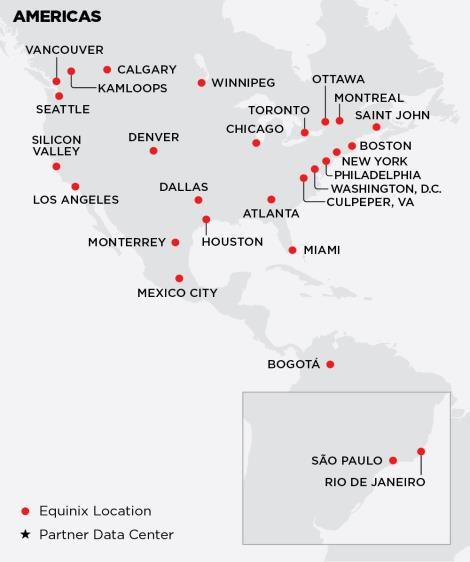
Americas Performance
Revenues Organic Revenues Bell
$726
$751 Q2 21
($M) $712 Revenues Growth
$661 $672 $32
$36 QoQ YoY
$28
As-reported 3% 13%
Normalized and (1)
3% 8%
Constant Currency
$684 $694 $715
(1)
Normalized MRR 2% 6%
Adjusted EBITDA Q2 21
Q2 20 Q3 20 Q4 20 Q1 21 Q2 21
Growth QoQ (3) YoY
Adjusted EBITDA Adjusted EBITDA Adjusted EBITDA Margin As-reported 5% 8%
$302 $344 $326
$291 $300 Normalized and (1)
6% 3%
Constant Currency
(4)
47.5% (2)
45.7% Cross-connects Cabs Billing MRR per Cab Utilization
43.2% 43.4%
42.1%
167,100 90,400 $2,423 73%
1% QoQ 2% QoQ Constant Currency
QoQ $4
As-reported QoQ $3
Q2 20 Q3 20 Q4 20 Q1 21 Q2 21
(1) Constant currency assumes average currency rates used in our financial results remained the same over the comparative periods. Normalized for acquisitions and integration costs related to acquisitions. Normalized MRR excludes non-recurring revenues
(2) MRR per Cab excludes Axtel, Bell Canada assets, Brazil, Colombia, Infomart non-IBX tenant income and Packet
(3) Reflects increased utilities expense and higher R&M spend
(4) Includes favorable revenue mix and lower utilities
© 2021 Equinix.com 5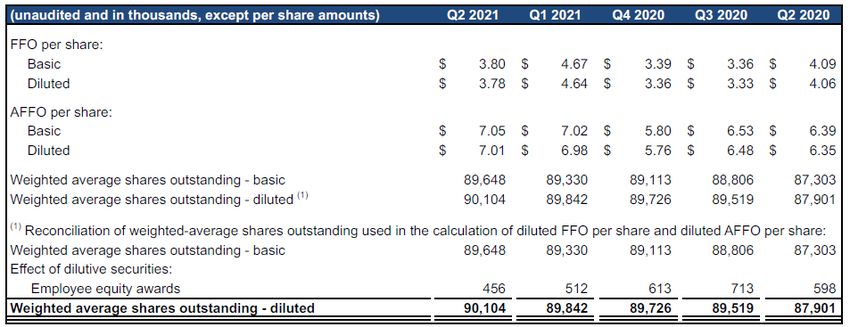
EMEA Performance
Revenues
Revenues Q2 21
($M) $538
$518 $511 $519 Growth QoQ YoY
$488
As-reported 4% 10%
Normalized and (1)
4% 8%
Constant Currency
(1)
Normalized MRR 3% 5%
Adjusted EBITDA Q2 21
Growth QoQ YoY
Q2 20 Q3 20 Q4 20 Q1 21 Q2 21
As-reported 8% 8%
Adjusted EBITDA Adjusted EBITDA Adjusted EBITDA Margin
Normalized and (1)
$263
8% 5%
$263 Constant Currency
$244 $244
$237
(2)
Cross-connects Cabs Billing MRR per Cab Utilization
49.9% 50.8% 135,800 106,200 $1,564 83%
48.8%
46.4% 47.0% 2% QoQ 1% QoQ Constant Currency
QoQ $19
As-Reported QoQ $13
Q2 20 Q3 20 Q4 20 Q1 21 Q2 21
(1) Constant currency assumes average currency rates used in our financial results remained the same over the comparative periods. Normalized for integration costs related to acquisitions and other adjustments. Normalized MRR excludes non-recurring
revenues
(2) MRR per Cab excludes EMEA xScale JV fee income
© 2021 Equinix.com 6
Asia-Pacific Performance
Revenues Revenues Q2 21
($M) $369
$341 $351 Growth QoQ YoY
$321 $329
As-reported 5% 15%
Normalized and (1)
6% 11%
Constant Currency
(1)
Normalized MRR 3% 9%
Adjusted EBITDA Q2 21
Growth QoQ YoY
Q2 20 Q3 20 Q4 20 Q1 21 Q2 21
Adjusted EBITDA Adjusted EBITDA Adjusted EBITDA Margin As-reported 13% 20%
$209 Normalized and (1)
13% 15%
$185
Constant Currency
$174 $183 $174
(2)
54.4% 55.7%
52.7%
56.5% Cross-connects Cabs Billing MRR per Cab Utilization
51.2%
70,500 56,500 $1,937 82%
2% QoQ 2% QoQ Constant Currency
QoQ $23
As-reported QoQ $7
Q2 20 Q3 20 Q4 20 Q1 21 Q2 21
(1) Constant currency assumes average currency rates used in our financial results remained the same over the comparative periods. Normalized for integration costs related to acquisitions. Normalized MRR excludes non-recurring revenues
(2) MRR per Cab excludes Bit-isle MIS and APAC xScale JV fee income
© 2021 Equinix.com 7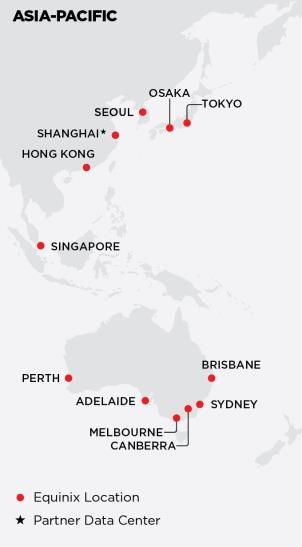
Capital Structure Available Liquidity
(1)(2)
In April, S&P and Fitch each raised Equinix’s credit ratings to BBB
$3.7B
Recent Capital Markets Activity Ratings
• Redeemed $1.25B of legacy high yield Senior Notes and repaid SEK 2.4B TLA and ¥41.6B TLA Baa3 / BBB / BBB
with proceeds from the issuance of $2.6B Senior Notes, which included $1B of Green Notes (1)
Net Leverage Ratio
• Raised $100M in proceeds in Q2 under our ATM program
3.8x
(1)(3)
($M) (1)(3)(4) Total Gross Debt
Debt Maturity Profile
$2,561 $11.8B
(1)
Green Notes
$3.7B
(1)(3)(5)
$1,200
$1,300
$1,200 Blended Borrowing Rate
$1,093 $1,050 $1,100
$1,000 $1,000
$
1.72%
$561
€ $
$711
(1)(3)
$500 $500 $500 Weighted Average Maturity
$
£ €
$17 9.6 years
(1)(3)
2021 2022 2023 2024 2025 2026 2027 2028 2029 2030 2031 2032 2033 2050 2051 2052 Unsecured Debt
GBP TLA USD Senior Notes Green Senior Notes Undrawn Revolver
99%
(1)(3)
(1)
(2)
Based on balances as of June 30, 2021
Includes cash, cash equivalents and undrawn revolver amount; excludes restricted cash and outstanding balance of letters of credit
Fixed Rate Debt
(3) Excludes finance and operating leases
(4)
(5)
Excludes mortgage payable and other loans payable
Includes the impact of cross-currency swaps
95%
© 2021 Equinix.com 8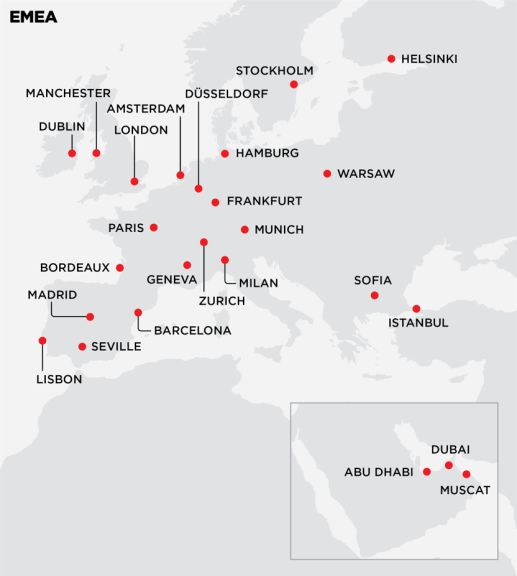
$196M Annual Interest Savings Achieved from IG Refinancings
Debt Refinancing Nov 2019 Jun 2020 Sept 2020 Feb 2021 May 2021 Total
Issued $1.85B $2.6B $11.2B
$2.8B $2.6B €1.1B
(Green Portion) ($1.35B) ($1.0B) ($3.7B)
Redeemed $2.25B $2.45B €1.5B €0.5B $1.9B $9.0B
WAC(1)(2)
Redeemed Notes → New Notes 5.46% → 2.93% 4.05% → 1.89% 2.875% → 0.91% 2.875% → 0.66% 3.93% → 2.09% 1.72%
WAM(1)
Redeemed Notes→ New Notes 3.4 yrs → 7.6 yrs 3.9 yrs → 12.3 yrs 5.1 yrs → 12.9 yrs 4.9 yrs → 9.3 yrs 4.5 yrs → 12.0 yrs 9.6 yrs
Annual Interest
$58M $53M $35M $13M $37M $196M
Savings(2)(3)
4.13%
$196M
3.27%
2.64% $37M
2.29% $13M
$35M
2.06%
$53M 1.72% 1.72%
$58M
Sep Nov Jun Sep Feb May Total
2019 2019 2020 2020 2021 2021
(2)(3) (2)
Annual Interest Savings ($M) Blended Borrowing Rate
(1) Represents respective deal Weighted Average Coupon (WAC) and Weighted Average Maturity (WAM); Total column represents corporate WAC and WAM as of Q2 21
(2) Includes the impact of cross currency swaps, with exception to the blended borrowing rate at Sep 2019. Blended borrowing rates are as of respective quarter end
(3) Represents savings generated from refinanced debt
© 2021 Equinix.com 9
Capital Expenditures
Recurring Capital Expenditures
4.8%
($M)
• Recurring capital expenditures have
$74
10%
historically trended between 2% and 5% of
5% 2.7% revenues, annually
2.5%
2.1% $45
$38 17% • Maintenance capital expenditures can vary by
$30 12% 1.3% 17%
23%
15% 85%
$20
quarter based on maintenance schedules and
15% 23% payment terms
73% 15% 66%
62% 61%
Q2 20 Q3 20 Q4 20 Q1 21 Q2 21
Installation Sustaining IT & Network Maintenance % of Revenues
Non-recurring Capital Expenditures • Opened Bordeaux, Helsinki and Silicon Valley
$760 since our last earnings call
$647
30% • ~70% of expansion cabinets are in metros that
$527 $543
28% generate >$100M of annual revenues,
$452 13% 22%
leveraging established ecosystem density and
22% 40%
46% 42%
37% installed customer base
42%
41% 30% 36% 34%
36%
Q2 20 Q3 20 Q4 20 Q1 21 Q2 21
APAC EMEA AMER
© 2021 Equinix.com 10(1) (2)
Stabilized IBX Growth
Stabilized, Expansion & New IBXs Stabilized IBX Profitability ($M)
Last Quarter
$12,129 $4,687 $3,230 $93
Reported
# of IBXs Q2 21 Revenues ($M)
27% annual Cash Gross
Expansion: Profit on Gross PP&E
20%
(3) investment (5)
Growth YoY
Stabilized:
Stabilized:
212 86%
Utilized
3%(3)(6)
Growth
YoY
(4)
(1) Reference appendix for IBX definitions of Stabilized, Expansion and New
(2) Excludes Packet acquisition, Bell Canada assets, Infomart non-IBX tenant income, non-IBX assets, APAC and EMEA xScale JVs
(3) YoY growth on a constant currency basis assumes average currency rates used in our financial results remained the same over the comparative periods
(4) Includes real estate acquisition costs, finance leases and all capital expenditures associated with stabilized IBXs since opening
(5) Cash generation on gross investment calculated as trailing four quarters as-reported cash gross profit divided by Gross PP&E as of Q2 21
(6) Stabilized total revenues growth YoY is 5% on an as-reported basis
© 2021 Equinix.com 11(1)
2021 Financial Guidance
($M except AFFO per Share) FY 2021 Q3 2021
(3)
(2)
Revenues $6,619 - 6,659 $1,668 - 1,688
(4) (5)
Adjusted EBITDA $3,108 - 3,148 $766 - 786
Adjusted EBITDA Margin % ~47% 46 - 47%
Recurring Capital Expenditures $188 - 198 $50 - 60
% of revenues ~3% 3 - 4%
(6)
Non-recurring Capital Expenditures (includes $2,550 - 2,790
xScale)
(7)
AFFO $2,434 - 2,474
(7)
AFFO per Share (Diluted) $26.92 - 27.36
Expected Cash Dividends ~$1,030
(1) Excludes the announced GPX India acquisition, which is expected to close in Q3 21. Guidance includes the expected results of Joint Ventures (“JVs”) we expect to close in 2021
(2) Guidance includes a positive foreign currency benefit of approximately $25M compared to Q2 21 FX guidance rates, including the net effect from our hedging transactions
(3) Guidance includes a positive foreign currency benefit of approximately $7M compared to Q2 21 FX guidance rates and a negative foreign currency impact of approximately $6M compared to Q2 21 average FX rates, including the net effect from our hedging
transactions
(4) Guidance includes a positive foreign currency benefit of approximately $11M compared to Q2 21 FX guidance rates, including the net effect from our hedging transactions and $25M of estimated integration costs related to acquisitions
(5) Guidance includes a positive foreign currency benefit of approximately $3M compared to Q2 21 FX guidance rates and a negative foreign currency impact of approximately $4M compared to Q2 21 average FX rates, including the net effect from our hedging
transactions and $7M of estimated integration costs related to acquisitions
(6) Includes xScale non-recurring capital expenditures guidance of $425 - 475M which we anticipate will be reimbursed from both the current and future xScale JVs
(7) Includes $25M of estimated integration costs related to acquisitions. Guidance excludes any potential financing the Company may undertake in the future
© 2021 Equinix.com 12FY21 Guidance (2)
Revenues Adjusted EBITDA
Raise full year revenues guidance by $50M Raise full year adjusted EBITDA guidance by $27M
47.1% As-reported Margin 47.1%
($M)
Normalized (1) Margin excl. Integration 47.5%
~8% 47.5%
Constant Currency Costs
YoY Growth
$6,619 - 6,659 $3,133 - 3,173
25 11
25
$3,101 - 3,161 11
25 $3,108 - 3,148
$6,559 - 6,619
Prior Guidance FX Guidance FY21 Guidance Prior Guidance FX Guidance FY21 Integration FY21 Guidance
Adjustment ex. Integration Adjustment Guidance excl. Costs
Costs Integration
Costs
Integration cost guidance
Prior Full Year Guidance ($30M)
Guidance Adjustment +$5M
Total Integration Costs ($25M)
(1) FY20 normalized for the acquisitions of Axtel, Packet, and Bell Canada and a positive foreign currency benefit of approximately $45M between December 31, 2020 spot rates and FY20 average FX rates
(2) Includes integration costs of $25M related to acquisitions
© 2021 Equinix.com 13Q3 21 Guidance
Revenues Adjusted EBITDA As-reported Margin
Q3 normalized growth of 1 - 2% following a record Q2 step-up Adjusted EBITDA impacted by lower Q2 costs and
and lower Q3 Non-recurring Revenues higher seasonal utilities spend
48.1% 48.2% 46.7% 46.2%
($M) 1 - 2%
-~2%
$1,668 - 1,688 $797 $796
-$1
$773 - 793
$1,658 -$7 $766 - 786
-$7 $1,651
(1)
(1) (2) (3) (4)
Q2 21 Reported Normalizing Q2 21 Normalized Q3 21 Guidance Q2 21 Reported Normalizing Q2 21 Q3 21 Integration Q3 21 Guidance
Normalized Guidance excl. Costs
Integration
Costs
(1) Q2 21 revenues normalized for a negative foreign currency impact of approximately $7M between Q3 21 FX guidance rates and Q2 21 average FX rates
(2) Q2 21 adjusted EBITDA normalized for a negative foreign currency impact approximately $5M of between Q3 21 FX guidance rates and Q2 21 average FX rates and $4M of integration costs
(3) Impacted by flow-through from a record NRR second quarter and timing of spend shifting to third quarter
(4) Represent integration costs related to acquisitions
© 2021 Equinix.com 14(1)
FY21 AFFO and AFFO per Share Guidance (2)
Raise full year AFFO guidance by $15M; AFFO per share growth to 9 - 11%
Share Count (Diluted)
($M except AFFO per Share) Normalized
Constant Currency
YoY Growth AFFO per Share (Diluted)
(3)
AFFO
10 - 12%
88.4M 90.3M 90.4M 1 Raise AFFO guidance
$24.76 $26.73 - 27.28 $26.92 - 27.36 Prior Full Year Guidance $2,413 - 2,463M
+11 - 13% EBITDA ex. Integration Costs +$11M
Integration Costs +$5M
$2,434 - $2,474 Foreign Exchange +$6M
$9 Interest Expense +$16M
Taxes ($10M)
$2,413 - $2,463 $6 1 Recurring Capital Expenditures ($12M)
Current Guidance $2,434 - 2,474M
$2,189
2 2 FY21 Adjusted EBITDA to AFFO Guidance
FY21 Adjusted EBITDA Guidance $3,108 - 3,148M
Interest Expense ($313M)
Tax Expense ($150M)
FY20 As-reported Prior FY21 Guidance FX AFFO Adjustments FY21 Guidance Recurring Capital Expenditures (mid-point) ($193M)
Other ($18M)
Current Guidance $2,434 - 2,474M
(1) AFFO and AFFO per share guidance excludes any future capital market activities
(2) Normalized for $25M of integration costs related to acquisitions in 2021, foreign exchange impact, impact of new accounting standard related to SaaS implementation costs and other adjustments
(3) Normalized for $25M of integration costs related to acquisitions in 2021, foreign exchange impact and other adjustments. AFFO growth normalized for acquisitions and impact of new accounting standard related to SaaS
implementation costs
© 2021 Equinix.com 15Dividend Outlook
Annual Cash Dividend
($M) ~10%
+13%
~$1,030
$936
$826
• Second quarter dividend of $2.87 to be
$727 paid on September 22, 2021
$612
• 2021E cash dividend payout of
43% 44% 43% 43% 42% ~$1,030M (10% YoY) and $11.48 per share
Payout Payout Payout Payout Payout
Ratio Ratio Ratio Ratio
(8% YoY)
Ratio
2017 2018 2019 2020 2021 E (1)
Annual Cash Dividend per Share
+8%
+8%
$11.48
$10.64
$9.84
$9.12
$8.00
2017 2018 2019 2020 2021 E
(1) Excludes future financing activity
© 2021 Equinix.com 16Supplemental Financial
and Operating Data
All the Right All the Right All the Right
PLACES PARTNERS POSSIBILITIES
Place Infrastructure Connect to Everything Seize Opportunity with
Wherever You Need It You Need to Succeed Agility, Speed and Confidence
Global Footprint Global Ecosystem Experience
230 data centers across The most dynamic global ecosystem 20+ years of deep expertise
64 metros in 26 countries of 10,000+ companies including designing and implementing
on 5 continents 50%+ of Fortune 500 customer architectures
Resilient Platform Service Providers Self-Service
99.999% uptime and 1,800+ networks and 3,000+ cloud Digital tools and services to secure, control
5-layer physical security and IT service providers and manage your hybrid environment
Sustainability Leader Interconnection Services Insight
First data center company Award-winning portfolio of physical and We can help customers benchmark
to commit to supply virtual interconnections, including the their progress and accelerate it through
100% clean and worldwide reach of Equinix Fabric™. proven best practices and insights derived
renewable energy In total, 406,000+ connections globally from industry and customer trends
© 2021 Equinix.com 17Equinix Overview
(1)
• Global footprint: 230 data centers in 64 metros
Unique Portfolio of Data • Network dense: 1,800+ networks; 100% of Tier 1 Network Routes
Center Assets • Cloud dense: 3,000+ Cloud & IT service providers
• Interconnected ecosystems: 406,000+ Total Interconnections
• 2021 expected YoY revenues growth of ~8% on a normalized and constant currency basis (2)
Attractive Growth Profile • 74 quarters of sequential revenues growth
• 3% (3) same store recurring revenues growth, 69% cash gross margin (4)
• Industry-leading development yields
Proven Track Record • ~27% yield on gross PP&E invested on stabilized assets
• 10-year total annualized return including dividends as of YE 2020 was 25%
• Own 112 of 230 Data Centers, 16.8M of 27.0M gross sq. ft. (5)
Long-term Control of Assets • Owned assets generate 58% of recurring revenues
• Average remaining lease term of >18 years including extensions
• Long history of development success through expansions, campuses and known demand pipeline
Development Pipeline • Expect typical new build to be >80% utilized in 2-5 years
• Expect typical new build to be cash flow breakeven within 6-12 months
• Investment grade corporate credit ratings by S&P (BBB), Fitch (BBB) and Moody’s (Baa3)
• Conservative leverage levels with significant access to capital and financial flexibility
Balance Sheet Flexibility
• Leverage of 3.8x (net debt to LQA adjusted EBITDA)
• Steadily reduced cost of capital
• Strong yield (MRR per cabinet) across all regions and expect yields to remain firm
Stable Yield
• Levers on yield: 2 - 5% pricing escalators on existing contracts, interconnection and power density
(1) All stats are as of Q2 21
(2) FY20 normalized for the acquisitions of Axtel, Packet and Bell Canada and a positive foreign currency benefit of approximately $45M between December 31, 2020 spot rates and FY20 average FX rates
(3) YoY same store recurring revenues growth on a constant currency basis assumes average currency rates used in our financial results remained the same over the comparative periods
(4) Trailing 4-Qtr cash gross profit
(5) Square footage excludes xScale JVs
© 2021 Equinix.com 18Pressing Our Advantage in All Markets
Equinix global reach expanding across 64 metro areas and 26 countries
5 Continents 26 Countries 64 Metro areas 230 Data centers
AMERICAS EMEA ASIA-PACIFIC
% of Customers in Platform Equinix
(1)
27 Metros
103 Data Centers
25 Metros
81 Data Centers
12 Metros
46 Data Centers
Multiple Locations • Geographic footprint is
unmatched and remains
Multi-Metro a unique differentiator
Customers
• Multi-region deployments
88% outpace single-region
Multi-Region deployments
Customers
Expansion strategy
75% • Capture first-mover
In All 3 Regions advantage in future
global hubs
Approved Expansions
(2)
Approved Expansions
(2)
Approved Expansions (2) 62%
22 • Use unique market
6 4
12
intelligence for prudent
Opened 1 2
Newly Approved
capital allocation
Previously Announced 5 16 12
(1) Derived from Q2 21 recurring revenues
(2) Includes xScale JVs
© 2021 Equinix.com 19xScale: Amplifying Our Balance Sheet to Extend Cloud Leadership
Q2 2021 Leasing Activity Phase Cost
Phase Phase
JV Status Capacity Leasing
Opening ($M)
• Pre-leased entire Frankfurt 9x asset with 18MW of (MW) (MW)
capacity
Americas
São Paulo 5x-1 JV Ready Q3 2021 $52 5 0
• Pre-leased entire London 11x asset with 19MW of
capacity
Frankfurt 9x-1 JV Q3 2021 $121 10 10
Overview
• Equinix owns 20% of the JVs while receiving fees Frankfurt 11x-1 JV Q2 2022 $209 10 0
for managing and operating facilities
EMEA
• Announced agreements for additional JVs with GIC, Dublin 5x-1 JV Q2 2022 $247 19 19
in June 2021. When closed and fully built out, the
total investment between Equinix and GIC in our
xScale data center portfolio will be nearly $7 billion London 11x-2 JV Q3 2022 $51 9 9
across 32 facilities globally with more than 600
megawatts of power capacity
Osaka 2x-1 JV Q4 2021 $156 10 0
•
APAC
More than 100MW of xScale capacity leased
Benefits Tokyo 12x-2 JV Q1 2022 $40 10 4
• JV structures enable pursuit of strategic Hyperscale
deployments to minimize dilution of Equinix returns
Global
Operational
and limits consumption of balance sheet and (1) JV Open 59 59
Data Centers
investment capacity
(2)
Total 140 109
(1) Open facilities include LD11x phase 1, LD13x, PA8x, PA9x and TY12x phase 1
(2) Includes future phases of Frankfurt 9x which will add an additional 8MW of capacity and is 100% pre-leased
© 2021 Equinix.com 20Customer Revenues Mix
Diversified Revenues across Customer, Region and Industry segments
Revenues Mix Customers and Churn
Top 10 Customers
Rank Type of Customer %MRR Region Count IBX Count
EMEA 1 Cloud & IT Services 2.6% 3 69
Enterprise
32%
34% INT 2 Network 2.5% 3 143
Network 19% Asia- 3 Cloud & IT Services 2.5% 3 57
24% Recurring Pacific
22% 4 Cloud & IT Services 2.3% 3 70
Recurring Revenues
(2)
Total Revenues
MIS & 5 Cloud & IT Services 1.9% 3 80
Revenues by Other by Geography(1) 6 Cloud & IT Services 1.7% 3 45
(2)
CDM
7%
Vertical
Colo
$1,542M 6%
7 Network 1.7% 3 127
75% 8 Network 1.4% 3 147
9 Cloud & IT Services 1.2% 3 35
Cloud & IT Americas 10 Cloud & IT Services 1.2% 3 38
35%
46% Top 10 19.0%
Top 50 40.2%
Global New Customer Count & Churn %
Q2 20 Q3 20 Q4 20 Q1 21 Q2 21
Gross New Global Customers (3) 190 210 180 260 270
MRR Churn (4) 2.2% 2.6% 2.6% 2.0% 2.3%
(1) Q2 21 revenues
(2) Q2 21 recurring revenues
(3) Gross New Global Customers excludes acquisitions and customers added through the channel and is based on the count of unique global parents
(4) MRR Churn is defined as a reduction in MRR attributed to customer termination divided by MRR billing at the beginning of the quarter
© 2021 Equinix.com 21Non-Financial Metrics (1)
FY 2020 FY 2021
Q2 Q3 Q4 Q1 Q2 QoQ
Interconnections
Americas 158,000 160,500 162,800 165,000 167,100 2,100
EMEA 128,600 131,200 132,500 133,700 135,800 2,100
Asia-Pacific 65,600 67,500 67,200 69,000 70,500 1,500
Worldwide Cross Connections 352,200 359,200 362,500 367,700 373,400 5,700
Worldwide Virtual Connections 26,000 27,500 29,600 31,100 33,200 2,100
Total Interconnections 378,200 386,700 392,100 398,800 406,600 7,800
Internet Exchange Provisioned Capacity
Americas 60,900 64,100 68,600 69,900 73,300 3,400
EMEA 14,600 15,100 16,500 17,900 18,700 800
Asia-Pacific 34,900 37,400 41,100 43,700 47,300 3,600
Worldwide 110,400 116,600 126,200 131,500 139,300 7,800
Worldwide Internet Exchange Ports 5,840 5,840 5,950 5,990 6,120 130
Cabinet Equivalent Capacity
Americas 115,400 117,900 119,400 122,400 123,200 800
EMEA 123,900 123,900 125,000 126,400 127,600 1,200
Asia-Pacific 65,800 65,800 66,100 69,100 69,100 -
Worldwide 305,100 307,600 310,500 317,900 319,900 2,000
Cabinet Billing
Americas 86,900 86,300 86,800 88,300 90,400 2,100
EMEA 102,300 103,600 104,400 105,200 106,200 1,000
Asia-Pacific 52,300 53,400 54,600 55,400 56,500 1,100
Worldwide 241,500 243,300 245,800 248,900 253,100 4,200
Quarter End Utilization
Americas 75% 73% 73% 72% 73%
EMEA 83% 84% 84% 83% 83%
Asia-Pacific 79% 81% 83% 80% 82%
MRR per Cab
North America $2,376 $2,396 $2,415 $2,426 $2,423
EMEA $1,502 $1,539 $1,530 $1,551 $1,564
Asia-Pacific $1,839 $1,880 $1,901 $1,931 $1,937
(1) Non-financial metrics excludes APAC and EMEA xScale JVs, Axtel, Packet and Bell Canada assets
© 2021 Equinix.com 22Equinix Announced Retail IBX Expansions
Cabinet(1)
Equivalent
Expansion Highlights
Total Capex(1)
IBX Data Center Status Q2 Q3 Q4 Q1 Q2
2022
Q3 Q4 $US millions Ownership
Capacity In
Future Phases
• We have 35 major builds underway
SV11 phase 1 (Silicon Valley) Open 1,450 $142 Owned 1,500 in 25 markets, across 19 countries
DC15 phase 2 (Washington D.C.) Previously Announced 1,600 $48 Owned - including 7 xScale builds in all three
NY6 phase 2 (New York) Previously Announced 525 $28 Owned* -
MX2 phase 2 (Mexico City) Previously Announced 1,075 $54 Owned 1,050 regions of the world
BG2 phase 1 (Bogotá) Previously Announced 550 $45 Owned 550
Americas Sellable IBX Cabinet Adds 1,450 - 2,125 1,075 - 550 - $316 • We had 3 openings - Bordeaux,
BX1 phase 1 (Bordeaux) Open 225 $28 Owned 700
HE7 phase 2 (Helsinki) Open 600 $28 Owned - Helsinki and Silicon Valley
ML5 phase 1 (Milan) Open 500 $49 Owned 1,025
SK2 phase 7 (Stockholm) Open 250 $6 Leased 575 • Estimated FY21 ending cabinet
FR8 phase 1 (Frankfurt) Previously Announced 1,975 $109 Owned -
IL2 phase 2 (Istanbul) Previously Announced 400 $25 Owned -
equivalent capacity of ~334,000
WA3 phase 2 (Warsaw) Previously Announced 475 $29 Owned 250
GV2 phase 3 (Geneva) Previously Announced 300 $22 Leased -
GN1 phase 1 (Genoa) Previously Announced 150 $21 Owned -
MU4 phase 1 (Munich) Previously Announced 825 $69 Owned 4,150
LD8 phase 4 (London) Previously Announced 550 $36 Leased -
MC1 phase 2 (Muscat) Previously Announced 475 $19 Owned / JV -
ZH5 phase 4 (Zurich) Previously Announced 250 $42 Owned 700
IL2 phase 3 (Istanbul) Newly Approved 525 $15 Owned -
LD7 phase 2 (London) Previously Announced 2,275 $111 Owned* -
MD2 phase 4 (Madrid) Previously Announced 375 $16 Leased -
MA5 phase 1 (Manchester) Previously Announced 1,025 $78 Owned 975
PA10 phase 1 (Paris) Previously Announced 2,250 $163 Owned -
EMEA Sellable IBX Cabinet Adds 1,575 2,850 1,275 1,275 6,450 - - $810
HK1 phase 13-A (Hong Kong) Previously Announced 525 $30 Leased 250
SH6 phase 2 (Shanghai) Previously Announced 575 $18 Leased 2,275
SG1 phase 15 (Singapore) Previously Announced 300 $22 Leased -
SG5 phase 1 (Singapore) Previously Announced 1,375 $144 Owned* -
SY5 phase 2 (Sydney) Previously Announced 2,150 $49 Owned 5,300
OS3 phase 1 (Osaka) Previously Announced 900 $55 Leased 1,625
PE3 phase 1 (Perth) Previously Announced 700 $54 Owned* 1,000 Subject to long-term ground lease
SG5 phase 2 (Singapore) Previously Announced 1,525 $75 Owned* -
*
SG5 phase 3 (Singapore) Previously Announced 700 $19 Owned* 2,100 (1) Sellable cabinet equivalents and capital expenditures are
TY11 phase 3 (Tokyo) Previously Announced 900 $31 Leased 675 approximate and may change based on final construction details
Asia-Pacific Sellable IBX Cabinet Adds - 4,925 3,125 700 900 - - $497
Global Sellable IBX Cabinet Adds 3,025 7,775 6,525 3,050 7,350 550 - $1,623
© 2021 Equinix.com 23Long-Term Lease Renewals
Weighted average lease maturity of greater than 18 years including extensions
(1)
Global Lease Portfolio Expiration Waterfall
Equinix Owned Sites (2, 3)
% Leases Renewing by Square Footage • Own 112 of 230 Data Centers
(4)
Last Possible Expiration Date • 16.8M of 27.0M total gross square feet
70%
• 58% of total recurring revenues
Limited Near-Term Lease Expirations
• Only 0.1M square feet up for renewal prior to 2023
8% 6%
2% 3% 4% 1%
1% 0% 1% 1% 1% 1% 0% 1%
2021 2022 2023 2024 2025 2026 2027 2028 2029 2030 2031 2032 2033 2034 2035 +
(3)
87% of our recurring revenue is generated by either owned properties or properties where our lease expirations extend to 2035 and beyond
(1) Lease expiration waterfall represents when leased square footage expires assuming all available renewal options are exercised as of December 31, 2020. Square footage represents area in operation based on customer ready date
(2) Owned assets defined as fee-simple ownership or owned building on long-term ground lease
(3) Bit-isle revenues allocated based on square footage of facilities; Itconic revenues allocated based on management reporting estimates
(4) Excludes xScale JVs
© 2021 Equinix.com 24Same Store Operating Performance (1)
Revenues ($M) Cash Cost, Gross Profit and PP&E ($M)
Cash Cost Trailing 4-Qtr
Inter- Services/ Total Non- Total of Cash Gross Cash Gross Gross Cash Return on
Category Colocation connection Other Recurring recurring Revenues Revenues Profit Margin % PP&E Gross PP&E %
Q2 2021 Stabilized $860 $225 $59 $1,144 $52 $1,196 $368 $828 69% $12,299 27%
Q2 2020 Stabilized $833 $199 $62 $1,093 $49 $1,142 $354 $788 69% $11,322 27%
Stabilized YoY % 3% 13% -4% 5% 6% 5% 4% 5% 0% 9% 0%
(2)
Stabilized @ CC YoY % 2% 10% -8% 3% 2% 3% 0% 4% 1% 6% 0%
Q2 2021 Expansion $255 $60 $20 $335 $32 $367 $123 $245 67% $6,381 14%
Q2 2020 Expansion $214 $49 $16 $279 $20 $299 $107 $192 64% $5,357 14%
Expansion YoY % 19% 22% 23% 20% 60% 23% 14% 27% 2% 19% 0%
Q2 2021 Total $1,115 $286 $79 $1,479 $84 $1,563 $490 $1,073 69% $18,680 22%
Q2 2020 Total $1,047 $248 $78 $1,373 $69 $1,441 $461 $980 68% $16,679 23%
Total YoY % 7% 15% 1% 8% 22% 8% 6% 9% 1% 12% 0%
(1) Excludes Packet acquisition, Bell Canada assets, Infomart non-IBX tenant income, APAC and EMEA xScale JVs
(2) YoY growth on a constant currency basis assumes average currency rates used in our financial results remained the same over comparative periods
© 2021 Equinix.com 25Consolidated Portfolio Operating Performance (1)
Cabinets Billed Q2 21 Revenues ($M)
Total Cabinet Owned % of
Cabinet Cabinets Utilization Total Total
Category # of IBXs Capacity Billed % Recurring Recurring
(5)
Americas
(2)
Owned 52 88,800 63,000 71% $455
Leased 38 34,400 27,400 80% $198
Americas Total 90 123,200 90,400 73% $652 70%
EMEA
Owned (2) 34 85,300 70,600 83% $322
Leased 43 42,300 35,600 84% $176
EMEA Total 77 127,600 106,200 83% $498 65%
Asia-Pacific
Owned (2) 16 22,400 18,600 83% $84
Leased 29 46,700 37,900 81% $252
Asia-Pacific Total 45 69,100 56,500 82% $336 25%
EQIX Total 212 319,900 253,100 79% $1,485 58%
Other Real Estate
(3)
Owned - - - 0% $9
Other Real Estate Total - - - 0% $9 100%
Acquisition Total (4) 13 $35 65%
Combined Total 225 319,900 253,100 79% $1,529 58%
(1) Excludes Packet acquisition, non-IBX assets, APAC and EMEA xScale JVs; Acquisition IBX level financials are based on allocations which will be refined as integration activities continue
(2) Owned assets include those subject to long-term ground leases
(3) Includes Infomart non-IBX tenant income
(4) Includes Bell Canada assets in IBX count; acquisition cabinet counts are excluded
(5) Excludes Axtel acquisition cabinet counts
© 2021 Equinix.com 26Data Center Portfolio Composition
Metro Count Stabilized Expansion New Acquisition xScale Owned Leased
Atlanta 5 AT2, AT3, AT4, AT5 AT1 AT4 AT1, AT2, AT3, AT5
Bogota 1 BG1 BG1
Boston 1 BO2 BO2
Calgary 3 CL1, CL2, CL3 CL3 CL1, CL2
Chicago 5 CH1, CH2, CH4, CH7 CH3 CH3, CH7 CH1, CH2, CH4
Culpeper 4 CU1,CU2, CU3 CU4 CU1, CU2, CU3, CU4
Dallas 8 DA1, DA2, DA3, DA4, DA7, DA9 DA6 DA11 DA1, DA2, DA3, DA6, DA9, DA11 DA4, DA7
DC1, DC2, DC3, DC4, DC5, DC6, DC7, DC10, DC1, DC2, DC4, DC5, DC6, DC11, DC12, DC13,
Washington DC/Ashburn 15 DC14 DC15, DC21 DC3, DC7, DC10, DC97
DC11, DC12, DC13, DC97 DC14, DC15, DC21
Denver 2 DE1 DE2 DE2 DE1
Houston 1 HO1 HO1
Kamloops 1 KA1 KA1
Los Angeles 5 LA1, LA2, LA3 LA4, LA7 LA4, LA7 LA1, LA2, LA3
Mexico City 2 MX1, MX2 MX1, MX2
Miami 4 MI2, MI3, MI6 MI1 MI1, MI6 MI2, MI3
Monterrey 1 MO1 MO1
Montreal 1 MT1 MT1
New York 10 NY1, NY2, NY4, NY7, NY8, NY9, NY11, NY13 NY5, NY6 NY2, NY4*, NY5*, NY6*, NY11 NY1, NY7, NY8, NY9, NY13
Ottawa 1 OT1 OT1
Philadelphia 1 PH1 PH1
Rio de Janiero 2 RJ1 RJ2 RJ2* RJ1
Sao Paulo 4 SP1, SP2 SP3, SP4 SP1, SP2, SP3 SP4
Seattle 3 SE2, SE3 SE4 SE4 SE2, SE3
SV1, SV2, SV3, SV4, SV5, SV6, SV8, SV10,
Silicon Valley 14 SV11 SV1, SV5, SV10, SV11, SV14, SV15, SV16 SV2, SV3, SV4, SV6, SV8, SV13, SV17
SV13, SV14, SV15, SV16, SV17
St. John 1 SJ1 SJ1
Toronto 6 TR1 TR2 TR4, TR5, TR6, TR7 TR2, TR6, TR7 TR1, TR4, TR5
Vancouver 1 VA1 VA1
Winnipeg 1 WI1 WI1
Americas 103 65 21 4 13 0 58 45
Status Change
* Subject to long-term ground lease
(1) Stabilized/Expansion/New IBX categorization are
reset annually in Q1
(2) Opened SV11 in Q2 21
© 2021 Equinix.com 27Data Center Portfolio Composition
Metro Count Stabilized Expansion New Acquisition xScale Owned Leased
Abu Dhabi 1 AD1 AD1 Change Summary (1) (2) (3)
Amsterdam 9 AM1, AM2, AM3, AM5, AM6, AM8 AM4, AM7, AM11 AM1*, AM2*, AM3*, AM4*, AM5, AM6, AM7* AM8, AM11
Barcelona 1 BA1 BA1
Bordeaux 1 BX1 BX1
Dubai 2 DX1, DX2 DX1, DX2 Leased to Owned
Dublin 4 DB1, DB2, DB3, DB4 DB3, DB4 DB1, DB2 SG3
Dusseldorf 1 DU1 DU1
East Netherlands 2 EN1, ZW1 EN1, ZW1
Frankfurt 5 FR2, FR4, FR6, FR7 FR5 FR2, FR4, FR5, FR6 FR7
Geneva 2 GV1, GV2 GV1,GV2
Hamburg 1 HH1 HH1
Helsinki 6 HE1, HE3, HE4, HE6 HE5, HE7 HE6, HE7 HE1, HE3, HE4, HE5
Istanbul 1 IL2 IL2
Lisbon 1 LS1 LS1
London 10 LD3, LD5, LD6, LD8, LD9 LD4, LD7, LD10 LD11x, LD13x LD4*, LD5*, LD6*, LD7* LD3, LD8, LD9, LD10, LD11x, LD13x
Madrid 2 MD1 MD2 MD1, MD2
Manchester 4 MA1, MA2, MA3, MA4 MA1, MA2, MA3, MA4
Milan 4 ML2, ML3, ML4 ML5 ML3, ML5 ML2, ML4
Munich 2 MU1, MU3 MU1, MU3
Muscat 1 MC1 MC1
Paris 9 PA1, PA2, PA3, PA4, PA5, PA6, PA7 PA8x, PA9x PA2, PA3, PA4, PA8x, PA9x* PA1, PA5, PA6, PA7
Seville 1 SA1 SA1
Sofia 2 SO1 SO2 SO1, SO2
Stockholm 3 SK1, SK3 SK2 SK2 SK1, SK3
Warsaw 3 WA2 WA1, WA3 WA3 WA1, WA2
Zurich 3 ZH2 ZH4, ZH5 ZH5 ZH2, ZH4
EMEA 81 54 20 3 0 4 37 44
Adelaide 1 AE1 AE1
Brisbane 1 BR1 BR1
Canberra 1 CA1 CA1*
Hong Kong 5 HK2, HK3, HK5 HK1, HK4 HK1, HK2, HK3, HK4, HK5
Melbourne 4 ME1, ME5 ME2, ME4 ME1, ME2, ME4, ME5
Osaka 2 OS1, OS99 OS1, OS99
Perth 2 PE1, PE2 PE1, PE2*
Seoul 1 SL1 SL1
Singapore 4 SG1, SG2, SG3 SG4 SG3 SG1, SG2, SG4
Shanghai 5 SH1, SH2, SH3, SH5 SH6 SH3 SH1, SH2, SH5, SH6 Status Change
Sydney 8 SY1, SY2, SY3, SY4, SY7, SY8 SY5, SY6 SY4*, SY5, SY6, SY7 SY1, SY2, SY3, SY8
Tokyo 12
TY1, TY2, TY3, TY4, TY5, TY6, TY7, TY8, TY9,
TY11 TY12x TY10*, TY12x
TY1, TY2, TY3, TY4, TY5, TY6, TY7, TY8, TY9, * Subject to long-term ground lease
TY10 TY11
APAC 46 34 11 0 0 1 17 29 (1) Stabilized/Expansion/New IBX categorization are
Total 230 153 52 7 13 5 112 118 reset annually in Q1
(2) Opened BX1 in Q2 21
(3) Closed FR1 in Q2 21
© 2021 Equinix.com 28(1)
Adjusted Corporate NOI ($M, except # of IBXs)
Calculation Of Adjusted Corp NOI Q2 2021 Q1 2021 Q4 2020 Q3 2020 Q2 2020
(1)
# of IBXs 225 224 225 212 211
(2)
Recurring Revenues $1,529 $1,497 $1,453 $1,420 $1,385
Recurring Cash Cost of Revenues Allocation (454) (434) (466) (431) (416)
Cash Net Operating Income 1,074 1,062 986 989 969
(3)
Operating Lease Rent Expense Add-back 47 47 46 45 44
(4)
Regional Cash SG&A Allocated to Properties (165) (168) (176) (154) (148)
Adjusted Cash Net Operating Income (3) $956 $941 $857 $880 $865
Adjusted Cash NOI Margin 62.6% 62.9% 59.0% 62.0% 62.4%
Reconciliation of NOI Cost Allocations
(2)
Non-Recurring Revenues (NRR) $93 $81 $95 $83 $69
Non-Recurring Cash Cost of Revenues Allocation (64) (46) (59) (50) (52)
Net NRR Operating Income $28 $35 $36 $32 $17
Total Cash Cost of Revenues (2) $518 $480 $525 $481 $468
Non-Recurring Cash Cost of Revenues Allocation (64) (46) (59) (50) (52)
Recurring Cash Cost of Revenues Allocation $454 $434 $466 $431 $416
(1)
Regional Cash SG&A Allocated to Stabilized & Expansion Properties $162 $166 $167 $147 $142
(1)
Regional Cash SG&A Allocated to New Properties 3 2 8 7 7
Total Regional Cash SG&A 165 168 176 154 148
Corporate Cash SG&A in HQ Functions Not Allocated to Regions NOI 147 141 132 129 119
Total Cash SG&A (4) $312 $309 $308 $283 $268
Corporate HQ SG&A as a % of Total Revenues 8.9% 8.8% 8.5% 8.5% 8.1%
(1) Excludes Packet acquisition, non-IBX assets, APAC and EMEA xScale JVs
(2) Excludes revenues and cash cost of revenues from Packet acquisition, non-IBX assets, APAC and EMEA xScale JVs
(3) Adjusted NOI excludes operating lease expenses
(4) 100% of Regional SG&A Allocated to Properties excludes incremental SG&A costs not directly supporting a regional portfolio and integration costs
© 2021 Equinix.com 29Adjusted NOI Composition – Organic
(1)
Q2 2021
Total Cabinet Q2 2021 Quarterly
# of Cabinet Cabinets Utilization Recurring Adjusted NOI
Category IBXs Capacity Billed % Revenues ($M) ($M) % NOI
Stabilized
Owned (2) 60 122,100 105,900 87% $596 $398 42%
Leased 93 100,900 85,900 85% $549 $338 36%
Stabilized Total 153 223,000 191,800 86% $1,144 $736 79%
Expansion
Owned (2) 36 68,000 44,500 65% $259 $158 17%
Leased 16 22,500 15,000 67% $76 $41 4%
Expansion Total 52 90,500 59,500 66% $335 $199 21%
New
(2)
Owned 7 6,400 1,800 28% $6 -$1 0%
Leased - - - - $- $- 0%
New Total 7 6,400 1,800 28% $6 -$1 0%
Other Real Estate
(3)
Owned - - - - $9 $4 0%
Other Real Estate Total - - - - $9 $4 0%
Combined
(2)
Owned 103 196,500 152,200 77% $869 $558 60%
Leased 109 123,400 100,900 82% $625 $380 40%
Combined Total 212 319,900 253,100 79% $1,494 $938 100%
(1) Excludes Bell Canada assets, Packet acquisition, non-IBX assets, APAC and EMEA xScale JVs
(2) Owned assets include those subject to long-term ground leases
(3) Includes Infomart non-IBX tenant income
© 2021 Equinix.com 30Components of Net Asset Value
Operating Portfolio Q2 21 Quarterly
Ownership Reference
Adjusted NOI Adjusted NOI ($M)
Stabilized Owned Adjusted NOI Segments $398
Stabilized Leased Adjusted NOI Segments $338
Expansion Owned Adjusted NOI Segments $158
Expansion Leased Adjusted NOI Segments $41
Other Real Estate Owned Adjusted NOI Segments $4
Quarterly Adjusted NOI (Stabilized, Expansion & Other Real Estate Only) $939
Other Operating Income
Acquisition Net Operating Income (1) $19
Quarterly Non-Recurring Operating Income $28
Unstabilized Properties
New IBX at Cost $665
Development CIP and Land Held for Development $1,487
Other Assets
Cash and Cash Equivalents Balance Sheet $1,800
Restricted Cash (2) Balance Sheet $22
Accounts Receivable, Net Balance Sheet $726
Assets Held for Sale Balance Sheet $227
(3)
Prepaid Expenses and Other Assets Balance Sheet $884
Total Other Assets $3,659
Liabilities
Book Value of Debt (4) Balance Sheet $11,681
(5)
Accounts Payable and Accrued Liabilities Balance Sheet $1,072
Dividend and Distribution Payable Balance Sheet $19
(6)
Deferred Tax Liabilities and Other Liabilities Balance Sheet $734
Total Liabilities $13,507
Other Operating Expenses
Annualized Cash Tax Expense $167
Annualized Cash Rent Expense (7) $364
Diluted Shares Outstanding (millions) Estimated 2021 Fully Diluted Shares 91.4
(1) Includes Bell Canada assets (5) Consists of accounts payable and accrued expenses and accrued property, plant and equipment
(2) Restricted cash is included in other current assets and other assets in the balance sheet (6) Consists of other current liabilities and other noncurrent liabilities, less deferred installation revenue, asset retirement
(3) Consists of other current assets and other noncurrent assets including JV investments, less restricted cash, derivative assets, obligations and dividend and distribution payable
debt issuance costs, and contract costs (7) Includes operating lease rent payments and finance lease principal and interest payments; excludes equipment and office
(4) Excludes finance lease and operating lease liabilities leases
© 2021 Equinix.com 31Debt Summary
Debt
Interest (1)
Maturity
Balance(2) Debt Redemption, Issuance and
Rate ($M)
Amortization
Revolver 0.937% 12-Dec-2022 - • $1.25B 2027 Notes redeemed on June 2
(3)
GBP Term Loan A 1.080% 12-Dec-2022 578
Senior Notes • SEK 2.4B Term Loan A and ¥41.6B Term Loan A
2.625% USD Senior Notes due 2024 2.625% 18-Nov-2024 1,000 repaid on May 17
1.250% USD Senior Notes due 2025 1.250% 15-Jul-2025 500
1.000% USD Senior Notes due 2025 1.000% 15-Sep-2025 700 • $700M 2026 Notes, $400M 2028 Notes, $1B 2031
1.450% USD Senior Notes due 2026 1.450% 15-May-2026 700 Notes and $500M 2052 Notes issued on May 17
2.900% USD Senior Notes due 2026 2.900% 18-Nov-2026 600
0.250% EUR Senior Notes due 2027 0.250% 15-Mar-2027 593 • $578M GBP Term Loan A amortizes at 5% per year
1.800% USD Senior Notes due 2027 1.800% 15-Jul-2027 500 through 2022
1.550% USD Senior Notes due 2028 1.550% 15-Mar-2028 650
2.000% USD Senior Notes due 2028 2.000% 15-May-2028 400
• Final $150M Infomart installment paid in April 2021
3.200% USD Senior Notes due 2029 3.200% 18-Nov-2029 1,200
2.150% USD Senior Notes due 2030 2.150% 15-Jul-2030 1,100
2.500% USD Senior Notes due 2031 2.500% 15-May-2031 1,000
1.000% EUR Senior Notes due 2033 1.000% 15-Mar-2033 711
3.000% USD Senior Notes due 2050 3.000% 15-Jul-2050 500
2.950% USD Senior Notes due 2051 2.950% 15-Sep-2051 500
3.400% USD Senior Notes due 2052 3.400% 15-Feb-2052 500
Senior Notes Total 2.121% $ 11,154
Mortgage Payable and Other Loans Payable 3.649% Various 77
Subtotal $ 11,808
Finance Lease Obligations 2,148
Total Debt $ 13,956
(1) Revolver and GBP Term Loan A are floating-rate instruments with margins of 0.85% and 1.00%, respectively
(2) Principal balances outstanding as of June 30, 2021
(3) GBP Term Loan A has an outstanding balance of approximately GBP 419M
© 2021 Equinix.com 32Shares Forecast (M)
Fully Diluted Weighted Average Shares Common Stock Outstanding
89.8
-0.3 89.6
~90.4
0.7 89.1 89.1
~90.1
88.5
0.1
1.5 1.6 1.6
0.8 1.3 1.3
89.1
Shares Est. Employee ATM Offering Est. Shares Est. Weighted Est. Weighting Est. Fully Diluted Q2 20 Q3 20 Q4 20 Q1 21 Q2 21
Outstanding @ Equity Awards Outstanding Dilutive of All Share Weighted Avg
12/31/20 - Actual @ 12/31/21 Unvested Shares Activities Shares O/S @ Common Stock Outstanding (As-reported)
12/31/21 Unissued Shares Associated with Employee Equity Awards
Actual/Forecasted Shares - Fully Diluted Shares - Shares -
Shares (For NAV) Basic Fully Diluted
Shares outstanding at the beginning of the year 89.13 89.13 89.13 89.13
ATM Offering 0.14 0.14 0.08 0.08
(1)
RSUs vesting 0.62 0.62 0.40 0.40
ESPP purchases (1) 0.17 0.17 0.11 0.11
(2) (3)
Dilutive impact of unvested employee equity awards - 1.29 - 0.67
0.92 2.22 0.59 1.27
(4) For Diluted
Shares outstanding - Forecast 90.06 91.35 89.73 90.40 AFFO/Share
(1) Represents forecasted shares expected to be issued for employee equity awards
(2) Represents the dilutive impact of employee equity awards that were granted, but unvested as of year end
(3) Represents the dilutive impact of employee equity awards that were granted, but unvested as of year end and any employee equity awards to be issued in 2021. The weighted-average shares are calculated on the same basis as diluted
EPS for U.S. GAAP purposes
(4) Excludes any potential equity financing the company may undertake in the future
© 2021 Equinix.com 33Capital Expenditures Profile
($M) Q2 2021 Q1 2021 Q4 2020 Q3 2020 Q2 2020
Recurring IBX Maintenance 30 13 63 28 19
Sustaining IT & Network 8 3 4 6 5
Re-configuration Installation 8 5 8 4 7
Subtotal - Recurring 45 20 74 38 30
Non-Recurring IBX Expansion 515 453 582 417 372
Transform IT, Network & Offices 91 59 138 77 50
Initial / Custom Installation 41 32 39 32 30
Subtotal - Non-Recurring 647 543 760 527 452
Total 692 564 834 565 482
Recurring Capital Expenditures as a % of Revenues 2.7% 1.3% 4.8% 2.5% 2.1%
© 2021 Equinix.com 34FX Rates, Hedging and Currencies
(4)
Currency % of Revenues
Revenue FX Rates
(1) (2) Blended (2) Blended (3) % of CHF
Currency Guidance Rate Hedge Rate (4) GBP
Guidance Rate Hedge % Revenues 1%
10%
EUR HKD
USD 1.00 38% 20% 3%
AUD
EUR to USD 1.19 1.16 1.17 64% 20% 4%
GBP to USD 1.38 1.31 1.33 72% 10%
JPY to USD 0.01 7% 7% JPY
Other 3%
SGD to USD 0.74 7%
SEK 1%
HKD to USD 0.13 3%
BRL to USD 0.20 3% 7% SGD
AUD to USD 0.75 4%
3% 0% CNY
SEK to USD 0.12 0.11 0.11 67% 1% BRL
3%
CHF to USD 1.08 1.08 1.08 58% 1% CAD
CAD to USD 0.81 3%
38%
CNY to USD 0.15 0%
USD
Other(5) - 3%
(1) Guidance rate as of close of market on 6/30/2021
(2) Hedge rate and blended guidance rate for Q3 21
(3) Blended hedge percent for combined Equinix business for Q3 21
(4) Currency % of revenues based on combined Q2 2021 revenues; adjusted AUD, JPY, SGD and other currencies for USD billings
(5) Other includes AED, BGN, COP, KRW, PLN, MXN and TRY currencies
© 2021 Equinix.com 35Future First Sustainability @ Equinix
Our commitment to sustainability is driven by our belief in a future of possibility.
AWARDS ESG RATINGS
Do what it takes • Commitment to become Climate Neutral Globally
to protect our by 2030 and science-based targets aligned to 1.5°C
planet. • Issued $3.7B+ in Green Bonds to drive investment 16.1 ESG Risk Rating AA ESG Rating
in six project categories
• Achieved >90% renewable energy in 2020, up
from 34% in 2015 A- Rating
• 17.7 million sq. ft. of gross floor area under LEED
or similar certification
#2 of 108 REITs
Do more each • 100% senior leadership commitment for Best Financial
Material ESG Metrics
day to unleash inclusive leadership assessments and coaching Index Series Member
potential. • 85% employee engagement rate
• 3.6% YOY increase in representation of women at
PARTNERSHIPS FRAMEWORK ALIGNMENT
leadership levels
• $2.8 million in donations in FY20, including
$900K for racial justice and COVID-19 relief
through 2:1 matching
Do what’s right • 33% women on the Board
to lead the way. • Annual Code of Business Conduct Training
reached 100% of employees worldwide
• Supplier ESG expectations in Business Partner
Code of Conduct
© 2021 Equinix.com 36Industry Analyst Reports
Solution Category Reports
• Marketscape: WW Datacenter Colocation & Interconnection Services 2021 Vendor Assessment - IDC,
6/21
Interconnection
• Equinix: The Global Digital Platform Facilitator – IDC, 1/21
• Interconnection amplifies the value of bare metal deployments – ESG, 10/20
• Business Composability Helps You Thrive Amid Disruption – Gartner, 6/21
• Infrastructure is Everywhere – The Evolution of Data Centers - Gartner, 2/21
• Building Digital Infrastructure to Achieve Business Advantage - IDC, 12/20
Digital Infrastructure
• Your Data Center May Not be Dead, but it’s Morphing - Gartner, 9/17/20
• The Future of Digital Infrastructure: Digital Services & Experiences - IDC, 9/20
• Digital Business Maturity Model - Gartner, 4/9/20
• Hybrid Cloud Trends – Strategies for Optimizing On-premises & Public Cloud Infrastructure -
Multi-cloud Enterprise Strategy Group, 5/20
• How to Optimize Network Connectivity Into Public Cloud Providers – Gartner, 2/21
• Equinix Network Edge: Laying the Path to Agile, Multicloud Networking - Frost & Sullivan, 12/4/20
Edge Computing
• 2021 Strategic Roadmap for Edge Computing - Gartner, 11/20
• Datacenters and Sustainability Goals: How Efficient and Resilient Datacenters Accelerate
Sustainability Sustainability Progress – IDC, 10/20
• Equinix's Sustainability Progress: IT Provider Corporate Responsibility Profile - IDC, 7/20
© 2021 Equinix.com 37Equinix Leadership and Investor Relations
Executive Team
Equinix Investor Relations Contacts Equity Research Analysts
Katrina Rymill Bank of America Michael Funk
VP, IR and Sustainability Barclays Brendan Lynch
650-598-6583 Berenberg Nate Crossett
krymill@equinix.com BMO Capital Markets Ari Klein
Keith Taylor Citigroup Mike Rollins
Charles Meyers Chip Newcom
Chief Financial Officer Cowen Colby Synesael
Chief Executive Officer and Director, IR and Sustainability
President Credit Suisse Sami Badri
650-598-6262
Deutsche Bank Matthew Niknam
cnewcom@equinix.com
Edward Jones Kyle Sanders
Raouf Abdel - EVP, Global Operations Goldman Sachs Brett Feldman
Sara Baack - Chief Product Officer Katie Morgan
Green Street Advisors David Guarino
Mike Campbell - Chief Sales Officer Manager, IR
Jefferies Jonathan Petersen
Justin Dustzadeh - Chief Technology Officer 650-250-1740
Simon Miller - Chief Accounting Officer JP Morgan Phil Cusick
kamorgan@equinix.com
Brandi Galvin Morandi - Chief Legal and Human Resources Officer KeyBanc Jordan Sadler
and Corporate Secretary Moffet Nathenson Nick Del Deo
Eric Schwartz - Chief Strategy and Development Officer Morgan Stanley Simon Flannery
Karl Strohmeyer - Chief Customer and Revenue Officer New Street Research Jonathan Chaplin
Milind Wagle - Chief Information Officer Equinix Media Contacts Oppenheimer Tim Horan
David Fonkalsrud Raymond James Frank Louthan
Board of Directors Director, Public Relations RBC Capital Markets Jonathan Atkin
650-598-6240 Stifel Erik Rasmussen
Peter Van Camp - Executive Chairman, Equinix
dfonkalsrud@equinix.com TD Securities Jonathan Kelcher
Charles Meyers - Chief Executive Officer and President, Equinix
Truist Securities Greg Miller
Tom Bartlett - President & Chief Executive Officer, American Tower
UBS John Hodulik
Nanci Caldwell - Former CMO, PeopleSoft
Adaire Fox-Martin - EMEA Cloud President, Google Cloud Wells Fargo Eric Leubchow
Gary Hromadko - Private Investor William Blair James Breen
Irving Lyons III - Principal, Lyons Asset Management Wolfe Research Jeff Kvaal
Christopher Paisley - Dean’s Executive Professor, Leavey School of Business
at Santa Clara University
Sandra Rivera - Executive Vice President and General Manager of Datacenter and
AI, Intel Corporation
© 2021 Equinix.com 38Appendix: Non-GAAP Financial
Reconciliations & Definitions
© 2021 Equinix.com 39Non-GAAP Reconciliations © 2021 Equinix.com 40
Non-GAAP Reconciliations © 2021 Equinix.com 41
Non-GAAP Reconciliations © 2021 Equinix.com 42
Non-GAAP Reconciliations © 2021 Equinix.com 43
Non-GAAP Reconciliations © 2021 Equinix.com 44
Non-GAAP Reconciliations
Consolidated NOI calculation Q2 2021 Q1 2021 Q4 2020 Q3 2020 Q2 2020
(unaudited and in thousands)
Revenues $ 1,657,919 $ 1,596,064 $ 1,564,115 $ 1,519,767 $ 1,470,121
Non-Recurring Revenues (NRR) (1) 92,658 80,899 95,149 82,550 68,832
Other Revenues (2) 36,635 18,537 16,384 17,510 16,208
Recurring Revenues (1) $ 1,528,626 $ 1,496,627 $ 1,452,581 $ 1,419,707 $ 1,385,081
Cost of Revenues $ (865,120) $ (811,217) $ (830,735) $ (767,979) $ (739,344)
Depreciation, Amortization and Accretion Expense 310,916 291,940 283,029 265,936 250,743
Stock-Based Compensation Expense 10,008 8,467 8,039 7,856 7,655
Total Cash Cost of Revenues (1) $ (544,196) $ (510,810) $ (539,667) $ (494,187) $ (480,946)
Non-Recurring Cash Cost of Revenues Allocation (1) (64,192) (45,516) (58,924) (50,179) (51,944)
Other Cash Cost of Revenues (2) (25,735) (30,875) (14,520) (13,191) (12,807)
Recurring Cash Cost of Revenues Allocation $ (454,269) $ (434,420) $ (466,224) $ (430,816) $ (416,195)
Operating Lease Rent Expense Add-back (3) 47,093 46,830 46,338 44,885 44,081
Recurring Cash Cost excluding Operating Lease Rent $ (407,176) $ (387,589) $ (419,885) $ (385,931) $ (372,114)
Selling, General, and Administrative Expenses $ (507,615) $ (484,283) $ (480,199) $ (452,077) $ (435,014)
Depreciation and Amortization Expense 106,842 102,378 95,830 96,350 97,691
Stock-based Compensation Expense 84,327 69,883 71,323 67,392 68,189
Total Cash SG&A $ (316,446) $ (312,022) $ (313,046) $ (288,335) $ (269,134)
Corporate Cash SG&A in HQ Functions Not Allocated to Regions NOI (146,811) (140,803) (132,223) (129,281) (119,468)
Other Cash SG&A (2) (4,631) (3,387) (4,958) (4,903) (1,251)
Regional Cash SG&A Allocated to Properties (4) $ (165,004) $ (167,832) $ (175,865) $ (154,152) $ (148,415)
(1) Excludes revenues and cash cost of revenues from Packet acquisition and non-IBX assets
(2) Includes revenues and cash costs of revenues from Packet acquisition, non-IBX assets, APAC and EMEA xScale JVs
(3) Adjusted NOI excludes operating lease expenses
(4) 100% of Regional SG&A Allocated to Properties excludes incremental SG&A costs not directly supporting a regional portfolio and integration costs
© 2021 Equinix.com 45Non-GAAP Reconciliations
(unaudited and in thousands) Q2 2021 Q1 2021 Q4 2020 Q3 2020 Q2 2020
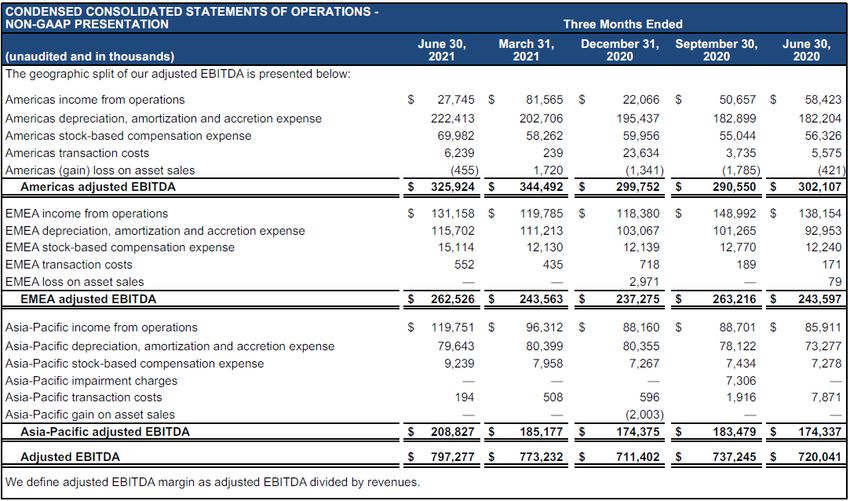
Income from Operations $ 278,654 $ 297,662 $ 228,606 $ 288,350 $ 282,488
Adjustments:
Depreciation, Amortization and Accretion Expense 417,758 394,318 378,859 362,286 348,434
Stock-based Compensation Expense 94,335 78,350 79,362 75,248 75,844
Transaction Costs 6,985 1,182 24,948 5,840 13,617
Impairment Charges - - - 7,306 -
(Gain) Loss on Asset Sales (455) 1,720 (373) (1,785) (342)
Adjusted EBITDA $ 797,277 $ 773,232 $ 711,402 $ 737,245 $ 720,041
Adjustments:
Non-Recurring Revenues (NRR) (1) (92,658) (80,899) (95,149) (82,550) (68,832)
Other Revenues (2) (36,635) (18,537) (16,384) (17,510) (16,208)
Non-Recurring Cash Cost of Revenues Allocation (1) 64,192 45,516 58,924 50,179 51,944
Other Cash Cost of Revenues (2) 25,735 30,875 14,520 13,191 12,807
(3)
Corporate Cash SG&A in HQ Functions Not Allocated to Regions NOI 146,811 140,803 132,223 129,281 119,468
(4)
Other Cash SG&A 4,631 3,387 4,958 4,903 1,251
Operating Lease Rent Expense Add-back (5) 47,093 46,830 46,338 44,885 44,081
Adjusted Cash Net Operating Income $ 956,446 $ 941,206 $ 856,831 $ 879,624 $ 864,552
(1) Excludes revenues and cash cost of revenues from Packet acquisition, non-IBX assets, APAC and EMEA xScale JVs
(2) Includes revenues and cash costs of revenues from Packet acquisition, non-IBX assets, APAC and EMEA xScale JVs
(3) SG&A costs not directly supporting a regional portfolio
(4) SG&A related to non-IBX assets, APAC and EMEA xScale JVs and integration costs
(5) Adjusted NOI excludes operating lease expenses
© 2021 Equinix.com 46You can also read