Public Transport Selection in Intercity Travel Pre- and Post-Movement Control Order - A Case Study in Kuala Lumpur
←
→
Page content transcription
If your browser does not render page correctly, please read the page content below
Research Article                                                                                                                                 20-23 June 2021

Public Transport Selection in Intercity Travel Pre- and Post- Movement Control
Order - A Case Study in Kuala Lumpur
Irsalina Syahirah IZHAM*,1, Choy Peng NG2, Faridah Hanim KHAIRUDDIN 2, Teik Hua LAW3.
1Centre for Graduate Studies, Universiti Pertahanan Nasional Malaysia, Kem Sungai Besi, 57000 Kuala Lumpur, Malaysia
2Department of Civil Engineering, Faculty of Engineering, Universiti Pertahanan Nasional Malaysia, Kem Sungai Besi, 57000
Kuala Lumpur, Malaysia
3Road Safety Research Centre, Faculty of Engineering, Universiti Putra Malaysia, 43400 Serdang, Selangor, Malaysia

Corresponding Author E-mail:irsalinaizham@gmail.com                     Corresponding Author ORCID: 0000-0001-8467-0906

Keywords                                    Abstract
Intercity Travel,                           Intercity travel has been restricted to breakdown the chain of sporadic Covid-19. Kuala
Mode Choice,                                Lumpur, the capital city of Malaysia has driving the quality service to the socioeconomic in
Covid-19,                                   the country. With the restrictions during lockdown, all public activities and intercity travel
Movement Control Order, Public              prohibited and the socioeconomic becomes downturn. The usage on mode choice in using
Transport.
                                            public transport for travelling intercity has changed. This paper is to investigate the pattern
                                            of mode choice on public transport for travelling intercity to Kuala Lumpur pre- and post-
                                            MCO with the risk exposure of Covid-19. The data collected by questionnaire survey and
                                            analyzed using Stratified Random Sampling Method. Results show that lower risk level of
                                            Covid-19 exposures more likely travelling intercity to Kuala Lumpur and majority choose
                                            bus as the mode choice of public transport. The characteristics of passengers were collected
                                            using demographic factors. This research can improve the socioeconomic to overcome the
                                            downturn during pandemic globalization.

1.Introduction                                                                         as the reduction in the schedule of the public transport services due
                                                                                       to low demand, higher cost in purchasing flight tickets and the work
On 31st December 2019, the outbreak of Coronavirus disease (Covid-19)                  from home policy, are among few factors contributing to the
was initially detected in Wuhan, China. This virus had spread all over                 tremendous decreases in the intercity public transport ridership. The
the world and affected a total of 171 countries as of 26th March 2020                  intercity bus, intercity train and intercity flight usage showed huge
(Roser, 2020). The current mortality rate is 2.2% as of 6th June 2021                  reductions of 49.7%, 51.48% and 42%, respectively (Knoema, MAHF,
(WHO, 2021). Many countries had lockdown including Malaysia to                         2020).
contain the spread of Covid-19. Malaysia has promulgated the
Movement Control Order (MCO)1 in response to Covid-19 pandemic                         Kuala Lumpur is the capital city and federal territory of Malaysia, a
on 18th March 2020 by implementing restrictions including the                          metropolitan area with 8211000 populations in 2021 (Macrotrends,
prohibition for intercity travel.                                                      2021). Highly urbanized in economic development with business hub,
                                                                                       financial, tourism, health and cultural diversity altogether located at
1MCO   is referred to Movement Control Order implemented by the                        the city center of Malaysia. People come to Kuala Lumpur from around
federal government of Malaysia as a preventive measure in response                     the world with many purposes. The economic growth rapidly to the
to Covid-19 pandemic. The regulations also known as lockdown or                        country when they agglomerate in Kuala Lumpur. However, on the
partial lockdown. The order had 4 phases from 18th March 2020 until                    first day of MCO, Kuala Lumpur has 118 of Covid-19 new cases (MOH,
3rd May 2020. The restrictions of intercity travel were prohibited and                 2020). The news sparked the fear to the people as the virus can spread
travelers were allowed to travel 10km in radius from their home                        faster in the environment. With the restrictions during lockdown, all
except for medical purposes and certain conditions.                                    public activities and intercity travel prohibited while the
                                                                                       socioeconomic becomes downturn. In Greece, the travel behavior has
Malaysia is a relatively small country with a total land area of 329,847               changed due to Covid-19 pandemic restrictions (Politis, 2021).
square kilometers. However, Malaysia has extensive road networks
where road density is 0.76 kilometers per square kilometers of land                    Further investigation is needed to overcome the downturn
(Knoema, MAHF, 2020). Total road length is approximately 250,000                       socioeconomic to the country during pandemic. The pattern of public
kilometers with 2,000 kilometers of roads are categorized as                           transport operation for travelling intercity to Kuala Lumpur pre- and
expressway. Meanwhile, Malaysia has approximately 1850 kilometers                      post-MCO have to be controlled. The objective of this research is to
rail roads and 62 airports serving 13 states and 3 federal territories in              identify if there are changes in the public transport usage for intercity
the country (MAHB, 2018).                                                              travel to the capital Malaysia, Kuala Lumpur pre- and post-MCO. The
                                                                                       demographic factors of every passengers also important to study the
During the MCO, intercity and interstate travel were banned in                         trip characteristics during pandemic. The risk exposure of sporadic
Malaysia, where, travelling is only permitted within 10km from home.                   Covid-19 level from passengers’ home region is recorded to determine
This intercity travel restriction imposed in response to break the                     the level of their awareness in using public transport for travelling
chain of Covid-19 had brought radical changes to the intercity public                  intercity to Kuala Lumpur pre- and post-MCO.
transport ridership in Malaysia. A sharp declined in ridership were
observed due to the travel restrictions. Moreover, other factors such
                       PACE 2021- Ataturk University, Engineering Faculty, Department of Civil Engineering, Erzurum, 25030, TURKEY 20-23 June 2021
                                                                                                                                                                   1
IZHAM et al.

2. Research Methodology                                                                                 Table 1. Questionnaire Design Structure

2.1. Flowchart of The Research Methodology                                             Section            Description
                                                                                       1                  Eligibility Screening
                                                                                       2                  Intercity Travel Pattern Pre-MCO
                                                                                       3                  Intercity Travel Pattern Post-MCO
                                                                                       4                  Comparison of Intercity Travel Pattern Pre- and
                                                                                                          Post MCO
                                                                                       5                  Stated Preference Questions
                                                                                       6                  Demographic

                                                                                      First section of the questionnaire structure is the eligibility screening
                                                                                      of the respondents. The survey screening the passengers of 50%
                                                                                      public transport usage for travelling intercity pre-MCO. The
                                                                                      frequency of the respondents for travelling intercity together with the
                                                                                      location they reside pre- and post-MCO were also taken. Second and
                                                                                      third section of the questionnaire structure covered the intercity
                                                                                      travel pattern of the respondents pre- and post-MCO. The intercity
                                                                                      travel distance of furthest, nearest and most frequent to the Kuala
                                                                                      Lumpur using public transport were recorded. The main purposes and
                                                                                      the frequency of the intercity travel using public transport pre- and
                                                                                      post-MCO also collected. Fourth, the intercity travel behavior of the
                                                                                      respondents pre- and post-MCO also compared. This section collects
                                                                                      the information of the attitudes and behaviors in selecting the mode
                                                                                      choice of public transport together with the way in purchasing the
                                                                                      ticket for travelling intercity pre- and post-MCO.

                                                                                      Fifth, the questionnaire structure was constructed to collect the
          Figure 1. Flowchart of the Research Methodology                             stated preference (SP) of the respondents with the Covid-19 risk level
                                                                                      at their home region. The stated preference (SP) here is the WTA and
                                                                                      Wtp of the respondents when using public transport pre- and post-
                                                                                      MCO in terms of risk exposure of sporadic Covid-19. The last section
2.2. Questionnaire Design                                                             of the questionnaire structure is the information of respondents’
                                                                                      demographic as it is important for respondents trip characteristics in
Intercity travel to Kuala Lumpur has affected the socioeconomic in                    travelling intercity pre- and post-MCO. However, this paper is focused
Malaysia due to sporadic Covid-19. The restrictions of MCO have                       on the research objectives to investigate the pattern of public
stopped people to travel intercity. The usage of intercity public                     transport of the respondents for travelling intercity to Kuala Lumpur
transport such as intercity bus, intercity train and intercity flight                 pre- and post-MCO in relating with their exposure of sporadic Covid-
reduced tremendously pre- and post-MCO. The restrictions only                         19 at their home region together with statistics demographic of
allowed to travel within 10km in radius from their home. Here, the                    passengers characteristics.
battle with pandemic may happen prolonged for 2 to 3 years later.
Thus, the public transport system needs to be sustained the business                  2.3. Pilot Study
for the socioeconomic of the country.
                                                                                      The method of data collection with questionnaire design has
Before the Covid-19 pandemic hit the whole world, people never been                   improved by pilot study within 2 months, from September 2020 until
forced to stay at home for a long period and the schedule of public                   October 2020. The interview session of questionnaire survey has
transport never been controlled to be reduced. Besides, all the public                conducted for a small scale before continue with questionnaire
activities never been stopped like today where many businesses have                   design. The respondent’s feedback is important to verify and validate
closed and majority company are going bankruptcy. After many years                    the questionnaire design. A small sample size of 30 students and
later, if this pandemic situation happens again, the economy of the                   colleagues has going through the telephone survey to avoid face to
country will be sparked with huge reduction and loss.                                 face contact with people during pandemic. The session takes about 30
                                                                                      minutes for each of them. The respondents give a positive feedback
The policy maker has to take action to overcome the downturn of                       with good emotion while the interview session is in progressed. With
socioeconomic in Malaysia during pandemic. The reduction of public                    the pilot study, the questionnaire design become more feasible to
transportation services needs to be identified. The usage and the                     further questionnaire survey to achieve the research objectives.
selection of public transport mode pre- and post-MCO important to
control the transportation economy sector. Therefore, this research is                2.4. Questionnaire Survey
going to investigate the pattern of public transport to Kuala Lumpur
pre- and post-MCO. Questionnaire method is the technique used to                      This questionnaire survey was conducted from October 2020 until
collect the passengers’ intercity trips. After many years later, the                  December 2020, using telephone survey method. Prior the telephone
socioeconomic can be sustained although if this situation of pandemic                 survey, the enumerators were trained via Zoom Meeting.
happen again.
                                                                                      Overall, the questionnaire survey has collected 500 respondents of
The structure of the questionnaire design is reflected based on the                   sample size. The sample size distribution according to the regions are
problems, factors and information from the literature review of                       divided into five regions in Malaysia listed in Table 2. This research
previous studies in relating with this research objectives. This                      specifically considers intercity travel from home locations in
research is focused on the pattern of public transport for travelling                 Southern Region, Northern Region, East Coast, Central Region and
intercity to Kuala Lumpur pre- and post-MCO with the Covid-19 risk                    Borneo Region of Malaysia. There are 3 types for the mode choices
of the respondents’ home regions, respectively. The demographic of                    served highly during intercity travel which are air transportation, rail
the respondents also is collected for the respondents’ characteristics.               transportation and land transportation, other than private vehicles.
There are 56 questions with 6 sections altogether as shown in Table 1.                The data collection had to analyze the number of respondents for
                                                                                      travelling intercity to Kuala Lumpur using public transport pre- and
                                                                                      post-MCO. It is related with the individually risk exposure of Covid-
                      PACE 2021- Ataturk University, Engineering Faculty, Department of Civil Engineering, Erzurum, 25030, TURKEY 20-23 June 2021
                                                                                                                                                             2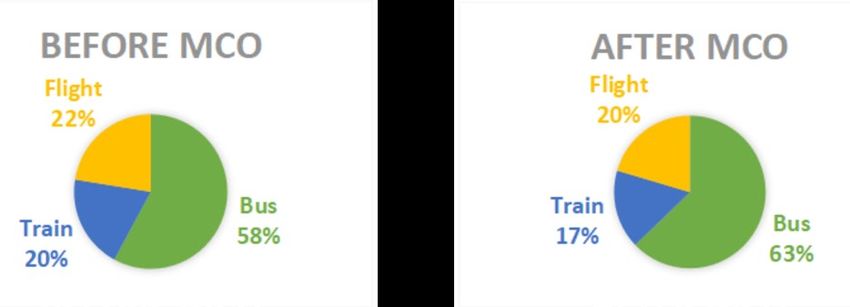
IZHAM et al.
19 from their home region compared to their destination of Kuala
Lumpur. The statistics demographic of the respondents is analyzed.
The data collection is analyzed and distributed using stratified and
random sampling method. After the data analysis, the mode selection
of intercity public transport used pre- and post- MCO to Kuala Lumpur
is observed and further with the discussions.
Table 2. Region States in Malaysia
Region States Sample
Size
Northern Perlis, Kedah, Pulau Pinang, Perak 121
Central Selangor, Kuala Lumpur, Putrajaya, 148
Negeri Sembilan, Melaka
Southern Johor 49
Eastern Pahang,Terengganu, Kelantan 93
Borneo Sabah, Sarawak, Labuan 89
Total 500
2.5. Sampling Method/ Data Collection
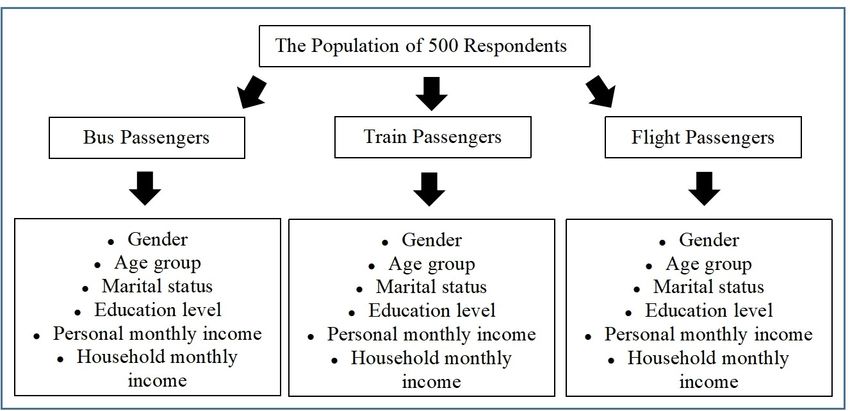
Figure 2. Stratified Random Sampling Method
Stratified Random Sampling Method
3. Results and Discussions
The total of 500 respondents were divided into smaller samples or
strata for completing sampling process as shown in Table 3. The strata Table 4 showed the respondents choice of public transport for
are constructed based on mode choice of public transport when intercity travel to Kuala Lumpur pre- and post-MCO. There were 58%
travelling intercity to Kuala Lumpur in relating with the Covid-19 risk of the respondents, out of 285 respondents, who travelled to Kuala
exposure in respondents home region. The trip characteristics of the Lumpur by bus pre-MCO. The other public transport mode selection
respondents were determined with the strata of gender, age group, were 22% and 20% respectively for flight and train. The number of
marital status, education level, personal and household monthly respondents travelled to Kuala Lumpur using a public transport has
income. The samples were selected proportionally after the reduced tremendously to 194 post-MCO. Meanwhile, the public
respondent’s population have been divided. transport has reduced tremendously to 194 post-MCO. Meanwhile, the
public transport mode distribution were 62%, 20% and 18% for bus,
Table 3. The Strata of Total Populations
flight and train, respectively.
Total First Second Strata Table 4. The Intercity Reduction Pre- and Post-MCO
Population Strata
Gender, age group, marital Public Pre-MCO Post-MCO Reduct Percen
status, education level, t
Bus Transpo Frequ Perce Freque Perce ion
personal and household Reduct
rt ency nt (%) ncy nt (%)
monthly income ion (%)
Gender, age group, marital Bus 165 58 120 62 45 27
500
status, education level,
Respondents Train
personal and household Train 56 20 32 18 24 43
monthly income
Flight 64 22 39 20 25 39
Gender, age group, marital
status, education level, Total 285 194
Flight
personal and household
monthly income
Table 4 showed the usage of public transport for travelling intercity
to Kuala Lumpur has reduced by 32% post-MCO. This was associated
2.6. Data Analysis to the risk exposure of infected with COvid-19 disease while travelling
with public transport (Kwok et al, 2020). Intercity travel using train
The data collection is validated and verified before analysed to find
has the highest reduction of 43% amongst all. This was related with
out the mode choice of public transport for travelling intercity pre-
the decreased in the schedule of train post-MCO as stated in (The Star,
and post-MCO in relating with the risk exposure of sporadic Covid-19
2020). Compared to train and flight, bus usage has the least reduction
from respondents home region. Also, the demographic of respondents
which was only 27%. The reason was that generally bus has more
trip characteristics was determined. The research was analysed using
travel option as compared to train and flight that depend upon the
stratified random sampling method by dividing the total of
service provision that required airport and rail network.
respondents into smaller sample sizes as shown in Figure 2. The tools
of Statistical Package for Social Science (SPSS) Software used in this
experiment regarding to limited timing and to make the sampling
process easier. Lastly, the experiment is further continue with
comparison pattern of respondents in using public transport when
travelling intercity to Kuala Lumpur pre- and post-MCO based on
their demographic distributions, respectively.
PACE 2021- Ataturk University, Engineering Faculty, Department of Civil Engineering, Erzurum, 25030, TURKEY 20-23 June 2021
3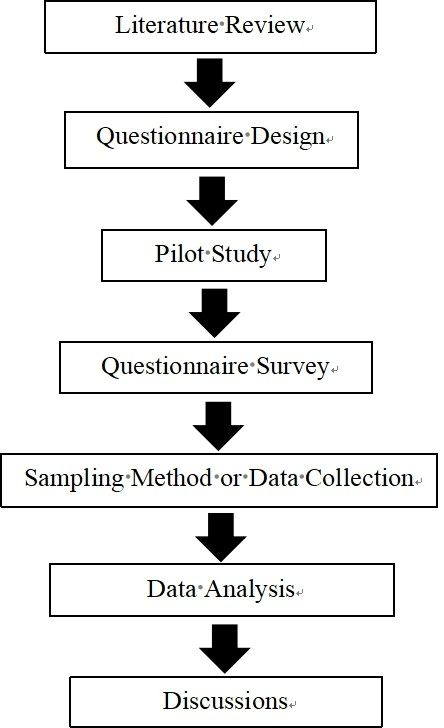
IZHAM et al.

               Figure 3. Intercity Usage Pre- and Post- MCO

Figure 3 showed the comparison of public transport choice to Kuala
Lumpur pre- and post-MCO. Generally, there was a reduction in the
intercity public transport usage to Kuala Lumpur as mentioned                                                 Figure 5. The Gender Distribution
earlier. However, it was clearly shown in the chart that the bus usage
has increased by 5% post-MCO, from 58% to 63%. The reason was that                      The trend in as shown Figure 5 of gender distribution above showed a
generally bus has more travel option as compared to train and flight                    significant difference for passengers who travel intercity using flight
that depend upon the service provision that required airport and rail                   to Kuala Lumpur. In the selection of flight, the gender distribution
network. Intercity bus could operate at remote area which has road                      pre-MCO were 63% versus 38% respectively for male and female. Male
connection. Airports only available in major city while rail network                    in this category of public transport shows the highest passengers
only covered certain location in Malaysia.                                              percentages amongst all pre-MCO. However, the gender distribution
                                                                                        becomes 51% versus 49% post-MCO. This trend shows there is 10%
The Distribution of Demographics                                                        decreasing of male percentages and an increasing of female
                                                                                        percentages while taking flight. It is opposite with the selection of
The selection of mode of intercity public transport to Kuala Lumpur                     mode of bus and train where male passengers are increasing in
is analyze with respect to the demographics factor such as gender,                      percentages compared to female passengers decreasing post-MCO.
marital status, age group, personal monthly income and household
monthly income, education level and Covid-19 risk level. The analysis
show that there is no significant difference in the selection of mode
of intercity public transport pre- and post- MCO for demographics of
marital status, age group and household monthly income.

                                                                                                        Figure 6. The Education Level Distribution

                                                                                        For education level as shown in Figure 6, both lower and higher-level
                                                                                        education showed least significant difference of percentages in
                                                                                        reduction pre- and post-MCO for every category of intercity public
                                                                                        transport to Kuala Lumpur. It shows that the bus has small significant
                                                                                        difference of decreasing in lower education level and increasing
                                                                                        higher education level from 16.97% to 16.67% and from 83.03% to
                                                                                        83.33%. Here, the passengers were keep using bus pre- and post-MCO
            Figure 4. The Covid-19 Risk Level Distribution                              with small significant difference in changes. However, the selection
                                                                                        of flight for lower education level shows increasing in percentages of
Generally, Figure 4 showed the passengers who has lower Covid-19                        selection mode from 19% to 28% which is 10% increment. Meanwhile,
risk level are tend to use the intercity public transport to Kuala                      the higher education level for the selection of flight decreasing for
Lumpur compared to the higher risk level passengers. The                                about 10% from 81% to 72%.
percentages of lower risk level for every category of selection mode
intercity public transport is greater compared to higher risk level. The
greatest percentages of passengers with lower risk was bus for about
78% followed by train about 63% and flight about 62% passengers. The
higher risk level of passengers show the smaller percentages in using
public transport where 23% for bus, 37% for train and 38% for flight.
This pattern shows that the passengers with higher risk level aware
from being infected with the virus of Covid-19. Therefore, they are
more likely reduced in their travelling intercity in using public
transport pre- and post- MCO. Fear of infection and perceived risk also
significantly influence travel behaviors, particularly for transit use,
and the influence varied base on the infected area and demographic
characteristics of the people (Kim et al, 2017, Cahyanto et al., 2016).

                        PACE 2021- Ataturk University, Engineering Faculty, Department of Civil Engineering, Erzurum, 25030, TURKEY 20-23 June 2021
                                                                                                                                                             4
IZHAM et al.
Table 6. The Intercity versus Marital Status
Category Pre-MCO Post-MCO
Frequency
% %
Frequency
Gender
Gender
Single 45 Single 47
Bus 165 120
Married 13 Married 15
Single 14 Single 13
Train 56 32
Married 5 Married 5
Single 14 Single 13
Flight 64 39
Married 8 Married 7
Figure 7. The Personal Monthly Income Distribution
Based on Figure 7, the passengers with no income shows reduction in For the marital status as shown in Table 6, single people passengers
using intercity public transport to Kuala Lumpur pre- and post- MCO. have the same percentages of the selection of mode intercity public
Meanwhile, the selection mode of intercity public transport shows transport for train and flight to Kuala Lumpur. Majority of the single
significant difference for both lower and higher personal monthly passengers used the intercity public transport compared to the
income with increment of percentages for every category pre- and married passengers. However, we can see the percentages of
post-MCO especially for train and flight. The train shows there is passengers decreased except passengers are more lightly to take bus
increasing passengers with more than 5% increment for higher no matter single or married post-MCO. It is because bus has high
monthly income level from 8% to 14% while the flight shows more variety of choice in terms of riding time compared to train and flight.
than 5% increment for lower monthly income from 48% to 56% of
passengers. Here, the passengers are mode demanding in using train Table 7. The Intercity versus Age Group
and flight during pandemic although the ticket price is quite more
Category Pre-MCO Post-MCO
expensive compared to the bus. During Covid-19, passengers being
aware from being infected when travelled from one place to another
place. They have to arrive at the destination before the virus % %
Frequency
Frequency
Age Group
Age Group
spreading faster if there is an individual get infected. Therefore, the
passengers tend to choose the train and flight for faster journey as
their mode choice of intercity public transport compared to the bus.
30 yrs 12
old old
30 yrs 4
old old
Male 22 Male 27
Bus 165 120 30 yrs 7
Female 14 Female 13 old old
Male 14 Male 10
Flight 64 39
Female 8 Female 10 Demographic reduced in using intercity public transport to Kuala
Lumpur post-MCO. However, the bus has the highest in percentages
in usage post- MCO among others as the selection of mode choice.
Based on Table 5, generally, the number of passengers taking the Passengers are tend to use bus compared to train and flight. The
intercity public transport in 2020 to Kuala Lumpur has decreased. young adults group from 23 years old to 30 years old shows the
However, we noticed that male passengers are more lightly to take bus highest percentages followed by below 23 comes from the students
compared to female while female is more lightly to take flight post- which are below 30 years old. During pandemic, the students are more
MCO. There is increasing in trend to male in choosing bus while preferred taking bus for intercity travel especially when they
female in choosing flight as the selection of their mode choice of returned to their colleges. This is because majority buses will send
public transport. them directly in front of their colleges even before the world
experienced the global diseases of Covid-19. With the outbreak of
Covid-19 nowadays, majority the buses are not allowed to stop at any
stations so the passengers are not expose to the environment. It
PACE 2021- Ataturk University, Engineering Faculty, Department of Civil Engineering, Erzurum, 25030, TURKEY 20-23 June 2021
5IZHAM et al.
different when compared with train and flight where the passengers Table 9. The Intercity versus Personal Monthly Income
have to grab other public transport or private transport when they
arrived at the stations and this can expose them to the surroundings. Category Pre-MCO Post-MCO
Table 8. The Intercity versus Education Level
% %
Frequency
Frequency
Category Pre-MCO Post-MCO
Personal
Personal
Monthly
Monthly
Income
Income
% %
Frequency
Frequency
No 24 No
Education
Education
24
Income Income
Lower 31 Lower
Level
Level
Bus 165 120 35
Income Income
Lower 10 Lower 10 Higher
2 Higher
Bus 165 120 Income 3
Income
Higher 48 Higher 52
No 7 No
5
Lower 2 Lower 1 Income Income
Train 56 32 Lower 11 Lower
Train 56 32 10
Higher 18 Higher 17 Income Income
Higher
2 Higher
Lower 4 Lower 6 Income 3
Income
Flight 64 39
Higher 18 Higher 14 No 7 No
5
Income Income
Flight 64 Lower 11 39 Lower
11
Income Income
For education level as shown in Table 8, the passengers with higher Higher 5 Higher
4
education level showed the greatest percentages in choosing the Income Income
selection mode choice of intercity public transport to Kuala Lumpur
pre- and post-MCO. Results showed that the bus traveler increases the
For the household monthly income as shown in Table 10, majority of
percentages of performing intercity trips while there was also
passengers reduced in travelling intercity to Kuala Lumpur except for
increasing in the passengers percentages for lower education level in
the bus has increasing in the percentages among others of intercity
choosing flight as their selection of mode choice. We can say that
public transport pre- and post-MCO. Also, there is increasing in
people have been educated are more likely choosing bus because as
passengers in using train from the passengers with RM7500 and
we know bus is more accessibility. Malaysia has a good road network
above of monthly income during pandemic. Here, the passengers are
so people are easy to get the bus for intercity travel compared to bus
more likely choosing bus because the train and flight has reduced the
and train. People can get the bus everywhere without worrying about
schedule. The schedule of bus has more choice when compared to
the trips during pandemic. When compared to train and flight,
train and flight. It is because train and flight have limited schedule
railway and airport is the way of train and flight to move to complete
post-MCO. So for those who rent a house and stay together, they may
the journey. People still have to learn and make time to take these
have plan for leaving the house and pick up the public transport
transportation especially they need to follow a lot of SOP during
especially during the Covid-19 pandemic.
pandemic. So the bus is the only way that is easy for them to access
during pandemic. So the bus is the only way that is easy for them to
access and follow the SOP while travelling intercity.
Based on Table 9, for personal monthly income demographic, the
passengers with no income are reduced in travelling to Kuala Lumpur
pre- and post- MCO. Also, their percentages in selection of mode
choice of intercity public transport also decreasing. Meanwhile, the
lower monthly income passengers of bus and flight increasing in
percentages post-MCO. Here, we can see both lower and higher of
personal monthly income are increasing in choosing bus as the
selection of mode choice of intercity public transport. For individual
monthly income either lower income or higher income, they are more
likely choosing bus because the bus ticket price are reasonable and
affordable for travelling intercity. This is because majority of them
only have to pay once for the bus ticket only where the bus ticket is
cheaper when compared to the train and flight. During pandemic, the
tickets for train and flight are highly in producing but low in
demanding. Thus, the ticket price for train and flight are highly in
producing but low in demanding. Thus, the ticket price for train and
flight becomes more expensive when comparing with the bus.
PACE 2021- Ataturk University, Engineering Faculty, Department of Civil Engineering, Erzurum, 25030, TURKEY 20-23 June 2021
6IZHAM et al.
Table 10. The Intercity versus Household Monthly Income
Category Pre-MCO Post-MCO Declaration of Conflict of Interests
The authors declare that there is no conflict of interest. They have no
Frequency % % known competing financial interests or personal relationships that
Frequency
could have appeared to influence the work reported in this paper.
Personal
Personal
Monthly
Monthly
Income
Income
Below 32 Below 32 References
RM5000 RM5000
RM5000 14 RM5000 16 [1.] Abdullah J.M., Wan Ismail, W., Mohamad I., Ab Razak, A., Musa, K.
Bus 165 to 120 to I., & Lee, Y.Y.(2020). A
RM7499 RM7499 Critical Appraisal of COVID-19 in Malaysia and Beyond . The
Above Above Malaysian journal of medical sciences : MJMS, 27(2),
RM7500 RM7500 1-9.
https://doi.org/10.21315/mjms2020.27.2.1.
Below 12 Below 13
RM5000 RM5000 [2.] Bongaarts, J. (2016). World Health Organization Organization
RM5000 9 RM5000 7 Health in 2015: From MDGs, Millennium Development
Train 56 to 32 to Goals, to SDGs, Sustainable
RM7499 RM7499 Development Goals Geneva: WHO Press, 2016. 212 p. $60.00 (pbk).
Above 5 4 Population and Development Review,
Above
RM7500 42(3), 575-575. doi:10.1111/padr.12006
RM7500
Below Below [3.] Cahyanto, I., Wiblishauser, M., Pennington- Gray, L., & Schroeder,
RM5000 RM5000 A. (2016). The dynamics of travel avoidance: The case of Ebola in
RM5000 5 RM5000 7 the US. Tourism Management Perspectives, 20, 195- 203.
Flight 64 39
to to
RM7499 RM7499 [4.] Kim, C., Cheon, S. H., Choi, K., Joh, C. H.,
Above 8 Above 7 & Lee, H. J. (2017). Exposure to fear. Changes in travel behaviour
RM7500 RM7500 during MERS outbreak in Seoul. KSCE Journal of Civil
Engineering, 21(7), 28888-2895.
4. Conclusions [5.] Kwok, K. O., Li, K. K., Chan, H. H., Yi, Y.
Y., Tang, A., Wei, W. I., & Wong, Y. S. (2020).
In conclusion, the category of intercity public transports for the Community responses during the early phase of the COVID-19
selection mode choice shows that the bus is increasing in percentages epidemic in HONG Kong: risk perception, information exposure
of passengers pre- and post-MCO. It is because passengers are more and preventive measures. MedRxiv.
likely choosing bus as the mode choice of intercity public transport
pre- and post- MCO. Generally, the bus has a convenient and [6.] Politis, I., Georgiados, G., Papadopoulos, E., Fyrogenis, I.,
comfortable seats with wide space individually when compared with Nikolaidou, A., & Verani, E. (2021). COVID-19 lockdown measures
train and flight for individual so passengers are protected from being and travel behavior. The case of Thessaloniki, Greece.
infected during pandemic. The schedule of bus has more choice when Transportation Research Interdisciplinary Perspectives, 10,
compared to train and flight. It is because train and flight have limited 100345.
schedule post-MCO. Bus has high variety of choice in terms of riding
time compared to train and flight together with more who cheaply and [7.] Kuala Lumpur, Malaysia Metro Area Population 1950-2021. (n.d.).
Retrieved June 14, 2021,
affordable ticket price compared to train and flights. Lastly, when
fromhttp://www.macrotrends.net/cities/206411/ku ala-
then train and flight reduced the number of schedule, the air tickets lumpur/population
become increasing highly in price due to higher in supplying tickets
but lower in demanding flights usage as mode selection of public [8.] Malaysia Road density, 1990-2020. (n.d.).
transport. Retrieved June 14, 2021, from
http://knoema.com/atlas/Malaysia/Road-density
Therefore, the results can help to sustain the economy of the country
especially the system of intercity public transport to Kuala Lumpur, [9.] Online, T. S. (2020, March 21). Covid-19: KTM reducing frequency
Malaysia. This research can contribute to the loyalty of passengers as of trains during MCO. Retrieved June 14, 2021,
users. People also can adapt with the new norm and new lifestyles of from https://www.thestar.com.my/news/nation/2020/03/
pandemic even if it is prolonged for 2 to 3 years. Action of 22/covid-19-ktm-reducing-frequency-of-trains- during-mco
governments is needed for pre- and post- MCO of transportation
sector strategies to further boost induced supply and demand. Good [10.] Our Airports. (2021, May 19). Retrieved June
actions remain for sustaining the management of mobility policies 14, 2021, from
during sporadic Covid-19 pandemic. http://222.malaysianairports.com.my/about- us/corporate-
profile/our-airports.
[11.] 19 Malaysia Updates. (2020, May 5).
Retrieved June 14, 2021, from http://covid- 19.moh.gov.my/
Acknowledgement
This research was funded by the Ministry of Higher Education
Malaysia under the Post Covid-19 Special Research Grant. Its contents
are solely the responsibility of the authors and do not necessarily
represent the official views of the Ministry of Higher Education
Malaysia.
PACE 2021- Ataturk University, Engineering Faculty, Department of Civil Engineering, Erzurum, 25030, TURKEY 20-23 June 2021
7You can also read