Proudly presenting property market insights in real-time - MARCH 2022
←
→
Page content transcription
If your browser does not render page correctly, please read the page content below
M A R C H   2 0 2 2

Proudly presenting property market insights in real-time

MESSAGE FROM OUR
        MANAGING DIRECTOR

    While there continues to be uncertainty and volatility in many aspects of our lives, overall it’s been a strong start to the
    year across the real estate markets in which we operate. For the first time in a few years however, there are differences
    between markets. Some are experiencing continued momentum, while the amount of property sold in some markets has
    declined from 2021 peaks.

    We set another sales record in February with $7.1 billion in unconditional sales, and all Australian residential markets
    were higher than February 2021. In New Zealand, we experienced less trading activity overall when compared to the
    same month last year, and that market is experiencing different dynamics to those in Australia. Overall, we helped more
    than 20,500 buyers and sellers realise their property dreams during the month. Interestingly, while the value of property
    sold was four per cent higher than last February, the number of properties sold was 10 per cent lower, illustrating the
    increase in the median price of property sold.

    Overall, there are more properties on the market than this time last year. About 10 per cent more, and it’s pretty consistent
    across Australia and New Zealand. Some Australian markets, including Queensland and South Australia, are witnessing
    more sales, while other Australian states and New Zealand are experiencing declining number of sales. Apart from the
    past few years, these differences between markets have always been a feature of our markets, and so it’s a return to
    more normal conditions.

    There are many current and upcoming economic and political issues being discussed that many consider will influence
    the outlook for the real estate markets. Some are predicted to put downward pressure on the market, such as the chance
    of increasing interest rates, potential for further inflation and upcoming elections. Some should have the opposite effect,
    being the return of immigration and the attraction of investing in ‘hard assets’ (such as real estate) in uncertain times.

    All of these considerations underline the importance to all property owners of accessing relevant and timely information
    on what’s happening in their area. Nothing is more dangerous than generalising property market information.
    Furthermore, once a property is on the market, a strong marketing strategy and an active strategy to maximise competition
    is essential to ensure nothing is taken for granted and the best possible result is achieved. All of our members welcome
    these discussions with the customers.

2
Finally, our thoughts and support are with our members and communities impacted by recent flooding in Queensland and
New South Wales. We recently hosted a live webinar to help our customers understand the impact of what’s happening
on the ground in the flood affected areas, what our members are doing for their impacted communities, and how as a
group we’re providing direct financial support. We’ve have kick-started our fundraising platform that was born out of the
2020 bushfires, Beyond the Bricks.

If you would like to join our fundraising, go to www.raywhite.com/beyondthebricks/ to donate to GIVIT, The Salvation
Army, St Vincent de Paul’s flood appeal, WWF’s emergency flood appeal supporting the rescue and care of flood-affected
animals or the Australian Red Cross. We could not be prouder of the work so many of our members have done for
their communities.

Dan White
Managing Director
Ray White

                                                                                                                            3
R AY W H I T E N O W
        THIS MONTH
    Thankfully, the worst of COVID-19 appears to now be over. For property markets however, things have become a lot
    more complicated and this will influence both prices and rents over the next 12 months. Positively, our economy is firmly
    in growth mode and international borders have reopened. There is, however, a growing likelihood of interest rate rises
    and restrictions to finance. Flooding is impacting large parts of the eastern seaboard and construction costs are rising
    rapidly. While at the start of 2021, there was consensus around what would happen to house prices, this year it’s harder
    to predict.

    This month in Ray White Now we take a look at what you should consider if you’re looking to sell and detail what the
    main influences will be on the market. Now it isn’t all about COVID-19 but about many other changes that have been
    occurring and are expected to occur later in the year.

    We also take a light-hearted look at some major real estate rivals around Australia and look at who the winners are in
    each state. While there are many types of rivals - businesses, people and even properties - as an economics team we
    have decided to stick to geographic areas. While Melbourne v Sydney is one of the main rivalries, we look a bit closer at
    rivalries within capital cities and close-by regional areas.

    Finally, we have a look at coastal office markets - the regional move to coastal markets hasn’t just been people, it’s also
    been businesses. This is having interesting impacts on vacancy rates at a time that many CBD office markets are seeing
    rising vacancy.

    We hope you enjoy this month’s Ray White Now.

    Nerida Conisbee
    Chief Economist
    Ray White

4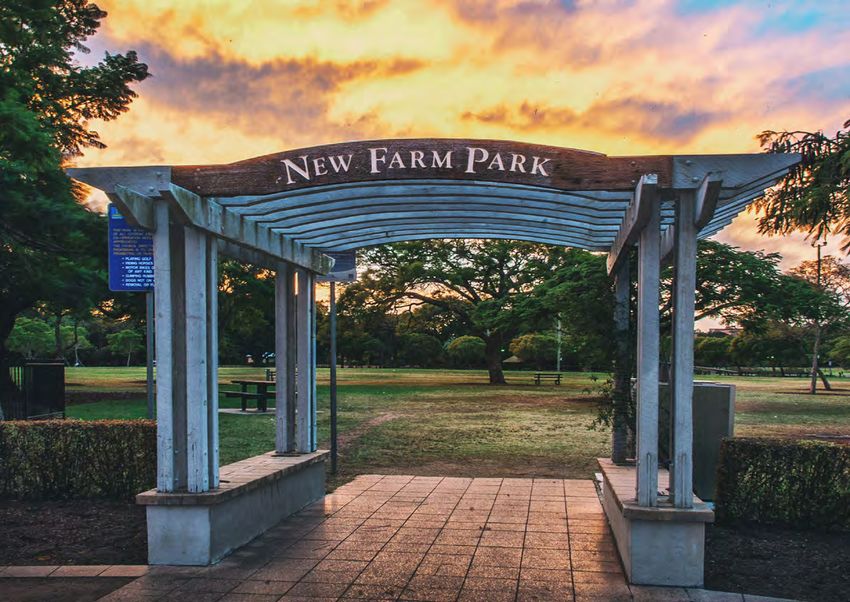
CONTENTS
7.    Why sell now?

15.   Real estate rivals - which ones have performed
      the best through the pandemic?

      16.    Bondi vs Manly

      18.    South Yarra vs North Fitzroy

      20.    Gold Coast vs Sunshine Coast

      22.    New Farm vs Ascot

      24.    Hobart vs Launceston

      26.    Glenelg South vs Unley

      28.    Canberra - North side vs South side

      30.    Cottesloe vs Scarborough

32.   The growth in Australian coastal office markets

34.   About Ray White

35.   Ray White Economics team

                                                        5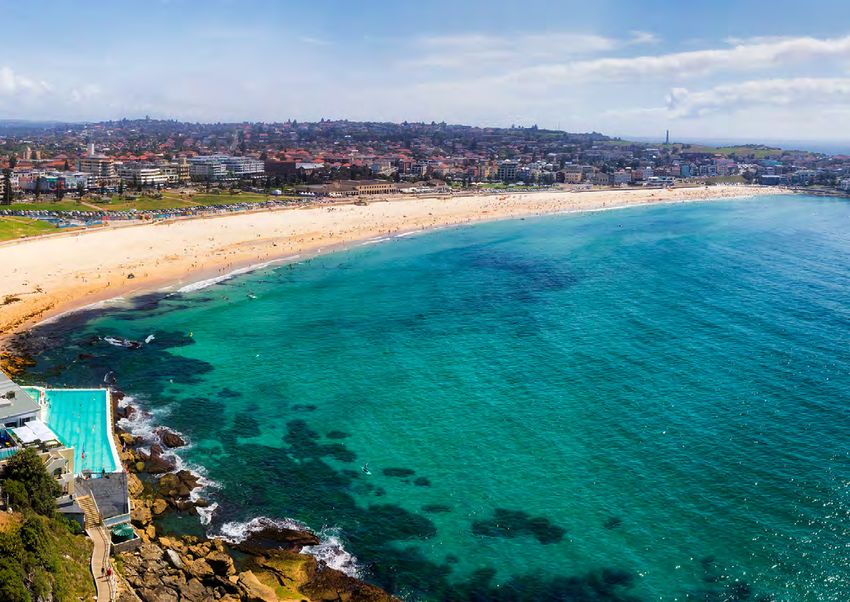
6
WHY SELL NOW?
The main event looming on the near-term horizon that may accelerate any slow down phase is if the central bank adjusts
monetary policy sooner rather than later. The Reserve Bank of Australia (RBA) has maintained the official cash rate at a
record low 0.1 per cent since November 2020, in addition to its quantitative easing program that has injected more than
$400 billion into the economy through the recession.

It’s clear the RBA is firmly focussed on inflation outcomes along with labour market conditions and wages growth, to guide
their policy decisions. Financial markets and economists believe inflation pressures will force the RBA to start normalising
rates by August, ahead of spring selling season. Higher interest rates will slow economic growth, the jobs market, and housing
to keep inflation under control.

While inflation “has picked up more quickly than the RBA expected”, the central bank is not ready to conclude that inflation
will remain sustainably within their 2-3 per cent target range. Uncertainty related to the war in Ukraine, rising energy costs
and global supply chain disruptions are adding further complexity to the policy environment.

While the unemployment rate is trending towards the sub four per cent range, a more significant lift in wages remains
the missing piece of the puzzle before the cash rate shifts higher. The RBA notes wages growth has picked up (the wage
price index was up 2.3 per cent last year) and expects wages to rise further under tight labour market conditions, but the
RBA anticipates growth in wages will be only gradual.

Despite the growing downside risks to the housing sector, other factors should help to offset a significant downturn.
As the economy strengthens and labour markets tighten, the risks around mortgage stress or default should lessen.
Open international borders will help to support demand, initially from a rental perspective, but longer term for home
purchasing as well.

The number of properties for sale will also increase over 2022 which creates more choice for buyers. What we do know
is that market fundamentals right now are still helping our clients who are looking to sell. Our data tells us that our sellers
who choose to sell via the auction method are rewarded with a 12 per cent higher price under the hammer than if they’d
accepted a prior offer.

Since the start of 2022, our group booked 4532 auctions, a 50 per cent jump on the prior year. We cleared 81 per cent of
all auction stock under the hammer, with an average of 5.8 registered bidders. There’s a deep buyer pool for sellers to take
advantage of right now. Our question remains, “What are you waiting for?”

                                                                                                                                  7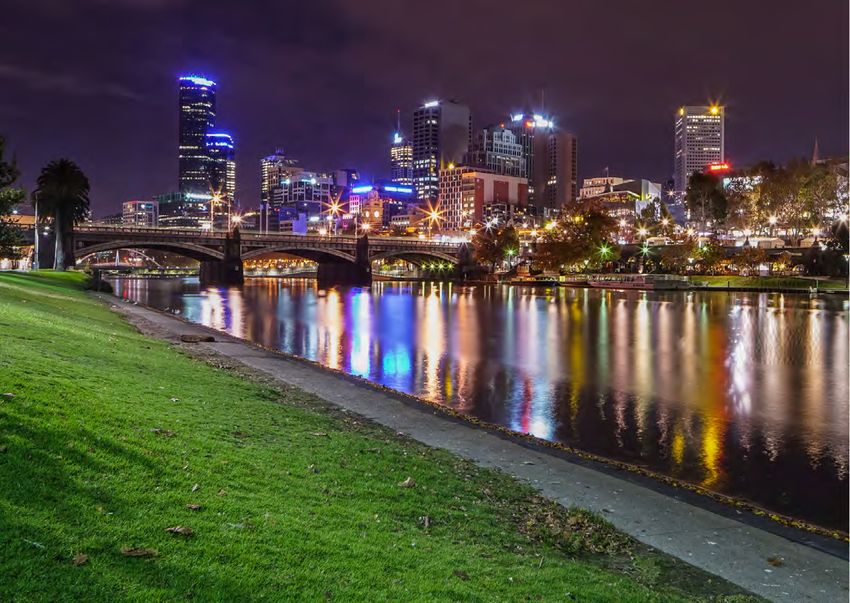
As the pandemic becomes endemic, what are the main influences on Australian property now?

    Is the pandemic over? Likely not by a long shot but there has certainly been a change in how our economy operates
    over the past month - fewer masks, retreating threats of lockdowns and less front page news on COVID-19 cases.
    While COVID-19 is no longer the main influence on the market, the outlook is in some ways becoming more complicated.
    There continues to be a lot of uncertainty around finance, particularly the outlook for interest rates and restrictions
    to finance. Positively, international borders are now open however there are problems - recent floods and skyrocketing
    construction costs being the main ones. And to make things even more complicated, we will have a federal election this year,
    the date is yet to be determined and we’re yet to hear any major policy changes. This year, we’re in a very different stage of
    the cycle. Prices are slowing already in our biggest cities, while rents continue to rise. Smaller cities are now benefiting from
    affordability and strong economic growth. In 2022 price growth will continue but we’re looking at a very different market
    to the turbocharged conditions of last year.

    1. Inflation and interest rates

    This month interest rates remained on hold and the RBA announced that they were prepared to be patient in their
    handling of monetary policy. This comes at a time when inflation looks like it will continue to rise and there continues to
    be significant global uncertainty.

    It’s likely that the RBA will wait until at least the March quarter inflation figures have been released to get a better idea
    as to how much prices are rising. The latest inflation figures for the December quarter showed that inflation was still
    at manageable levels (3.5 per cent in the December quarter) but there is continued pressure on pricing. The December
    quarter figures were boosted by construction costs and fuel. Both of these continue to get more problematic.

    Construction cost hikes are having big impacts on the building industry. Meanwhile oil prices keep rising, and have been
    made worse by the Ukraine/Russia conflict. Crude oil has hit $US100 per barrel and is expected to continue to rise.
    While this has led to significant petrol price rises for Australian consumers, our lower reliance on Russian gas and less
    Government stimulus has meant that our inflation rates remain lower than many other parts of the world - e.g., US at
    7.5 per cent and UK at 5.5 per cent.

    Fundamentally, an Australian interest rate rise will do little to prevent oil prices rising and will have a limited impact on
    construction costs. It will, however, slow the economy which would hopefully go some way to slow price growth.

8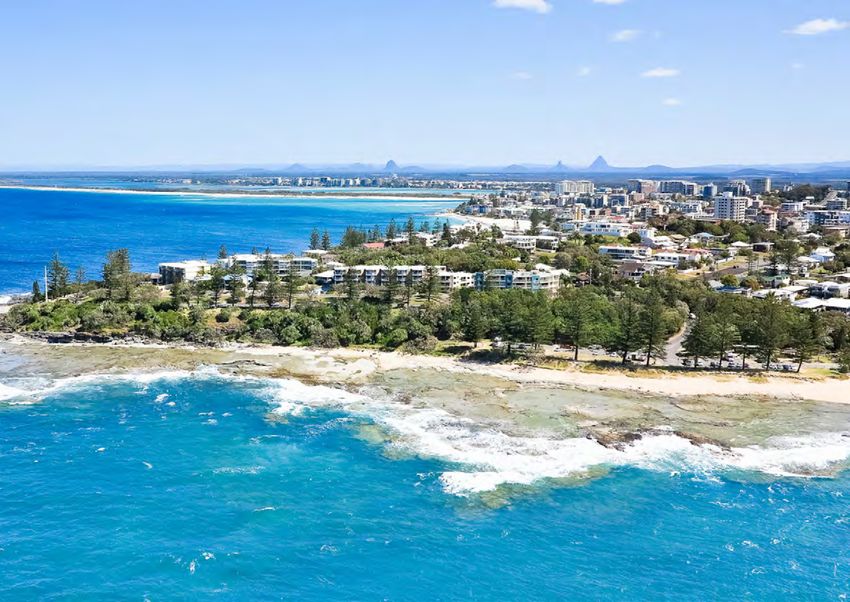
2. Restrictions to finance

Home loan lending dropped in October but since then has come roaring back to hit a record high in January of
$33.7 billion. While investor lending continues to increase, the big surprise has been the return of the particularly high
levels of owner-occupier lending. This level dropped significantly following the end of HomeBuilder and a withdrawal
of first home buyers. First home buyer activity has dropped over 30 per cent however there are now more upgraders
taking out bigger loans.

The first set of restrictions were put in place in November 2021, however were relatively mild and appeared to have had a
minimal impact on home loan lending. At this point, we’re yet to hear of any more potential changes but given the continued
rise in home loan lending, it’s possible we will in the coming months.

                                                                                                                              9
3. International borders reopen

     While the opening borders are great news for anyone wanting to travel overseas again, it’s also particularly positive to
     our economy.

     Australia’s strict quarantine restrictions kept us safe during the worst of the pandemic but it wasn’t great for our economy.
     Our education sector has suffered from a lack of international students. In apartment markets close to universities,
     we saw high vacancy rates and worst of all, we’re continuing to see employee shortages across a wide range of industries.

     Open borders will initially mean rental increases. People migrating to Australia, or coming here to study, will typically
     rent - at least initially. While this is good news for tenant starved markets like Melbourne CBD and Parramatta, it’s less
     positive for places like south east Queensland which was already seeing rental shortages prior to the floods.

     Following rental rises, it’s likely that foreign investors will also return. This will partly be driven by better rental increases
     but also because of the ability to travel to Australia. Rental rises and foreign buyers returning will be two things that
     kick-start the next construction cycle, particularly for apartments.

     4. Upcoming federal election

     We still don’t have an election date and we still don’t know exactly what policies will be proposed by either party with
     regards to housing. It’s likely that given how much house prices and rents have increased over the past 12 months,
     as well as the withdrawal of first home buyers, that affordability will be the hot topic.

     Trying to solve affordability is complicated. Increasing supply of housing is the gold standard when it comes to creating
     enough homes for the people that want to live in them however building homes where people want them is not easy.
     Construction costs, land availability and existing resident pushback are some of the challenges faced when trying to
     build more homes in desirable suburbs.

     At this stage, it seems unlikely that investors will be a target in the same way they were in the last federal election.
     Right now, we have a rental crisis in many parts of Australia, something that will only get worse once population growth
     starts up again. Restricting rental housing at this time doesn’t make sense - although it would help many first buyers get
     into the market, it would lead to even greater rises in rents which impacts young people and those on lower incomes
     more heavily.

10
11
12
5. Floods

This month, flooding impacted large parts of the eastern coast of Australia, spreading down from Brisbane to Sydney.
Looking back at previous natural disasters, we can see a fairly consistent timeline as to what happens to the market.
Initially, rents start to rise as there is a shortage of homes available for people that need to repair or rebuild their homes.

In the 12 months following the natural disaster there are usually far fewer sales taking place, particularly if owners in the
area are well insured and there’s significant government support to rebuild the area. By the three year mark, homes have
been rebuilt and ideally there will have been significant government spending to minimise the chance of a similar event
occurring. Home values typically increase as better and safer homes are built in place of older homes.

Within five years, provided the natural disaster hasn’t re-occurred, house price growth is typically following the local
market or is being driven by other factors such as population growth.

6. Rising construction costs

Rising construction costs were a major contributor to inflation in 2021. And at this point, it doesn’t look like this growth
will slow anytime soon. There are a lot of problems that will take some time to solve including:

1.   Supply chains are blocked and this is pushing up prices of imported goods, and also restricting supply.

2.   Timber prices have gone up significantly as a result of bushfires. In New South Wales, half the state’s timber
     plantations were impacted and this is now resulting in significant shortages.

3.   Labour shortages are a problem and it will take some time to get migration back to levels to solve this.

4.   Increasing demand for building is coming at a time of restricted supply - HomeBuilder led to a flood of
     new projects, we have seen record approvals for home renovations over the past 12 months, major infrastructure
     projects such as the Olympic Games are creating greater demand. Most recently, the floods will require more
     builders in the clean up and rebuild of impacted areas.

We’re already seeing the fallout from this. ProBuild has gone into administration and a number of smaller home
builders are having trouble with fixed price contracts that were put in place last year. We’re going to need more
housing once borders reopen, however it will take some time for new projects to be completed as a result of this,
prices and rents will be further pushed up.

                                                                                                                                  13
14
R E A L E S TAT E R I VA L S - W H I C H
O N E S H AV E P E R F O R M E D T H E
B E S T T H R O U G H T H E PA N D E M I C ?
There are many real estate rivals in Australia - Domain v realestate.com.au,
Corelogic v Pricefinder, Melbourne v Sydney, Ray White v no one. This month we say
goodbye (hopefully) to two years of COVID-19 badness and take a look at some of the
main geographic real estate rivals to see how they pulled up following one of the biggest
property booms Australia has ever experienced.

                                                                                            15
BONDI VS M A N LY 16
B O N D I V S M A N LY
Traditionally, Bondi is the younger and cooler cousin to Manly’s
more laid-back style. And this shows up in the demographics of the two
suburbs. Manly residents are older, there are more families and incomes
are slightly higher. The age difference shows up in the number of renters
- residents of Bondi are more likely to rent while Manly residents are
more likely to own their homes outright.

When it comes to property performance, Manly houses and units
have outperformed Bondi for price growth over the past 12 months.
Manly’s house price median currently sits at $4.4 million, having increased
by 43 per cent over the past 12 months. Meanwhile, Bondi house prices
have increased a lot too, but slightly less than Manly at 32 per cent and
now has a median of $3.9 million. The unit discrepancy is currently at
$1.8 million median for Manly compared to $1.4 million for Bondi with
price growth sitting at 20 per cent for Manly compared to 18 per cent
for Bondi.

The younger demographic in Bondi is demonstrated by stronger rental
growth compared to Manly, as younger people are more inclined to rent.
Rental prices for Bondi houses have increased by 10 per cent compared
to Manly at one per cent. Unit rental prices in Bondi have also seen an
increase - eight percent compared to Manly’s three percent. Interestingly
though, average weekly rents for units are the same in Bondi and Manly,
despite Manly units being more expensive to buy.

Winner - Manly. Bondi has youth on its side and it would be easier
to find a tenant for your rental, but price growth has been better
for Manly.

                                                                              17
SOUTH YA R R A VS NORTH F I T Z R OY 18
S O U T H YA R R A V S
N O R T H F I T Z R OY
Both South Yarra and North Fitzroy attract a similar demographic -
young, aspirational and with high income earning potential. While age
and income are almost identical between the two suburbs, so too are
rental rates for both houses and units. Historically, North Fitzroy has
been the more grungy alternative north of the Yarra but things have
levelled up over the past decade. So how have the two performed
during the pandemic?

For houses, South Yarra is still more expensive with a $2.1 million
median compared to North Fitzroy’s $1.7 million. South Yarra’s
house prices have risen more quickly over the past 12 months - up
10 per cent compared to North Fitzroy’s eight per cent. Units, however,
are a lot cheaper in South Yarra at $600,000 median compared to
$785,000 in North Fitzroy - this discrepancy has been driven by
more active developers in South Yarra. Planning is reportedly more
complicated in Melbourne’s north and this is a main factor keeping
prices a lot higher.

Winner - South Yarra for houses and North Fitzroy for units.

                                                                          19
GOLD COAST VS SUNSHINE COAST 20
GOLD COAST VS
SUNSHINE COAST
Both the Gold Coast and the Sunshine Coast now have a house price
median surpassing Melbourne driven by a lot of movement out of capital
cities, as well as strong demand for holiday homes. Latest data from the
national statistician on population growth shows that both are growing
at a similar percentage rate, however the Gold Coast has a much younger
demographic and as such, natural increase is playing a greater role in
this growth. The Sunshine Coast’s population growth is driven almost
entirely by movement from other parts of the country.

In terms of price growth, the Sunshine Coast is the stronger performer
for both houses and units. This is also the case for rents. This greater
strength in growth mainly reflects the source of population growth.
The Sunshine Coast is growing because a lot of people are moving from
Sydney and Melbourne, as well as increased holiday homes from this area.
This is more closely recalibrating prices to these more expensive cities.

Winner - Gold Coast. Sunshine Coast prices are moving quicker but
Gold Coast remains a more affordable option for locals and first
home buyers.

                                                                            21
N E W FA R M VS ASCOT 22
N E W FA R M
VS ASCOT
Which is Brisbane’s most prestigious suburb? If you went
by price, it would now be New Farm with pricing having
overtaken what was Brisbane’s most expensive - Ascot -
over a decade ago. However, while New Farm was seen
as the younger person’s more affordable alternative to
Ascot, this has now changed. Ascot now has fewer people
over 65 years than New Farm, resulting in a younger
median age.

Twenty years ago, Ascot was much more expensive
than New Farm with median prices 30 per cent above.
Now, both suburbs have medians that are very close
together - $2 million for Ascot and $2.2 million for
New Farm. But while New Farm has been slightly more
expensive for some time now, over the past 12 months,
Ascot has seen stronger price growth up 37 per cent
compared to New Farm’s 25 per cent.

Winner - New Farm has been a winner for a while but it
looks like the tide is turning back for Ascot.

                                                           23
HOBART VS LAUNCESTON 24
HOBART VS
LAUNCESTON
Hobart has seen the strongest price growth of any
capital city over the past 20 years, moving it from
being the cheapest capital city to the fourth most
expensive. With a median now at $770,000, it certainly
is no longer a bargain to buy into and as a result,
more interest has been taken in other parts of Tasmania,
in particular Launceston.

Launceston’s price growth outpaced Hobart over the
past 12 months, but still remains a lot cheaper with a
median of $475,000. It’s also been experiencing stronger
price growth. In addition, rental growth in Launceston is
now double that being experienced in Hobart.

Winner - with Hobart getting very expensive, now is
the time to look at Launceston.

                                                            25
GLENELG SOUTH VS UNLEY 26
GLENELG SOUTH
VS UNLEY
Would you prefer to live beachside or in a leafy inner suburb?
In Adelaide, both are available within a relatively short distance
from each other. Beachside Glenelg South is one of the nicest
beachside suburbs in Adelaide and has a median price to match.
However, as a place to live it’s however rivalled by beautiful leafy
inner suburban Unley.

10 years ago, Unley was the most expensive suburb however,
since then, the desirability of beachside living has grown significantly
in Adelaide. Glenelg South is now more expensive than Unley with
a median price of $1.8 million compared to Unley’s $1.5 million.
Over the past 12 months, however, Unley has seen slightly higher
price growth - 61 per cent compared to Glenelg South’s 53 per cent.

The demographic profile of the two suburbs is quite different. Unley has
a lot more younger families and is more wealthy. Glenelg South
meanwhile has a much older median age. It appears that while Unley is
a well established premium suburb, Glenelg South is still in transition
from an ageing population to attracting a far younger demographic.

Winner - Unley is lovely but the desirability of beachside living is
only going to grow, making Glenelg South the winner.

                                                                           27
NORTH SIDE VS SOUTH SIDE 28
CANBERRA -
NORTH SIDE
VS SOUTH SIDE
Pretty much every city has a north/south or east/west divide.
In the case of Canberra, it is definitely a case of north of
Lake Burley Griffin versus south. From the outside looking
in, both sides offer a high degree of livability. North has the
light rail and great views from Mt Ainslie while south has
Parliament House and the majority of galleries. As many parents
know, south also has Questacon. Northside has slightly lower
incomes but a much younger population. Southside is more
expensive and people are a lot older.

In terms of price, Canberra’s south has more very
expensive suburbs. Of the top 10 most expensive for houses,
seven of them are located in South Canberra and there are
no suburbs with medians over $2 million northside. Over the
past 12 months, South Canberra also dominates the list of
strongest house price growth suburbs - of the top 10 suburbs
seeing the biggest jump in median house prices, eight of them
are south side.

For units, things are a little different. Canberra’s north
dominates the top 10 suburbs for price growth. The mix of
the most expensive unit markets are also more evenly mixed
between north and south.

Winner - north side - a younger population and not so
expensive housing makes this area more vibrant but if you
want price growth and prestige, head south.

                                                                  29
COTTESLOE VS SCARBOROUGH 30
COTTESLOE VS
SCARBOROUGH
In Perth, it’s a battle of the beaches with highly popular and
expensive Cottesloe up against the far more affordable
Scarborough. In terms of pricing, the difference is stark - the
median for Cottesloe currently sits at $2.4 million compared to
Scarborough’s $820,000. And while both suburbs have seen
strong price growth, Cottelsoe’s price growth is far stronger at
24 per cent over the past 12 months compared to 12 per cent
for Scarborough.

While buyers are pushing up prices in Cottesloe more, renters
appear more keen on the more affordable Scarborough.
While rents are a lot cheaper in Scarborough ($650 per week for
a house compared to $1,100 per week for Cottesloe), growth in
rents have been a lot stronger in Scarborough.

Given the difference in price point, median incomes in
Scarborough are a lot lower, primarily because it has a much
younger demographic than Cottesloe, as well as there being
fewer families.

Winner - Scarborough is the next Cottesloe but for now the
winner is Cottelsoe.

                                                                   31
VA N E S S A R A D E R
THE GROWTH IN AUSTRALIAN
C O A S TA L O F F I C E M A R K E T S
There has been significant turbulence across the global office markets over the past
couple of years, as staff were encouraged to work from due to the threat of COVID-19
and subsequent extended lockdowns. As employers grapple with the forced change
in working conditions, many staff have embraced this new era, resulting in some
reluctance to move back into major CBDs on a full time basis, even as lockdown
restrictions ease.
To counter this change we have seen many different working models emerge,
including: the combination of working from home/working from office;
working close to home (as employers provide satellite office locations); or more
local shared office options so collaboration isn’t affected. These changes have seen
less staff in the office at any one time, with hot desking rampant. This has resulted
in a growth in subleased office space in many CBD locations, and many suburban
markets have reaped the benefits.
More noticeable, however, has been the shift in office requirements following
population change. Over the last two years, we have seen a significant increase in
interstate migration out of “traditional office” user states such as New South Wales
and Victoria into Queensland and to some extent Western Australia and Tasmania.
A combination of lifestyle and affordability has seen the population relocate, spurred
on by the greater ability for the workforce to work remotely. This is most apparent
in markets such as the Sunshine Coast and Gold Coast which have witnessed strong
interest by both Brisbane-based and interstate businesses looking to provide local
office facilities for their broadening workforce. This has resulted in net uptake of
office space during 2021 at 17,068sqm and 17,216sqm respectively causing office
vacancies to tumble, while CBD vacancies continue to increase.
32These markets offer a mix of weather, lifestyle, affordability which have not gone unnoticed by the Australian population
with the continued investment into infrastructure in this region growing its attractiveness. While these markets
traditionally have been plagued by older style stock, new developments have attracted a growing pool of potential
occupiers resulting in A grade vacancies falling, and demand to invest growing.
Over this same period, we have also seen new business starts in Queensland grow ahead of any other state,
suggesting new ventures borne out of COVID-19 employment changes have occurred. We’re seeing these small
businesses now outgrow their home start-up and as a result we’ve seen an increase in enquiry for office stock in the
sub-250sqm size range. The uptick in requirement for new commercial spaces benefits the local markets due to the
variety of businesses needing space. CBD locations in Sydney and Melbourne are heavily weighted towards finance,
legal, and professional users. This puts pressure on occupancy levels when economic uncertainty rises, which impacts
employment. However, the new mix in tenant types in these Queensland locations spreads risk if sectors of the
employment market shift in the future.
While Queensland has the greatest example of this shift to the coast, we have also seen these movements in
New South Wales as population movements to regional centres increase. Wollongong, south of Sydney has also enjoyed
growth in demand during 2021 of over 6,000sqm, while Newcastle to the north has also seen improvement in demand
of 11,446sqm over the same time period.
While these coastal markets enjoy their new, vibrant workforce it’s unclear if this is a passing fad or a long term shift
in employment. While the concept of remote working has been accepted during the pandemic, how workforces engage
their staff in the years ahead could result in a greater push to suburban, regional and coastal locations or cement our
CBDs as economic business hubs. Regardless, the change in population to these locations will continue to see these
markets thrive in the short to medium term.
33A B O U T R AY W H I T E
Ray White is a fourth generation family owned and led business. It was established in 1902 in the small Queensland
country town of Crows Nest, and has grown into Australasia’s most successful real estate business, with more than 930
franchised offices across Australia, New Zealand, Indonesia and Hong Kong.
Ray White today spans residential, commercial and rural property as well as marine and other specialist businesses.
Now more than ever, the depth of experience and the breadth of Australasia’s largest real estate group brings unrivalled
value to our customers. A group that has thrived through many periods of volatility, and one that will provide the
strongest level of support to enable its customers make the best real estate decisions.
Ray White’s first auction house, ‘The Shed’ Crows Nest, Queensland.
34RAY WHITE ECONOMICS TEAM
NERIDA CONISBEE
CHIEF ECONOMIST
VA N E S S A R A D E R
HEAD OF COMMERCIAL
RESEARCH
J O R D A N TO R M E Y
D ATA A N A LY S T
WILLIAM CLARK
D ATA A N A LY S T
35raywhite.com raywhitecommercial.com loanmarket.com.au
© Ray White Real Estate Partnership Australia 2021 Version 44 – March 2022You can also read


