Production Quality Control Using Six Sigma Method in Shock Absorber Industry (Case Study at PT.XYZ)
←
→
Page content transcription
If your browser does not render page correctly, please read the page content below
International Journal of Applied Engineering Research ISSN 0973-4562 Volume 16, Number 2 (2021) pp. 111-118
                                   © Research India Publications. http://www.ripublication.com

   Production Quality Control Using Six Sigma Method in Shock Absorber
                     Industry (Case Study at PT.XYZ)

                                              Patrik Martahi Ignatius1, Hadi Sutanto2*
                      1,2
                            Department of Mechanical Engineering, Atma Jaya Catholic University of Indonesia,
                                          Jl. Jenderal Sudirman 51, Jakarta, 12930, Indonesia.

                                                    2*)
                                                          Corresponding Author,

Abstract                                                                   companies in the automotive sector to support the motorcycle
                                                                           assembly process. PT XYZ is responsible for any complaints
PT.XYZ as a distributor for manufacturing vehicle shock
                                                                           from consumers regarding the use of motorbikes and is obliged
absorber parts has a problem with the production front fork
                                                                           to make repairs to be able to maintain trust with cooperating
parts, namely a leak in the area above the front fork found in
                                                                           companies. To obtain production quality, a sustainable product
the claim market. Researchers used the DMAIC method, where
                                                                           quality control method is needed, one of which is the six sigma
there are steps to reduce defects and variations carried out
                                                                           method. The main objective of this research is to analyze the
systematically by defining, measuring, analyzing, improving,
                                                                           quality of a part of a motorcycle through the DMAIC phase
and controlling which are known as the 5 phases of DMAIC
                                                                           (Define, Measure, Analyze, Improve, Control). One type of
(Define, Measure, Analysis, Improvement, Control). Research
                                                                           consumer complaint (claim market) that requires serious
and data collection were taken from one of the claim market
                                                                           handling is the Front Fork (Figure 1.1) with the problem of a
cases at PT. XYZ and PT Astra Honda Motor for the period
                                                                           leak in the Upper area (marked in red) which occurs in all types
January to December 2019. The results showed that after the
                                                                           of motorbikes. Front Fork (Shock Absorber) is an important
define and measure process was carried out, 2 main problems
                                                                           component of a vehicle's suspension system, which functions
were found that caused the front fork to leak in the upper area,
                                                                           to dampen the oscillating force of the spring. The front fork
namely a defective o-ring condition and minus inner tube
                                                                           slows down and reduces the magnitude of vibration - motion,
dimensions. This is evidenced by the measurement of process
                                                                           by converting the kinetic energy from the suspension
capability, where the defective o-ring conditions obtained Cp
                                                                           movement into heat energy that can be dissipated through
0.62 and Cpk 0.58 and for the dimensions inner tube minus, the
                                                                           hydraulic fluids [2].
Cp values were 9.4 and Cpk 0.24. After that, from the 2
problems, an analysis was carried out and the factors that
caused the o-ring defect and the minus inner tube dimensions
were analyzed. In the defective o-ring, there is a condition that
exceeds the lifetime, and the dies that are not clean cause the o-
ring to be defective. So that the addition of control over the
replacement of dies and socialization related to the cleanliness
of dies. For the problem of minus inner tube dimensions, it is
caused when tools change is not reset, from these findings, a
document for tool change control is made.
Keywords: Front Fork, Leak, DMAIC

1. INTRODUCTION
The production process has a very important role in keeping the            Figure 1: Part Front Fork (left) and Upper Front Fork Leaking
products produced following specifications, but there are still                                     Area (right)
products that do not comply with established standards or
defective products [1]. The existence of defects found in the
product will have an impact on the addition of production costs            From the results of research conducted by Hidayat [3] using
which are considered as waste and cannot use resources                     Minitab software on the KVL type L type crankcase, it was
properly. Quality control is a process or activity to ensure that          found that the average process in the die casting section resulted
the quality of each product is following predetermined                     in a total defect of 2473 for the period January to March 2008,
specifications based on company regulations.                               which is the company's benchmark for improvement.
                                                                           sustainable. The application of DMAIC can increase
PT XYZ is a distributor for the manufacture of shock absorber
                                                                           effectiveness while providing adequate reactions to problems
parts for motorized vehicles, both two-wheeled and four-
                                                                           that arise (Smętkowska and Mrugalska, 2018) as well as
wheeled vehicles, in collaboration with several manufacturing
                                                                           identifying the optimal level of tolerance and opportunities for

                                                                     111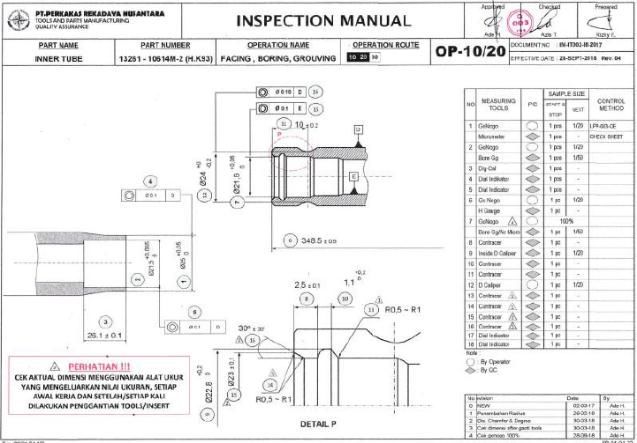
International Journal of Applied Engineering Research ISSN 0973-4562 Volume 16, Number 2 (2021) pp. 111-118
                                   © Research India Publications. http://www.ripublication.com

improvement [4].                                                                                                                                      Dies Worn Out

                                                                                                               There is Defect O
1. Knowing the type of defect that causes the front fork in the                                                      Ring
upper area.                                                                                                                                             There’s
                                                                                                                                                      Contaminant
2. Identify the biggest factor causing the front fork in the upper
                                                                              Front fork leak in
area.                                                                            upper area                     Cap Dimension                         Wrong Process
                                                                                                                    Minus
3. Formulate corrective actions and make improvements in the
company to eliminate the leaky front fork problem in the upper
                                                                                                                  Inner Tube                          Wrong Process
area.                                                                                                          Dimension Minus

4. Comparing CP / CPk before and after repairs.
Based on previous research, my research this time is at the                 Figure 2: Logic Tree Diagram Penyebab Front Fork Bocor
measurement stage, I use process capability tools because the                                     Area Upper
analysis that will be carried out ensures that the process
capability of a machine is up to standard or not. And the second
difference is in the control tools stage that is used using SPC
(Statistical Process Control) where from this control the
consistency of improvement can be controlled every day.

2. RESEARCH AND METHOD
Six Sigma is a method used to identify problems in the
production process and describe burdensome defects in terms
of time, money, customers, and opportunities (Supriyadi,                                      Figure 3: Front Fork Upper Area
2017). Kibria, Kabir, & Boby (2014) revealed that Six Sigma
increases profit margins, improves financial conditions by
minimizing the level of product defects. Researchers used the
                                                                           To define the process of the front fork components and parts
DMAIC method, where there are steps to reduce defects and
                                                                           associated with the front fork, starting from material suppliers,
variations carried out systematically by defining, measuring,
                                                                           sub-parts, front fork assy, assy units, output distribution to
analyzing, improving, and controlling which are known as the
                                                                           consumers, a map of Supplier, Input, Process, Output,
5 phases of DMAIC (Define, Measure, Analysis, Improvement,
                                                                           Customers (SIPOC) will be made diagram which can be seen
Control). Research and data collection were taken from one of
                                                                           in Figure 4 below
the claim market cases at PT. XYZ and PT Astra Honda Motor
from January to December 2019.
                                                                              SUPPLIER             INPUT           PROCESS            OUTPUT               CUSTOMER

3. RESULTS
                                                                                                                                     Delivery to
                                                                              Supplier C      Pipe Material       Machining                                Customers
3.1. Define                                                                                                                           Dealer

In 2019, consumer complaints (Claim Market) were found with                 Supplier A and
complaints received due to the front fork leaking in the upper                                     Rubber            Press
                                                                              Suppler B                                            Delivery to Main
area which can be seen in table 1. below this                                                                                           Dealer
                                                                                                O RING
  Table 1: Total Customers Complaints Relate to Front Fork                                     FORK PIPE
                                                                                                                  Front Fork
                                                                               PT.XYZ             CAP
                  Leak Upper Area in 2019                                                                         Assembly
                                                                                                SPRING
                                                                                              Bottom Case
                                                                                                                  Frame Assy        Delivery to
                                                                                AHM                                                 Warehouses
                                                                                                                     Parts

                                                                                                                Motorcycle Unit
                                                                                AHM          Assembly Engine
                                                                                                                  Assembly

                                                                                                     Figure 4: SIPOC Diagram
Oil leaks in the front fork can be caused by several things. To
see the possible causes of oil leakage, you can see the Logic              3.2. Measure
Tree Diagram in Figure 2 for the process of defining the cause
of oil leakage in the upper front fork area, and in Figure 3 are           At the Measure stage, the main activity carried out is the
the parts in the upper front fork area                                     measurement of calculating the capability process condition
                                                                           where the output is the value of Cp, Cpk. The processing
                                                                           capability will be calculated first by mapping the part process,

                                                                     112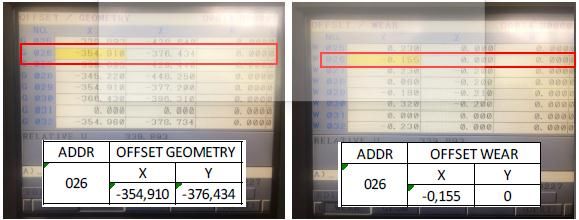
International Journal of Applied Engineering Research ISSN 0973-4562 Volume 16, Number 2 (2021) pp. 111-118
                                         © Research India Publications. http://www.ripublication.com

then determining the critical point by making a logic tree                                                                                concluded that the results of the Process are Enough and it is
diagram on the part process. The processing capability that will                                                                          decided OK.
be calculated includes:
                                                                                                                                          Next, taking Cp, Cpk, calculating the ring diameter for supplier
1. O Ring Dimensions                                                                                                                      A can be seen in Figure 7 below.
2. Inner Tube Dimensions
3. Cap Dimensions
Dimensional Measurement of O Ring
Measurement of process capability that is measured is the
points that affect the density with the inner tuber, including:
1. Inside Diameter
2. Ring Diameter
For CP o-ring measurement, it will involve 2 suppliers, namely
Supplier A and Supplier B. Standard dimensions of the inside
diameter and ring diameter can be seen in Figure 5 below.

                                                                                                                                              Figure 7: Graphic Data Cp, Cpk Ring Diameter O-Ring
                                                                                                                                                                   Supplier A

                       Figure 5: Standard Dimension O Ring                                                                                Based on the above calculations, the Cp value is 0.62 and Cpk
                                                                                                                                          0.58. From these results, it can be decided that the process is
                                                                                                                                          not good and it is decided by NG.
The results information based on the Cp and Cpk values are as
follows:                                                                                                                                  Furthermore, the calculation of Cp, Cpk starts on the diameter
                                                                                                                                          of the ring cap for supplier B which can be seen in Figure 8
• Bad Process: Cpk or Cp  U S L 0.00
                                 P P M < LS L      1595.58
                                 P P M > U S L 15540.08
                                                              P P M < LS L       2273.90
                                                              P P M > U S L 19007.69
                                                                                                                                          5.34 and the Cpk value is 5.28, with the Cp Cpk value obtained,
    P P M Total     0.00         P P M Total     17135.66     P P M Total       21281.59
                                                                                                                                          it can be concluded that the results of the Process are Very Good
                                                                                                                                          and it is decided that the results of the process are OK
  Figure 6: Graphic Data Cp, Cpk Diameter Inside O Ring
                        Supplier A
Based on the above calculations, the Cp value is 0.85 and the                                                                             And taking Cp, Cpk, the last calculation is done on the ring
Cpk is 0.72, with the Cp Cpk value obtained, it can be                                                                                    diameter for supplier B which can be seen in Figure 9 below

                                                                                                                                    113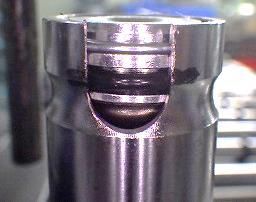
International Journal of Applied Engineering Research ISSN 0973-4562 Volume 16, Number 2 (2021) pp. 111-118
© Research India Publications. http://www.ripublication.com
Process Capability of Diameter Ring Cap in Figure 12 below.
LSL Target USL
Process Capability of Dimensi Inside Upper Diameter
P rocess Data Within
LS L 2.33 Overall
Target 2.4 LSL Target USL
USL 2.48 P otential (Within) C apability
Cp 3.10 P rocess Data Within
S ample M ean 2.397
C PL 2.77 LS L 21.6 Overall
S ample N 30
S tDev (Within) 0.00805828 C PU 3.43 Target 21.655
USL 21.7 P otential (Within) C apability
S tDev (O v erall) 0.00708292 C pk 2.77
C C pk 2.90 S ample M ean 21.6987 Cp 9.40
S ample N 30 C PL 18.56
O v erall C apability
S tDev (Within) 0.00177321 C PU 0.24
Pp 3.53 C pk 0.24
S tDev (O v erall) 0.00331831
PPL 3.15 C C pk 8.46
PPU 3.91
O v erall C apability
P pk 3.15
C pm 3.05 Pp 5.02
PPL 9.92
PPU 0.13
P pk 0.13
2.34 2.36 2.38 2.40 2.42 2.44 2.46 2.48 C pm 0.34
O bserv ed P erformance E xp. Within P erformance E xp. O v erall P erformance
P P M < LS L 0.00 P P M < LS L 0.00 P P M < LS L 0.00 02 1 6 30 44 5 8 72 86 00
.6 .6 .6 .6 .6 .6 .6 .7
P P M > U S L 0.00 P P M > U S L 0.00 P P M > U S L 0.00
21 21 21 21 21 21 21 21
P P M Total 0.00 P P M Total 0.00 P P M Total 0.00
O bserv ed P erformance E xp. Within P erformance E xp. O v erall P erformance
P P M < LS L 0.00 PPM < LS L 0.00 P P M < LS L 0.00
P P M > U S L 333333.33 PPM > U S L 237509.67 P P M > U S L 351334.32
Figure 9: Graphic Data Cp, Cpk Diameter Inside O Ring P P M Total 333333.33 PPM Total 237509.67 P P M Total 351334.32
Supplier B
Figure 12: Graphic Data Cp, Cpk Inside Upper Diameter
Based on calculations on supplier B, the Cp value is 5.34 and
the Cpk value is 5.28, with the Cp Cpk value obtained, it can
be concluded that the results of the Process are Very Good and
Based on the calculation of Cp, Cpk, the value of Cp is 9.4 and
it is decided that the results of the process are OK
Cpk is 0.24. Because the Cpk value is below 0.67, it can be
And taking Cp, Cpk, the last calculation is done on the ring stated that the result of the process is not good and it is decided
diameter for supplier B which can be seen in Figure 10 below by NG
Process Capability of Diameter Ring Cap Measurement of Cap Dimensions
P rocess Data
LSL Target USL The measurement of the front fork cap, especially on the
Within
LS L
Target
2.33
2.4
Ov erall outside diameter, is carried out on the part claim, in this part
P otential (Within) C apability
USL
S ample M ean
2.48
2.397 Cp 3.10 measurement, the process capability measurement is not
S ample N 30 C PL 2.77
S tDev (Within) 0.00805828 C PU 3.43 carried out and the process mapping is carried out because the
S tDev (O v erall) 0.00708292 C pk 2.77
C C pk 2.90 components of this part are imported so that the manufacturing
O v erall C apability
Pp 3.53 process cannot be analyzed, if a problem is found on the
PPL 3.15
PPU 3.91 dimensions then a claim or rejection will be made to the part
P pk 3.15
C pm 3.05 maker. The measured part claim can be seen in Figure 13 below
and the results of measuring part claim as many as 10 parts can
2.34 2.36 2.38 2.40 2.42 2.44 2.46 2.48 be seen in Table 2
O bserv ed P erformance E xp. Within P erformance E xp. O v erall P erformance
P P M < LS L 0.00 P P M < LS L 0.00 P P M < LS L 0.00
P P M > U S L 0.00 P P M > U S L 0.00 P P M > U S L 0.00
P P M Total 0.00 P P M Total 0.00 P P M Total 0.00
Figure 10: Graphic Data Cp, Cpk Diameter Ring O Ring
Supplier B
Based on the latest calculations for the ring diameter at supplier Figure 13: Cap Front Fork Illustration
B, the Cp value is 3.10 and the Cpk value is 2.77. Thus it can
be concluded that the result of the Process is Very Good and it Table 2: Measurement Data Market Claim Front Fork Part
was decided OK. Measurement Result
No Inspection Item Standard Judge
1 2 3 4 5 6 7 8 9 10
Inner Tube Dimension Measurement
Ø21.6 -0.1
1 Out Side Diameter 21.39 21.38 21.39 21.39 21.38 21.41 21.4 21.38 21.4 21.39 OK
Measurement of process capability is measured on the inner -0.3
tuber part, namely the inside upper diameter as seen in Figure
Ø 17.6 0
11 below 3 Grooving Diameter
-0.06
17.58 17.57 17.59 17.58 17.59 17.57 17.58 17.58 17.59 17.58 OK
4 Total Length 10 ± 2 10.02 10.12 10.13 10.18 10.8 10.12 10.13 10.13 10.05 10.12 OK
3.2 + 0.1
5 Width of Grooving 3.24 3.24 3.21 3.22 3.21 3.21 3.24 3.24 3.21 3.22 OK
0
Based on the above measurement data, especially in the
diameter grooving area where the o ring is installed,
dimensionally there are no dimensional problems so that the
Figure 11: Standard Dimension Inside Upper Diameter conclusion on the front fork cap part is declared OK and no
further analysis is needed.
Calculation of Cp, Cpk on the inside upper diameter can be seen
114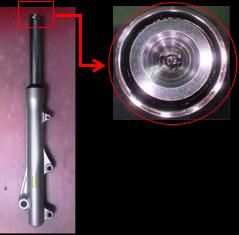
International Journal of Applied Engineering Research ISSN 0973-4562 Volume 16, Number 2 (2021) pp. 111-118
© Research India Publications. http://www.ripublication.com
3.3. Analyze
The main activity at the Analyze stage is to determine the After obtaining the causal diagram, the next step is to calculate
factors that affect the front fork leak in the upper area based on the failure mode effect and analysis (FMEA). Failure Mode and
the results of the previous stage, namely measurement. The Effect Analysis (FMEA) is used to see which part of the process
following is a technical analysis based on measurement results is the most dominant in producing process failures where this
on part components that affect the performance of the front fork time the process is in the pressing process. From the Failure
which can cause the front fork to leak in the upper area Mode and Effect Analysis (FMEA), a table will be created to
see the grouping carried out in Table 4 below. Tabel 4:. Failure
Tabel 3: Technical Analysis for Front Fork Leak Upper Area
Mode Effect and Analysis (FMEA) Press Process
Judge
Main
Problem
Potential Problem (measur
ement)
Description Table 4: Minus Inner Tube Diameter Analysis
Inside O Ring Diameter Supplier
OK Measurement- S O D R
Potential Potenntial Potential Current
Based No Process Step E C E P
O Ring Supplier Failure Mode Failure Effect Causes Control
V C T N
A Cap Diameter Supplier
NG Measurement- O-Ring Maintenace not
1 Dies Process Dies Worn Out 8 10 No Inspection 8 640
Based Defect Done
Inside O Ring Dimension
Supplier
Parameter Out of Order O-Ring Maintenace not Incomplet
2 5 2 5 50
OK Measurement- Process Display Defect Done Control
O Ring Supplier Based
Front Fork Setting parameter
Leak Upper B 3 Press Process Lack of press Oval O-Ring 5 4 Part Incpection 5 100
Cap Diameter Supplier process
Area
OK Measurement- O-Ring Cleancing was not Man Power don't
Based 4 Dies Process Dirty Dies 5 10 5 250
Defect Done Follow SOP
Dimensi Inside Upper Supplier
Inner Tube
Diameter
NG Measurement-
Dimension Based
Cap Dimension Dimension
OK
Measurement Part
Claim Based
The analysis is also carried out the same as the previous part
using the fishbone diagram. In the Fishbone Diagram for the
minus inner tube problem, the same as the previous diagram the
To resolve the indication of the front fork leak in the upper area dominant factors that cause problems based on 5M + 1E will
based on the technical analysis table above, the analysis stage, be analyzed based on the machining process. The cause and
the main tool to be used is as follows: effect diagram of the minus inner tube can be seen in Figure 15
• Cause and Effect Diagram (Fishbone Diagram) below.
• Failure Tree Analysis (FTA)
Man Power Machine
• Failure Mode Effect and Analysis (FMEA)
Fatigue Machine
Analysis of O Ring Defects Jig
Health Lack of No Resetting
Factor
For the analysis of o ring defects using a cause and effect Concentration Spindel Not Center
diagram to find the dominant factor that allows arising based Work Ethos Setting Process
on 5M + 1E, in this diagram, the 5M + 1E factor to be analyzed Inaccurate Improper Use
Lack of Training
is the pressing process where the process greatly affects the Cutting Tool
quality of the o ring which can be seen in Figure 14 below Skill
Dimension
Over Life Time
Inexperienced Inside Front Fork
Upper Leak Upper
Man Noisy Diameter Area
Machine Minus
Power Porous Wrong
Out of Order
Sound SOP
Fatigue Material
Form Material SOP
Lack of Dies Wrong Input
Health Factor Concentration Composition
Worn Out Setting Process Not Standard Quality Unclear
Work Ethos No Check Sheet
Wrong Diplay Hot SOP
Lack of Training Inaccurate Press
Parameter Dirty Inspection Part
Skill Process Temperature
Problem
Wrong Parameter Front Fork Station
Inexperienced
O Ring Leak
Defect Upper Incomplet Document
Area Slippery
Noisy
Wrong SOP
Sound MATERIAL Environment Method
SOP
Hot
Dirty Unclear Inspection Part Figure 15: Fishbone Diagram Diameter Inner Tube Minus
Temprature SOP
Station
No Check Sheet
Slippery
Table Failure Mode Effect and Analysis (FMEA) Machining
Environment Method Process
The last analysis process is calculating the Failure Mode Effect
Figure 14: Fishbone Diagram O Ring Defect
and Analysis (FMEA) Machining Process after the previous
115International Journal of Applied Engineering Research ISSN 0973-4562 Volume 16, Number 2 (2021) pp. 111-118
© Research India Publications. http://www.ripublication.com
process the causes of the minus inner tube diameter have been cause of the worn condition of the dies due to the usage that
obtained through the analysis of the causal diagram (Fishbone exceeds the lifetime, this condition can be seen in Figure 17
Diagram). The calculation of Failure Mode Effect and Analysis where the condition of the dies exceeds the lifetime.
(FMEA) can be seen in Table 5 below.
Table 5: Failure Mode Effect and Analysis (FMEA)
Machining Process
S O D R
Potential Potenntial Potential Current
No Process Step E C E P
Failure Mode Failure Effect Causes Control Figure 17: Check Sheet dan Maintenance Schedule Dies
V C T N
Resetting was not Minus Cutting tool over
1 Inner Diameter 8 10 No Resetting 8 640
done Diameter use
Minus Periodic
2 Inner Diameter Excessive life time 5 Blunt Cutting tool 2 5 50 From the above findings, it can be seen that in the 3rd week of
Diameter Inspection
Dimension out of Minus Cutting tool over Incomplet Final March, there were conditions for the use of dies that exceeded
3 Dimension 8 10 5 400
spec Diameter use Inspection the plan or standards set by production. From the condition of
the dies that exceed the lifetime, the parts produced have visual
defects which can be seen in Figure 18 below
3.4. Improve
Based on the FMEA table that has been created, the following
table of technical analysis (5-why method) and priority based
on the value of the Risk Priority Number (RPN) on the factors
that cause front fork leaks in the upper area can be seen in Table
6.
Table 6: 5 Why Method Front Fork Leak Upper Area
Symptoms Why? Why? Why? Why? Why? RPN
Figure 18: Defect Rubber Trigger by Worn Out Dies
Worn Out Maintenance Tidak ada dies
640
Diameter O Dies not Done inspeksi
O Ring Defect Ring out of
Man Power
standard Cleancing
Dirty Dies
was not Done
don't Follow 250 With the discovery of worn-out dies conditions that were not
SOP
Front Fork detected by the operator, it is necessary to improve the control
Leak Upper
Area
of the use of dies to avoid the reoccurrence of worn-out dies.
No Resetting 640
Inner Tube No resetting
There's Gap
Dimension when in repair
Cutting tool Apart from that, the conditions that need to be maintained by
in inner tube over
Minus period the operator are related to the cleanliness of the dies, the
Incomplet Final
Inspection
400 condition of the dies where the remaining burry from the
previous process can also cause the condition of the o ring to
have defects. So that re-socialization is needed for operators so
that no important processes in the SOP are missed. Re-
Improved Dies Use Control During O-Ring Making Process socialization has been carried out and can be seen in Figure 19
and SOP Socialization
In the press process of making an O ring, there are important
things that have been previously discussed at the analysis stage
that the use of dies is very important in manufacturing. After
analysis, the cause of the CP / CPK NG on the ring diameter
was caused by the use of the dies itself. When checking the dies,
a worn condition is found which can be seen in Figure 16
Figure 19: SOP Press Process Socialization
Figure 16: Dies at Press Process
Improved Control of Tool Change and Addition of Final
Inspections
With the condition of the dies that are worn out, when the
pressing process takes place the result of the ¬o ring is Repair activities that will be carried out this time are to fix
defective. This defect in the o ring causes oil to come out. The problems that occur in the inner tube dimension. The inner tube
116International Journal of Applied Engineering Research ISSN 0973-4562 Volume 16, Number 2 (2021) pp. 111-118
© Research India Publications. http://www.ripublication.com
dimension itself is found in the bar in (inside diameter) process, 3.5. Control
which has a gradual infeed
The main activity in the control stage is to maintain and
After the analysis was carried out, there was a finding that when maintain the condition of the repair results. Process control is
the tools were replaced, the operator did not set the offset wear, carried out using tools from SPC (Statistical Process Control),
which caused an insert over to be carried out at the beginning using the X-R Control Chart. The points to be controlled
of the feeding process. This is found when the operator has include:
replaced the worn insert with a new insert, the operator does
Ring Diameter O Ring on the Front Fork which can be seen in
not set the offset wear and is shown on the monitor parameter
Table 7
setting in Figure 20 below
Table 7: X-R Control Chart Ring Diameter O Ring
Check Point Model : All Type Prepared by Checked by
1. CL Month : September 2020 X - R Control Chart
2. UCL, LCL
DATE 3 4 7 8 9 10 11 14 15 16 17 18 21 22 23 24 25 28 29 30
LOT No. 1 2 3 4 5 6 7 8 9 10 11 12 13 14 15 16 17 18 19 20
Sample (n) 4 4 4 4 4 4 4 4 4 4 4 4 4 4 4 4 4 4 4 4
X1 2.38 2.37 2.38 2.36 2.37 2.37 2.38 2.35 2.36 2.36 2.36 2.37 2.38 2.37 2.37 2.36 2.37 2.38 2.38 2.39
CHECK X2 2.42 2.4 2.41 2.4 2.41 2.4 2.41 2.39 2.39 2.4 2.4 2.41 2.41 2.4 2.41 2.39 2.4 2.42 2.4 2.42
VALUE X3 2.43 2.41 2.41 2.41 2.42 2.42 2.43 2.4 2.41 2.4 2.41 2.42 2.42 2.42 2.4 2.39 2.39 2.43 2.41 2.43
X4 2.41 2.44 2.43 2.43 2.44 2.45 2.45 2.42 2.44 2.44 2.45 2.45 2.45 2.44 2.43 2.43 2.43 2.46 2.44 2.45
TOTAL 9.64 9.62 9.63 9.6 9.64 9.64 9.67 9.56 9.6 9.6 9.62 9.65 9.66 9.63 9.61 9.57 9.59 9.69 9.63 9.69
X (Average) 2.41 2.41 2.41 2.40 2.41 2.41 2.42 2.39 2.40 2.40 2.41 2.41 2.42 2.41 2.40 2.39 2.40 2.42 2.41 2.42
R (Range) 0.05 0.07 0.05 0.07 0.07 0.08 0.07 0.07 0.08 0.08 0.09 0.08 0.07 0.07 0.06 0.07 0.06 0.08 0.06 0.06
Xbar-R Chart
Figure 20: Monitor Setting Parameter Before dan After 2.450 U C L=2.4509
Change Insert 2.425
Sample Mean
_
_
X=2.4068
2.400
2.375
LC L=2.3626
2.350
From the above findings, when a new insert is not set the offset 1 3 5 7 9 11
Sample
13 15 17 19
wear is set, it will cause when the initial infeed process is 0.15
U C L=0.1381
Sample Range
carried out the result of the part dimensions will be minus. For 0.10
_
R=0.0605
the standard diameter itself between 21.6 - 21.7, if the operator 0.05
compares the results of the insert insertion before it is replaced 0.00
1 3 5 7 9 11 13 15 17 19
LC L=0
Sample
and after the insert is replaced. Checked by
Remark by :
Finding these conditions can cause the inner tube diameter to Chief
Section Part Comp. Parts Name Specific of Quality Tooling Sampling
be minus and cause a leak in the front fork. In the IK (Work FINAL INSPECTION O RING DIAMETER O RING CALIPER RUBBER 4 PCS
Instructions) document, the replacement of the insert tool is not
written in detail, so it needs to be revised for the point of adding
the insert tool settings when the replacement is made Dimensions of Inside Upper Diameter on the Front Fork which
After repairs have been made which causes the inner tube can be seen in Table 8.
diameter to be minus, it is followed by inspection of the parts Table 8: X-R Control Chart Dimension Inside Upper
so that if the same problem occurs, the operator can catch the Diameter
NG part. To better control the production results maximally, Check Point Model : All Type Prepared by Checked by
improvements were made by adding 100% plug gauge checks 1. CL Month : September 2020 X - R Control Chart
2. UCL, LCL
and when there was a change of inserts, the dimensions were DATE 3 4 7 8 9 10 11 14 15 16 17 18 21 22 23 24 25 28 29 30
checked which can be seen in Figure 21 below LOT
No. 1 2 3 4 5 6 7 8 9 10 11 12 13 14 15 16 17 18 19 20
Sample (n) 4 4 4 4 4 4 4 4 4 4 4 4 4 4 4 4 4 4 4 4
X1 21.605 21.65 21.635 21.679 21.66 21.626 21.604 21.651 21.627 21.604 21.648 21.625 21.603 21.651 21.631 21.603 21.667 21.635 21.628 21.606
CHECK X2 21.62 21.671 21.652 21.603 21.603 21.649 21.627 21.673 21.651 21.622 21.661 21.646 21.621 21.672 21.655 21.626 21.604 21.659 21.651 21.629
VALUE X3 21.622 21.61 21.655 21.631 21.605 21.652 21.631 21.603 21.653 21.624 21.604 21.649 21.624 21.605 21.658 21.63 21.608 21.663 21.655 21.633
X4 21.64 21.632 21.678 21.656 21.624 21.673 21.649 21.625 21.671 21.646 21.623 21.672 21.648 21.628 21.675 21.649 21.631 21.609 21.674 21.654
TOTAL 86.49 86.56 86.62 86.57 86.49 86.60 86.51 86.55 86.60 86.50 86.54 86.59 86.50 86.56 86.62 86.51 86.51 86.57 86.61 86.52
X (Average) 21.62 21.64 21.66 21.64 21.62 21.65 21.63 21.64 21.65 21.62 21.63 21.65 21.62 21.64 21.65 21.63 21.63 21.64 21.65 21.63
R (Range)
Xbar-R Chart
21.627
21.68 21.604
U C L=21.67176
21.648
21.66
Sample Mean
21.625
_
_ 21.603
21.64 X=21.63756
21.651
21.62 21.631
21.603
LC L=21.60337
21.60 21.667
1 3 5 7 9 11 13 15 17 19
21.635
Sample
21.628
U C L=0.1071 21.606
0.100
Sample Range
0.075
_
0.050 R=0.0469
0.025
0.000 LC L=0
1 3 5 7 9 11 13 15 17 19
Sample
Checked by
Remark by :
Section Part Comp. Parts Name Specific of Quality Tooling Sampling
MACHINING FORK PIPE INSIDE UPPER DIAMETER CALIPER 4 PCS
Figure 21: Inspection Manual Revision Inner Tube Part
117International Journal of Applied Engineering Research ISSN 0973-4562 Volume 16, Number 2 (2021) pp. 111-118
© Research India Publications. http://www.ripublication.com
From the results of the X-R Chart, it can be seen that the data [8] M. Sokovic, D. Pavletic, and K. Pipan, “Quality
retrieval was carried out 4 times a day for 1 month, showing improvement methodologies - PDCA cycle, RADAR
very good results. This control can be a reference that the matrix, DMAIC and DFSS,” J. Achiev. Mater. Manuf.
improvements made can run well. Eng., vol. 43, Nov. 2010.
[9] A. Boon Sin, S. Zailani, M. Iranmanesh, and T. Ramayah,
4. SUMMARY AND CONCLUSION “Structural equation modelling on knowledge creation in
Six Sigma DMAIC project and its impact on
From the Define, Measurement and Analyze processes, organizational performance,” Int. J. Prod. Econ., vol. 168,
researchers found 2 factors that caused the front fork to leak in pp. 105–117, Oct. 2015.
the upper area. Where the first cause is due to a defective o-ring
condition and the second cause is the minus dimensions of the .
inner tube. For this reason, the researcher carried out an
improvement process, namely for the cause of the defect o-ring,
control of the use of dies was carried out during the o-ring
manufacturing process and carried out re-socialization for the
SOP in the dies cleaning process after the pressing process was
complete. And other causes related to the minus inner tube
dimensions, improvements were made to control tool change in
the machining process, and the addition of final inspection
controls for the results of the machining process.
It is hoped that PT. XYZ will pay more attention and improve
the performance of workers so that it can reduce defects in the
production process. The need for PT XYZ's involvement and
providing training for employees to be able to participate in
improving the six sigma method.
REFERENCES
[1] V. Gupta, R. Jain, M. L. Meena, and G. S. Dangayach,
“Six-sigma application in tire-manufacturing company: a
case study,” J. Ind. Eng. Int., vol. 14, no. 3, pp. 511–520,
Sep. 2018.
[2] B. S. Majanasastra, “Analisis Defleksi Dan Tegangan
Shock Absorber Roda Belakang Sepeda Motor Yamaha
Yupiter,” J. Ilm. Tek. Mesin Unisma “45” Bekasi, vol. 1,
no. 1, 2013.
[3] V. Gupta, R. Jain, M. L. Meena, and G. S. Dangayach,
“Six-sigma application in tire-manufacturing company: a
case study,” J. Ind. Eng. Int., vol. 14, no. 3, pp. 511–520,
Sep. 2018.
[4] M. Smętkowska and B. Mrugalska, “Using Six Sigma
DMAIC to Improve the Quality of the Production Process:
A Case Study,” Procedia - Soc. Behav. Sci., vol. 238, pp.
590–596, 2018.
[5] A. Valles, J. Sanchez, S. Noriega, and B. Gómez Nuñez,
“Implementation of Six Sigma in a manufacturing process:
A case study,” Int. J. Ind. Eng. Theory Appl. Pract., vol.
16, no. 3, pp. 171–181, 2009.
[6] “Implementation of Six Sigma Methodologies in
Automotive Wiring Harnesses Manufacturing Companies.
‘ABC’ Plant Case Study,” 2018.
[7] B. Mrugalska and E. Tytyk, “Quality Control Methods for
Product Reliability and Safety,” Procedia Manuf., vol. 3,
pp. 2730–2737, 2015.
118You can also read