Priced Out: The Unintended Consequences of Federal Moratoriums on Wisconsin's Housing Market - March 2022
←
→
Page content transcription
If your browser does not render page correctly, please read the page content below

March 2022

 POLICY BRIEF

 Priced Out: The Unintended
 Consequences of Federal
 Moratoriums on Wisconsin’s
 Housing Market

 Will Flanders
 Research Director

Executive Summary
The price of housing was an important news story during the summer of 2021. Many families
found themselves priced out of the housing market, as a single listing might draw more than 100
competing bids.i There are a number of potential causes of this crisis—including the growing
cost of building supplies—but one potentially overlooked component has been government
intervention in the form of eviction moratoriums and mortgage forbearances.

Under the Coronavirus Aid, Relief, and Economic Security (CARES) Act and several subsequent
actions, the federal government effectively banned eviction and foreclosure on millions of homes
throughout the country for more than a year. Because this creates a chokehold on the supply of
homes, classical economics would tell us that this should have a direct effect on home prices, as
supply is unable to keep up with demand. But do we observe that reality?

This study attempts to answer that question by using Wisconsin housing market data over the
past three years. Controlling for a number of other factors that could plausibly affect the housing
market, we find that these interventions likely did play a role in raising the cost of buying a
home.

Key Findings Include:

Housing prices have increased significantly in Wisconsin. The average price of a home has
increased by more than 37% since January 2019 from about $175,000 to $240,000 by December
of 2021.

The eviction moratorium likely increased housing prices. The implementation of this program
is associated with an increase of $3,664 in the average cost of a home in Wisconsin. This
represents about 5.4% of the overall increase in the price of a home.

The forbearance option likely increased housing prices. The implementation of these
programs is associated with an increase of $11,354 in the average cost of a home in
Wisconsin. This represents about 17.4% of the overall increase in the price of a home.

Housing price increases aren’t limited to cities. Some of the largest percentage increases in the
average cost of a home occurred in rural counties.

 Wisconsin Institute for Law & Liberty 2
Introduction
The COVID-19 pandemic led to unprecedented governmental interventions into the American
economy, and parts of our economy are still feeling the ramifications of these
interventions. Among the policies implemented to combat COVID-19 was a moratorium on
evictions for renters and the ability to enter forbearance for homeowners with federally-backed
loans. While these emergency actions were billed as necessary, these decisions may have been
made and celebrated without weighing all of their costs, especially the “unintended” ones. This is
especially important because the rising cost of home ownership is one of the largest economic
problems that Americans face.

This paper examines whether the moratorium on foreclosures and evictions were correlated with
changes in the housing market that contributed to this rising cost. Using county-level data from
the state of Wisconsin, we examine the change in home prices that can be associated with each of
these interventions.

Rising Cost of Home Ownership
Home ownership has long been considered a smart investment because homes have a tendency to
increase in value. But, in recent years, the rate of increase in home costs has priced many people
out of the market entirely. According to a recent analysis,ii nationwide home prices rose by
more than 30% during the past decade, while incomes only increased by about 11%. This trend
only accelerated during the pandemic, with home prices increasing about 22% nationwide
between August 2020 and August 2021.iii

While home prices in Wisconsin remain below the national average, our state still experienced
these trends. At the peak in June 2021, housing prices had risen 14.7% over the course of a year.
Prices have come down slightly since then, but remain high. It is likely that increases in price—
to some extent—will begin again once the weather warms if traditional patterns hold.

These price trends are concerning because home ownership has important societal implications
in the United States. Owning a home is generally considered integral to the classic “American
Dream.” Studies have found that home owners have greater life satisfaction in general than
others from similar circumstances who don’t own a home.iv Home ownership rates are also
correlated with property maintenance, property values, and increased residential stability.v If a
sizeable portion of the population is shut out of home ownership due to increasing prices, there is
a potential for broad spillover effects for both economically and socioeconomically.

 Wisconsin Institute for Law & Liberty 3

The Moratorium and Forbearance Option
The CARES Act, passed in March of 2020, addressed the housing market in a few different
ways. Among the key provisions was a prohibition on eviction for individuals living in “covered
dwellings.” Such dwellings included those receiving rental assistance, those with a federally-
backed mortgage loan, or subject to a multi-family federally-backed mortgage loan. Estimates
suggested that this applied to approximately 28% of all renters in the nation.vi

The moratorium was allowed by Congress to lapse in 2021, but was temporarily reinstated by the
Centers for Disease Control (CDC). The CDC’s moratorium was set to expire at the end of
December of 2020, but Congress extended it for a month. When this extension expired, the CDC
extended it several times before the moratorium was struck down by the United States Supreme
Court on August 26th, 2021.vii

Another key provision of the CARES Act applied to home owners with federally-backed
mortgages. Under the Act, such owners were able to request a forbearance on mortgage
payments for up to a year. End dates for this forbearance are based on the time that the initial
application by the home owner was made, but the number of homes in forbearance clearly began
to decline significantly by mid-2021.viii

Figure 1, taken from the Mortgage Analytics and Performance Dashboard of the Federal Reserve
Bank of Atlanta,ix shows the percentage of mortgages in forbearance in each month since the end
of March, 2020 in Wisconsin.

 Wisconsin Institute for Law & Liberty 4
Figure 1. Share of Mortgages in Forbearance by Month, Wisconsin

While the rate of loans in forbearance never reaches a dramatically high number, there is a
visible uptick during the early days of the pandemic, and a noticeable decline in the months
afterwards. By the end of August 2021, the percentage of loans in forbearance in the state had
fallen below 2.0%.

Like any other marketplace, the housing market is subject to the forces of supply and demand.
Prior to the COVID-19 pandemic, most academic literature on the relationship between housing
supply and demand focused on the role that restrictions on growth could have on housing
prices. This literature generally finds that restrictions on the supply of housing have the effects
of increasing housing costs, decreasing population growth, and potentially shutting younger
would-be buyers out of the marketplace.x

There has already been at least one study that examined the relationship between local
forbearance rates and price of homes. Conducted by the Federal Reserve,xi this study found that
the percentage of homes in forbearance is correlated with a reduction in the supply of new
listings in a community, which in turn increased housing prices by 12.8 percentage points. The
authors of the study point out that, given that home prices increased by about 1 percentage point
over the time frame, the moratorium accounted for a large share of this increase. This study
builds on that work using a longer time frame of analysis that includes observations after the end
of the moratorium, as well as a focus on the specific implications for the state of Wisconsin.

It is important to note that foreclosure rates were falling even prior to the pandemic and
associated foreclosure moratoriums. According to University of Wisconsin-Whitewater
Professor Robert Kashian, who has tracked foreclosure data in the state for more than a decade,xii

 Wisconsin Institute for Law & Liberty 5
2019 represented the lowest rate of foreclosures in two decades. Even in Milwaukee County,
where the highest foreclosure rates in the state are, rates had declined by more than 60%.

Foreclosures are always unfortunate. But while it is no doubt sad when an individual can no
longer live in their home, it is also sad when potential new buyers are priced out of the market by
governmental intervention in the economy. That process unfolding in Wisconsin is what we
observe in the following sections of the paper.

Methodology

We gathered data from a number of sources to answer the questions posed here. Chief among
the sources was data from the Wisconsin Realtors Association (WRA)xiii on the number of new
home sales and average price of sold homes by month.

The first analysis looks at the potential correlation between the federal eviction moratorium and
housing prices. We compare monthly prices over time before, during, and after the period when
the moratorium was in place. Our data begins with the first month of 2019, prior to the
pandemic, and takes on a value of “0” through March. Our data set continues through the
moratorium with a value of “1” until September 2021, when the moratorium lapsed, whereupon
it takes on a value of “0” once again.

Control variables are included for other factors that impact prices. This includes the total
number of home sales in the county, the population density of the county, and an indicator
variable for year in recognition of the role that inflation and other unmodeled time factors may
play in housing prices. We also include indicator variables for each county, reflecting the fact
that our model cannot capture all of the unique concerns regarding housing that may be present
in every locality. Particularly in Wisconsin, the time of year plays a big role in the housing
market. People are less likely to seek out or sell their homes in the cold parts of the year, leading
to lower prices in general. Consequently, we include indicator variables for Spring, Winter, and
Summer in the model.

Formally, for each county c in month m, let:

 Housing Pricecm= α+ 1Moratoriumm+ 2 cm+ 3 c+ 4 r+ 5Controls+e

If the Moratorium has the effect of increasing housing prices, we will expect a positive
coefficient on 1.

Our second model investigates the correlation between the mortgage forbearance option and
housing prices. Unlike the eviction moratorium, with a clean endpoint, homeowners were able
to enter and exit the program at different times. Consequently, we need an alternative variable to

 Wisconsin Institute for Law & Liberty 6
serve as a proxy for the number of individuals taking advantage of the forbearance. Data from
the Consumer Financial Protection Bureau on the number of homes delinquent on their mortgage
payments for 30-89 days suffices.xiv

Because many mortgage companies report a payment as up-to-date when a loan is in
forbearance, the rate of delinquencies fell significantly after the forbearance programs were
created. Figure 2 show the share of mortgages in this status, with a clear decline from previous
norms in the spring of 2020 when forbearances became a viable option. The monthly rate of
mortgage delinquency serves as our key independent variable in this analysis.

 Figure 2. Percentage of Mortgages 30-89 Days Delinquent Over Time, Wisconsin

 1.6

 1.4
 Percentage Deliquent

 1.2

 1

 0.8

 0.6
 0.4

 0.2

 0
 M 9

 M 0
 M 9

 M 0
 19

 20
 9

 0
 No 9

 No 0
 9

 0
 1

 2
 -1

 -2
 l-1

 l-2
 1

 2
 -1

 -2
 n-

 n-
 v-

 v-
 p-

 p-
 ar

 ar
 ay

 ay
 Ju

 Ju
 Ja

 Ja
 Se

 Se

Formally this model, for each county c in month m, let:

 Housing Pricecm= α+ 1Deliquency Ratem+ 2 cm+ 3 c+ 4 r+ 5Controls+e

If Deliquency Rates has the effect of increasing housing prices, we will expect a positive
coefficient on 1.1

1
 Note that the findings from the first and second model should not be added together. The two federal interventions
occurred concurrently, thus is it is impossible with observational data to isolate the effects independently. If both
interventions are put into a single model, it appears that the mortgage forbearance program is the larger driver of
housing price change.

 Wisconsin Institute for Law & Liberty 7
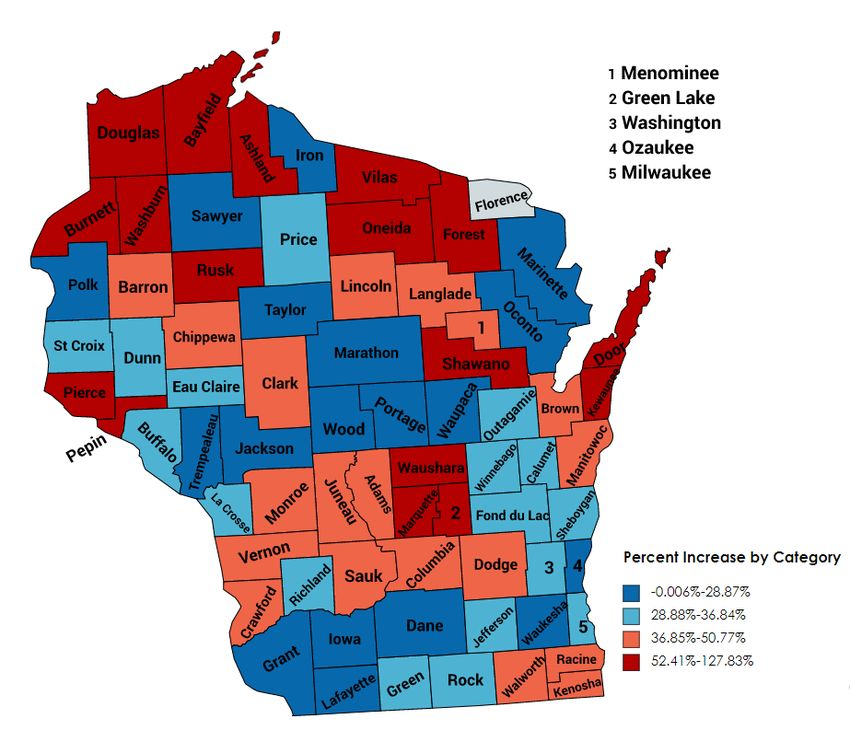
Results

Descriptive Results

First, we examine what has happened to the average price of homes in the state on average over
time. Since January 2019, prices have increased from about $175,000 on average to $240,000—
an increase of $65,000 (37%). Figure 1 depicts the mean home price across Wisconsin’s counties
over the past 36 months. The two red lines represent the time frame in which the eviction
moratorium was in effect. While we cannot demarcate the exact time frame for the mortgage
forbearances, the trends in that market roughly line up with these lines as well. With the naked
eye, there does appear to be a substantial increase during the period in question, followed by a
relatively steep decline following the expiration of the moratorium. However, a deeper analysis
is needed to determine whether this is likely related to the moratoriums, or to other factors.

 Figure 3. Home Prices in Wisconsin, Pre- and Post-Moratorium

Figure 3 depicts the counties in which prices increased the most using the average of the first
three months of 2019 in comparison to the last three months of data for 2021 (through November
2021). The data is divided into quartiles, with each category representing ¼ of the overall
distribution. Note that one county (Florence) lacked data for at least one of these months and, as
such, is excluded from this analysis.

 Wisconsin Institute for Law & Liberty 8
Figure 4. Home Price Percentage Increases by County, January 2020-November 2021

First, we should note that housing price increases were the norm across almost the entire state.
Only one counties saw a decline in home prices over this time frame, and even that was
extremely small (Jackson at -.006%). Perhaps surprisingly, the largest percentage increases were
not seen in urban and suburban areas in general. For instance, Dane County saw price growth of
approximately 24.4%—under the threshold for the lowest percentage growth category. Even
Waukesha County in suburban Milwaukee falls just below the threshold for the second quartile
(24.2%). Instead, the highest price growth appears to be centered in counties, in general, which
are viewed as vacation destinations and rural areas.

This may be a reflection of the manner in which the COVID-19 pandemic changed the choices
that people make about where to live as virtual options became more plentiful. Anecdotal
evidence abounds of young professionals moving to rural areas that once suffered from the

 Wisconsin Institute for Law & Liberty 9
prospect of continual population declines and an aging population.xv In areas with lower housing
stock, even a small uptick in demand for housing can significantly increase prices.

We should note that, despite the percentage changes in cost being largest in rural areas, housing
remains significantly more expensive in urban and suburban areas. The average home price in
Dane County in recent months was over $368,000—compared with $218,000 in the highest-price
growth county in our data (Forest). What can be said for certain from this look at the data is that
the problem of increased housing costs is not just a problem for residents of large cities and their
surrounding suburbs. Instead, Wisconsinites may be priced out of the market in even the smallest
towns.

Statistical Results: Eviction Moratorium

The results for our analysis of prices and moratoriums are depicted in Table 1. Note that
indicator variables for each county in the state were included in the model but excluded from the
Table for ease of readership.

 Table 1. Relationship between Eviction Moratorium & Housing Prices
 (1)
 VARIABLES Home Price

 Moratorium 3,664**
 (1,864)
 2020 13,542***
 (2,029)
 2021 36,272***
 (2,032)
 Total Sales 37.00**
 (15.31)
 Income -3.782***
 (1.013)
 Winter -22,361***
 (1,926)
 Spring -12,988***
 (1,808)
 Summer 66.69
 (1,836)

 Constant 300,429***
 (44,218)

 Observations 2,510
 R-squared 0.750
 Standard errors in parentheses
 *** p
First, we note that many of our control variables work as they should. For instance, the average
price of a home is lowest in winter. According to the model here, the average price of a home in
the winter months is $22,361 lower than the reference season, fall. Also, prices are higher in
2021 on average than 2019 by about $36,272 across the state regardless of moratorium status.

For our variable of interest, we do find a statistically significant impact of the moratorium on
home prices. We estimate that about $3,664 in the increase in the cost of homes in the state can
be attributed to the moratorium. Given the cost of homes increased in Wisconsin by
approximately $65,000 since the beginning of 2019, this represents approximately 5.6% of the
increased cost.

Statistical Results: Mortgage Forbearance

Recall that our independent variable of interest here is the rate of mortgage delinquencies of
between 30 and 89 days. Because this rate fell significantly immediately following the
implementation of broad forbearances, we use the percentage of homes that were delinquent on
their mortgage in the state as a proxy.

 Table 2. Relationship between Mortgage Forbearance and Housing Prices

 VARIABLES Home Price

 Delinquency (Forbearance Rate) -19,557***
 (4,968)
 Total Sales 36.11**
 (16.57)
 Population Density 181.0***
 (41.95)
 Income -5.115***
 (1.381)
 Winter -16,083***
 (2,410)
 Spring -9,338***
 (2,063)
 Summer 2,212
 (2,069)
 2020 9,087***
 (2,350)
 2021 22,226***
 (4,141)
 Constant 369,631***
 (58,035)

 Observations 2,151

 Wisconsin Institute for Law & Liberty 11
R-squared 0.731
 Standard errors in parentheses
 *** p
References

i
 https://www.businessinsider.com/home-gets-122-offers-amid-real-estate-market-surge-2021-3

ii
 https://www.bankrate.com/real-estate/places-where-pay-raises-dramatically-trail-home-price-gains/

iii
 https://www.wsj.com/articles/home-prices-climbed-across-the-u-s-in-second-quarter-11628777839

iv
 https://www.tandfonline.com/doi/abs/10.1080/01944369408975571?src=recsys

v
 https://static1.squarespace.com/static/56b161a622482e966ff4db63/t/59e1207f32601e172d4ec1f4/1507926144
073/homeownership-and-neighborhood-stability.pdf

vi
 https://crsreports.congress.gov/product/pdf/IN/IN11320

vii
 https://www.supremecourt.gov/opinions/20pdf/21a23_ap6c.pdf

viii
 https://www.marketwatch.com/story/mortgage-forbearance-is-about-to-end-for-millions-of-americans-heres-
why-thats-good-news-for-home-buyers-11628609524

ix
 https://doa.wi.gov/Documents/WHH%20Draft%20Plan_Public_Hearings.pdf

x
 https://realestate.wharton.upenn.edu/wp-content/uploads/2017/03/802.pdf

xi
 https://www.federalreserve.gov/econres/notes/feds-notes/the-effect-of-mortgage-forbearance-on-house-
prices-during-covid-19-20210319.htm

xii
 https://www.wpr.org/wisconsin-foreclosure-rates-lowest-theyve-been-2-decades

xiii
 https://www.wra.org/resources/property/wisconsin_housing_statistics/
xiv
 https://www.consumerfinance.gov/data-research/mortgage-performance-trends/about-the-data/

xv
 https://thehill.com/opinion/technology/548259-live-here-work-anywhere-how-the-pandemic-is-reversing-
rural-trends

xvi
 https://www.wra.org/Legislative/Special_Reports/WRA_2019_Workforce_Housing_Report__Falling_Behind/

 Wisconsin Institute for Law & Liberty 13
Will Flanders, PhD is a Research Director at the
 Wisconsin Institute for Law and Liberty.
 He can be reached at Flanders@will-law.org.

 330 East Kilbourn Ave.|Suite 725
 Milwaukee, WI 53202

 will-law.org
 414-727-9455

 @WILawLiberty

 Wisconsin Institute for Law & Liberty 14
You can also read