Preliminary Thermal Validation Tests for Education-Class CubeSats and Weather-Balloon Payloads - Journal of Small Satellites
←
→
Page content transcription
If your browser does not render page correctly, please read the page content below
Okutsu, M. et al. (2021): JoSS, Vol. 10, No. 1, pp. 983–993
                                  (Peer-reviewed article available at www.jossonline.com)

www.adeepakpublishing.com                                                                         www. JoSSonline.com

     Preliminary Thermal Validation Tests for
     Education-Class CubeSats and Weather-
                Balloon Payloads
                                        Lingqi Li and Kenjiro S. Lay
                                                      Penn State University
                                                 State College, Pennsylvania, US

                                                  Masataka Okutsu
                                                  Penn State University Abington
                                                   Abington, Pennsylvania, US

Abstract

    Low development and launch costs of CubeSats, a type of small spacecraft typically one to three liters in
volume, have made space science accessible to educational institutions, offering engaging opportunities for stu-
dents in the science, technology, engineering, and mathematics (STEM) disciplines. Some university teams work-
ing on these education-class CubeSats conduct high-altitude flight experiments using balloons to test their instru-
ments in the harsh environment at the edges of the troposphere and the stratosphere. Whether for the balloon
experiment or for the actual spaceflight, temperatures of the operating environments are of concern. Instruments
flown in space must be qualified for wide thermal ranges (e.g., −40°C to 70°C) in vacuum conditions. Likewise,
instruments flown on the balloons must be able to operate in a similarly large range of temperatures (e.g., −50°C
to 50°C) in the reduced pressure environment. Unfortunately, a thermal-vacuum chamber—standard testing
equipment for spacecraft—is not accessible to many university teams. This paper presents incubator testing and
cooling-bath testing methods as preliminary thermal validation tests that may be carried out easily, safely, and
inexpensively, without any need for the expensive thermal-vacuum chamber. We also discuss an add-on demon-
stration in which a CubeSat prototype was flown on a weather balloon to an altitude of ~16 km. The two lab tests
and the flight described in this paper may be adopted by university teams to conduct preliminary thermal valida-
tion tests for their education-class CubeSats and weather-balloon payloads.

   Introduction                                                    and Ahlgren, 2001), these small satellites have been
                                                                   making space science accessible to a large number of
    With the establishment of CubeSat development                  educational institutions. One of the reasons CubeSats
standards over two decades ago (Puig-Suari, Turner,                achieve low costs is their small size, being measured

Corresponding Author: Masataka Okutsu – masataka.okutsu@psu.edu
Publication History: Submitted – 08/22/20; Accepted – 01/12/21; Published: 02/26/21

Copyright © A. Deepak Publishing. All rights reserved.                                          JoSS, Vol. 10, No. 1, p. 983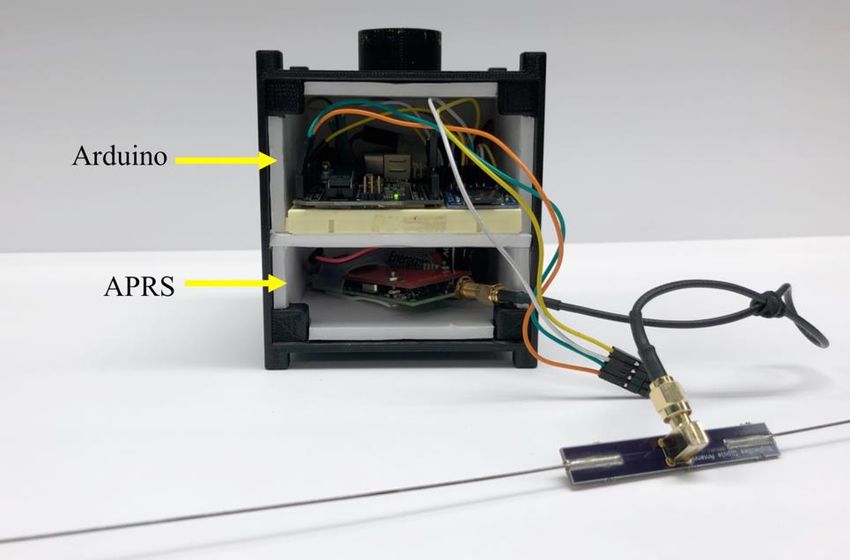
Okutsu. et al.

in the unit (“U”), where 1 U has the dimensions of 10       al., 2015). Seitzer et al. (2018) flew a balloon payload
cm × 10 cm × 10 cm. The most common sizes of Cu-            equipped with light-emitting diode (LED) panels, and
beSats have been 1-3 U, although in recent years, one       demonstrated the feasibility of using an active illumi-
sees an increasing number of CubeSats with higher ca-       nation on spacecraft to track the spacecraft’s position,
pabilities and larger sizes, e.g., 6 U or even 12 U         attitude, and telemetry.
(Skrobot and Coelho, 2012).                                      Balloon experiments also offer educational values
     Among 400 CubeSats launched between 2002 and           to students working on small-satellite projects. For in-
2016, approximately half of them were built by uni-         stance, the Missouri University of Science and Tech-
versities (Zea et al., 2016). In addition, the number of    nology Satellite Research Team has developed a Cu-
university-built CubeSats launched in a given year has      beSat prototype and flown it on a balloon for the Uni-
increased over time. During the 24-year period from         versity’s aerospace engineering curriculum (Davis et
January 1994 to December 2017, a total of 344 univer-       al., 2019). Through the Air Force Office of Scientific
sity-built spacecraft were launched into space; approx-     Research (AFOSR) University Nanosatellite Program,
imately two-thirds of them were CubeSats launched in        42 students in a two-semester senior design course at
the last eight years (i.e., January 2010 to December        the New Mexico State University designed a nanosat-
2017) (Swartout, 2018). Recognizing the CubeSat’s           ellite prototype that collected photomultiplier data and
potential “to attract and retain students in the science,   measured intensities of the ultraviolet light (Horan,
technology, engineering, and mathematics disci-             Hull, and Alvarez, 2012). More than 350 undergradu-
plines,” NASA established Educational Launch of             ate student teams have participated in High Altitude
Nanosatellites (ELaNa), which allows university-built       Research Platform (HARP) balloon experiments. With
CubeSats to be launched by NASA rockets (Skrobot            support from NASA’s ELaNa program, the AFOSR
and Coelho, 2012). To ensure that their CubeSat is fly-     University Nanosatellite Program, and NSF’s CubeSat
able for ELaNa, a team must conduct environmental           program, these students were able to get involved in
testing, which can “include vibration, thermal vacuum       the development of many small satellites, two of
bakeout, shock, and electromagnetic interference/elec-      which have been deployed into orbit (Voss et al.,
tromagnetic compatibility (EMI/EMC) testing”                2015).
(NASA CubeSat Launch Initiative, 2017). A team                   During those balloon flights, the thermal state
must also ensure that a ground station can locate, send     within the CubeSat prototype is affected by various
commands to, and downlink data from the CubeSat in          factors, including the heat rejection to the cold outside
orbit. In addition to those tests conducted in the lab,     air, the radiation from the sunlight, and the internal
some features of CubeSats may be tested from high-          heat generated by electronic power consumption.
altitude balloon tests.                                     Quantifying these effects is often challenging, as the
                                                            material used in the outer casing of the payload alone
1.1. Balloon Flights for Preliminary Testing of Cu-         could affect the temperatures at various locations on
     beSats                                                 the payload. The thermal effects can be modeled using
                                                            such methods as finite-element analysis. However, re-
    According to the Standard Atmosphere model, the         sults from theoretical calculations are often unreliable,
atmospheric pressures at altitudes of 15 km (nearly at      partially because many input parameters of student-
the upper edge of the troposphere) and 30 km (in the        built prototypes may be unknown, such as the effec-
stratosphere) are 12% and 2% of the values at sea           tiveness of thermal insulation provided by the struc-
level, respectively, and the temperatures at those alti-    tural skin. A CubeSat team faces the challenge of not
tudes are −57°C and −47°C, respectively (Interna-           knowing how, or whether, their instruments will per-
tional Organization for Standardization, 1975). A bal-      form when flown on balloons.
loon flight is useful for testing various features of
small satellites, including long-range radio operated in
harsh environments (Kimm et al., 2015; Tømmer et

Copyright © A. Deepak Publishing. All rights reserved.                                     JoSS, Vol. 10, No. 1, p. 984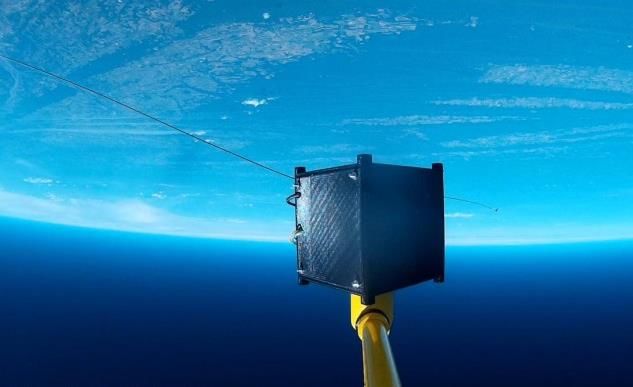
Preliminary Thermal Validation Tests for Education-Class CubeSats and Weather-Balloon Payloads

1.2. Thermal Validation Tests                                     To properly simulate the space environment, the pres-
                                                                  sure inside of the thermal-vacuum chamber needs to
     Whether for balloon flights or spaceflights, there           be very low, e.g., 10−5 torr (i.e., ~10−8 atm) (George
is a need for lab tests to validate the operational capa-         C. Marshall Space Flight Center, 2020), because the
bilities of the instruments. Among the validation tests           presence of atmosphere introduces alternative paths
CubeSats must pass to qualify for spaceflights, the               for heat transfers via conduction and convection, both
thermal-vacuum test is perhaps the most important and             of which have diffusing effects on the concentration of
expensive (Busch et al., 2013). Since thermal factors             heat within the instruments and structure. As a result,
influence the success of any CubeSat missions, ther-              the presence of atmosphere can reduce the temperature
mal-vacuum chamber tests will help ensure the space-              of the components, both in the high- and low-temper-
craft operates within the anticipated thermal range.              ature tests. The difference in the temperatures of the
     A CubeSat launched into low Earth orbit is subject           components tested under the two conditions could be
to heat from various sources, including sunlight (both            20°C or more (Gibbel, 1990).
direct and albedo), infrared radiation from Earth, and                Unfortunately, most teams working on the educa-
internal heating due to electronic power consumption.             tion-class CubeSats do not have thermal-vacuum
With an inability to reject heat to the surrounding en-           chambers. Outsourcing this test may be costly—e.g.,
vironment via conduction and convection (there is no              $4,000 per experiment (Space Dynamics Laboratory,
air in space), the temperature may rise within the                2019)—and require travel to a lab with such a facility.
spacecraft. Overheating may cause such problems as                Although the final qualification tests (e.g., for
damaged electronic components, melted battery packs,              NASA’s missions) require an actual thermal-vacuum
and broken solder joints (NASA CubeSat Launch Ini-                chamber, the teams may benefit greatly from conduct-
tiative, 2017).                                                   ing preliminary thermal tests with ease, safety, and
     Because sunlight is the largest heat source for the          low cost.
CubeSat body (Escobar, Diaz, and Zagal, 2016), the
total heat flux on the orbiting CubeSat drops sharply                 Objectives
as the spacecraft flies into the shadow side of the
planet. Occupying an extremely low-thermal environ-                   In this paper, we consider simple thermal testing
ment for too long is also a problem, because low tem-             methods that may be used for preliminary validation
peratures degrade performance, if not halt the opera-             of education-class CubeSats and balloon payloads.
tion, of batteries and electronic components.                     The thermal cycling test, which simulates the antici-
     The thermal-vacuum tests validate the instru-                pated thermal cycling during the spaceflight, probes
ments’ operational capabilities both at the high and the          potential risks that may lead to failures of missions. A
low ends of the anticipated thermal bounds. There are             reasonable data output validates the survivability and
two types of thermal-vacuum tests: bakeout tests and              the operational capabilities of the instruments in the
cycling tests. Nearly all CubeSat missions require the            target thermal environments. However, the cost or ac-
thermal-vacuum bakeout tests, in which a spacecraft is            cess to the test facility capable of such a test may be
placed into a heated vacuum chamber for long enough               prohibitive for many teams working on education-
to outgas contaminants trapped within the instruments,            class CubeSats.
thereby reducing the probability of malfunction during                As an easy and inexpensive substitute for the ther-
the actual spaceflight.                                           mal vacuum cycling tests, we present lab tests that are
     The thermal-vacuum cycling test, on the other                conducted in non-vacuum conditions. Al-though con-
hand, is not typically an official acceptance test, but an        ducted under standard atmospheric conditions, these
internal functionality test that teams perform for them-          lab tests allow the instruments to be tested at low and
selves. The thermal-vacuum cycling test simulates the             high temperature environments (e.g., −50°C and 50°C
anticipated thermal cycling experienced during space              for two hours at each extreme), as done in the thermal-
missions (NASA CubeSat Launch Initiative, 2017).                  vacuum cycling tests. When these tests are conducted

Copyright © A. Deepak Publishing. All rights reserved.                                              JoSS, Vol. 10, No. 1, p. 985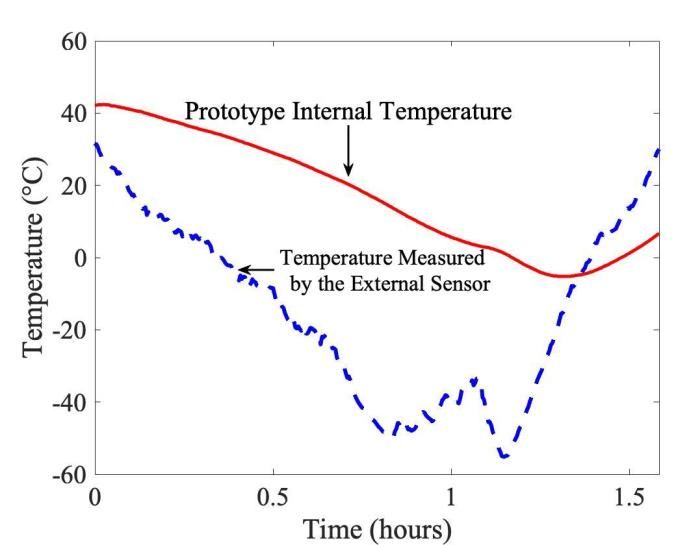
Okutsu. et al.

properly, we expect the interior temperature of a Cu-        uum high-temperature testing, on the other hand, pro-
beSat prototype body (e.g., initially at a room temper-      vides a more moderate testing environment, because
ature) to exhibit a warming or cooling effect, asymp-        the presence of atmosphere could diffuse the high con-
totically approaching the ambient temperatures tar-          centration of temperature within a hardware piece
geted in those lab tests.                                    (Gibbel, 1991). That said, given the cost of the thermal
     For a high-temperature test, there are several pos-     vacuum tests, our non-vacuum tests are useful prelim-
sible candidates for experimental devices (e.g., an          inary thermal tests.
oven), so our version of the test was included primarily          This paper also discusses a weather balloon flight
for completeness and as an example. We made use              of a CubeSat prototype as an add-on demonstration, in
here of an incubator in a biology lab, which is nor-         which the instruments are subject to ranges of temper-
mally used for cell culture growth and main-tenance.         atures and pressures over varying altitudes. Such ac-
The incubator can stably maintain a target temperature       tivity validates the functionality of the instruments, be-
set by an experimenter. We used a representative tem-        cause the measured temperatures can be compared
perature of 50°C.                                            against the values predicted from the Standard Atmos-
     While there are many methods to create a heated         phere model at corresponding altitudes.
testing environment, testing at a low temperature is              The weather balloon used in our experiment is a
more challenging, because devices that produce de-           latex sounding balloon, a few meters in diameter when
sired temperatures are often unavailable. A freezer, for     inflated. The use of a weather balloon has the ad-
instance, may be too warm or too cold for the needed         vantages of low cost and logistical simplicity, al-
testing.                                                     though when the payload exceeds certain sizes and
     For a low-temperature lab test, there is a gap in the   weight, the flight within the US must comply with the
literature on methods available for use by a typical         Code of Federal Regulations (CFR) Title 14 Part 101.
team working on education-class CubeSats and bal-            Our weather balloon is smaller and lighter than scien-
loon payloads. In this paper, we present a technique of      tific research balloons flown, for example, by NASA’s
cooling bath for producing temperatures required for         Balloon Program Office and the Columbia Scientific
balloon flights or actual spaceflights. The low temper-      Balloon Facility; their balloons have the payload ca-
ature of a cooling bath is maintained by a cooling agent     pacity of several metric tons and flight duration ex-
(e.g., dry ice) that depresses the temperature of the sol-   ceeding 40 days. Scientific balloons such as this, i.e.,
vent. We use a representative temperature of −50°C.          zero-pressure polyethylene film balloons, were used in
     Our thermal range of −50 to +50°C is also repre-        Louisiana State University’s High Altitude Student
sentative of the thermal-vacuum cycling tests con-           Platform (HASP), which allowed many student-built
ducted prior to the high-altitude research balloon           payloads to be tested in a near-space environment
flights (Guzik et al., 2018). In those tests, the testing    (Guzik et al., 2008).
duration of two hours at each end of the temperature              In our demonstration, a relatively small weather
bounds is considered typical (LaSPACE HASP Team              balloon was used to fly the CubeSat prototype to the
and NASA Balloon Program Office, 2020). Our incu-            altitude of ~15 km, where the temperature is approxi-
bator tests and cooling-bath tests are conducted in a        mately −57°C and the pressure is approximately 12%
standard atmospheric condition. Such a non-vacuum            of the sea-level value. This flight test serves as a proof-
testing, which introduces alternative paths for heat         of-concept demonstration.
transfers through atmospheric conduction and convec-
tion, is not a perfect substitute for vacuum testing. A         The CubeSat Prototype
non-vacuum, low-temperature test provides a more se-
vere testing environment, because the presence of cold           We demonstrate the thermal test methods using a
air can make the temperature of CubeSat components           simple prototype of CubeSat. The 3D-printed proto-
much lower than in the vacuum condition; non-vac-            type body (Figure 1) provides a mock-up structure of
                                                             a 1 U CubeSat.

Copyright © A. Deepak Publishing. All rights reserved.                                        JoSS, Vol. 10, No. 1, p. 986
Preliminary Thermal Validation Tests for Education-Class CubeSats and Weather-Balloon Payloads
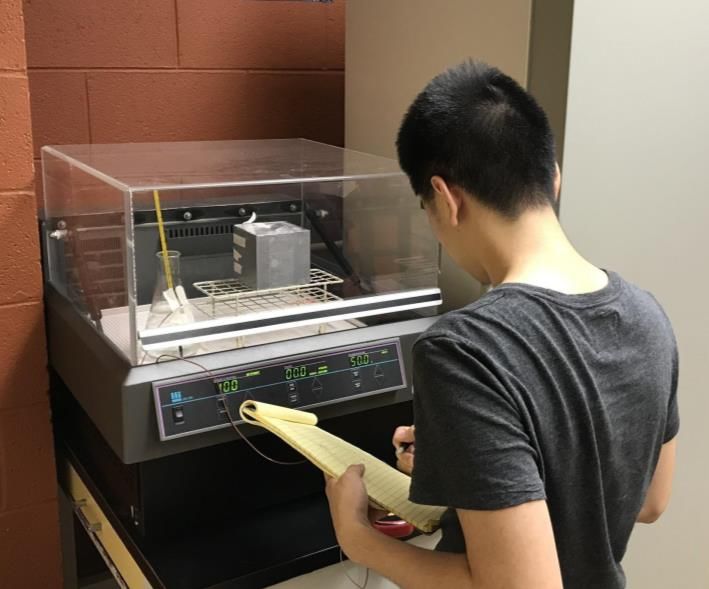
in Figure 2), which is normally used for growing mi-
crobiological or cell cultures in a biology lab. Prior to
the experiment, the incubator was preheated for a more
than sufficient duration to ensure thermal stability at
50°C. During the testing duration of two hours, the
temperature of the incubator was manually recorded
every seven minutes (on average). The air temperature
inside of the CubeSat prototype was measured using
Arduino with the BME280 thermal sensor, which rec-
orded data every 15 seconds. Because polylactic acid
(PLA) used in 3D printing is a thermoplastic material
that softens at the chosen testing temperature of 50°C,
the CubeSat prototype’s body for this test was re-
placed by acrylic plastic.
Figure 1. Internal view of the 1 U CubeSat prototype containing Ar-
duino and APRS modules.
The prototype used in our demonstration is based
on Arduino, a popular microcontroller which has also
been considered for use in CubeSat applications (Pe-
ters, 2016). Thermal measurements are enabled by the
Arduino Uno R3 microcontroller, the BME280 sensor
(for the ambient air temperature), and the DHT22 sen-
sor (for the internal air temperature).
We also make use of the Automatic Packet Report-
ing System (APRS), which is an amateur-radio-based
synchronous communication system used by many us-
ers within a given geographical area, where received
data are uploaded to the Internet to be shared globally
(Bruninga, 2020; Bruninga et al., 2017). The APRS
transmitter, which has a built-in GPS tracking unit, fits
Figure 2. Prototype undergoing high-temperature tests.
inside of the 1 U prototype body, but its antenna was
attached on the outer surface of the prototype body.
4.2. In-Lab Thermal Test at Low Temperature
The power for the instruments was supplied by the 9V
Energizer Ultimate Lithium Battery, which has an op- The in-lab thermal test at low temperature was the
erational thermal range of −40°C to 60°C (Energizer, main challenge of our study. Teams working on edu-
2020). Most other components mentioned above were cation-class CubeSats and weather balloon payloads
assumed to have typical thermal operational ranges, would need to know, for example, how their instru-
e.g., −40°C to 85°C. ments (rated for > −40°C) would perform when placed
in an enclosed casing (with partial thermal insulation)
Method and subjected to < −50°C for some duration of time.
Unlike the case of high-temperature experiments,
4.1. In-Lab Thermal Test at High Temperature choices of devices for producing low temperatures are
limited. This is a problem, as there may not be any ac-
For the thermal test at a high temperature, we used
cessible devices that are able to produce the target tem-
an incubator (Lab-Line 4628 Incubator Shaker, shown
perature (e.g., a freezer being too warm or too cold).
Copyright © A. Deepak Publishing. All rights reserved. JoSS, Vol. 10, No. 1, p. 987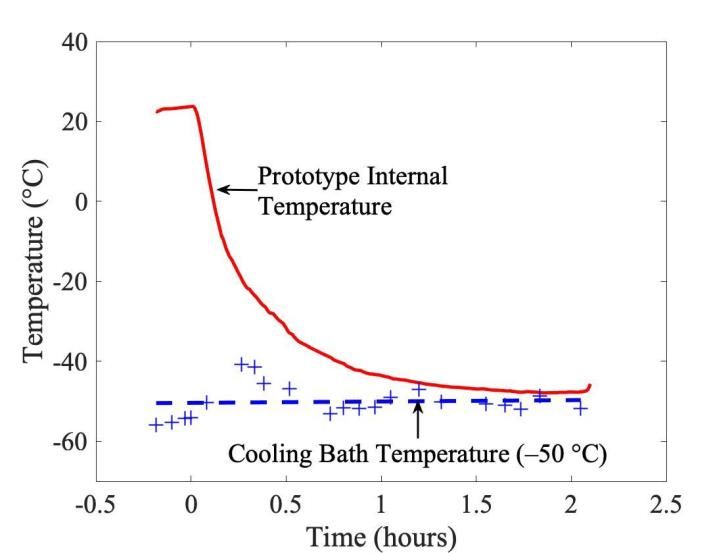
Okutsu. et al.

    We show how a technique of cooling baths could                      were evaluated for their toxicity, ease of handling, and
potentially serve as an easy, safe, and inexpensive pre-                environmental impact.
liminary thermal validation test. An example set-up is                       According to Capello, Fischer, and Hungerbuhler
shown in Figure 3. In a cooling bath, a test specimen                   (2007), there are many reputable studies on the envi-
is submerged into the bath with a temperature that has                  ronmental, health, and safety (EHS) impacts of sub-
been depressed by cooling agents, common choices                        stances; among over 100 substances included in their
being water ice and dry ice. With our target tempera-                   database, these researchers chose 26 commonly used
ture of −50°C (lower than what is possible with water                   pure organic solvents (e.g., alcohols, alkanes, diox-
ice), an obvious cooling agent was dry ice, which has                   anes) for comprehensive EHS analysis, and ranked
the sublimation point of −78.5°C. Dry ice is relatively                 ethanol and methyl acetate as the least harmful. Me-
inexpensive and easily obtained (e.g., from a local liq-                thyl acetate is not as easily obtained as ethanol, so we
uor store, in our case).                                                chose ethanol as a solvent for the cooling bath. How-
                                                                        ever, the cooling bath temperature using ethanol as the
                                                                        only solvent is −78°C (Lee and Jensen, 2000), which
                                                                        is a problem because we chose −50°C as our target
                                                                        temperature.
                                                                             We faced a similar situation as Lee and Jensen
                                                                        (2000), who frequently needed to create cooling baths
                                                                        at temperatures between −80°C and −20°C, but found
                                                                        that methods reported in the literature proved imprac-
                                                                        tical due to the unavailability of solvents or to the ther-
                                                                        mal instability of the bath. The researchers showed
                                                                        how mixing ethanol with ethylene glycol, which pro-
                                                                        duces bath temperatures of −78°C and −12°C, respec-
                                                                        tively, would produce a cooling bath at temperatures
                                                                        between those two values. In fact, in the case of those
                                                                        two solvents, the relationship between the target tem-
                                                                        perature and volumetric mixture ratio was approxi-
                                                                        mately linear: an experimenter can easily predict the
                                                                        bath’s temperature by changing the mixture ratio of
                                                                        the two solvents.
Figure 3. Cooling bath based on dry ice and the RV antifreeze was too        Ethylene glycol, which is an active ingredient for
warm (photo). Our target temperature (−50°C) required that a substan-
tial portion of the solvents be replaced with ethanol.                  automotive antifreeze, is unfortunately toxic to hu-
                                                                        mans and animals, requiring extra care in handling and
    Choosing a solvent required additional thinking, as                 disposal. So instead, we propose using an antifreeze
there are numerous candidates. Empirical studies have                   solution based on propylene glycol as a second solvent
shown that, when mixed with an excess of dry ice, dif-                  to be mixed with ethanol. Commonly considered as a
ferent solvents equilibrate at different temperatures.                  non-toxic substitution for ethylene glycol (Thomas,
For example, methanol, ethanol, acetone, and isopro-                    2008), propylene glycol is used as an active ingredient
panol were found to produce bath temperatures be-                       for antifreeze for recreational vehicles (RVs). The
tween −80°C to −70°C. (The melting points of those                      pink-colored solution, which could be obtained from
solvents are −114°C to −89°C; the temperatures of                       any automotive supply store, is non-toxic and can be
cooling baths are higher than the melting points of the                 disposed of into a drain. The particular brand of RV
solvents used.) We also preferred solvents that al-                     antifreeze used in our experiment was Super Tech RV
lowed our cooling-bath experiments to be carried out                    & Marine Antifreeze (manufactured by Fox Packaging
by students easily and safely. As such, the solvents                    Co., St. Paul, Minnesota, US), which was rated for

Copyright © A. Deepak Publishing. All rights reserved.                                                   JoSS, Vol. 10, No. 1, p. 988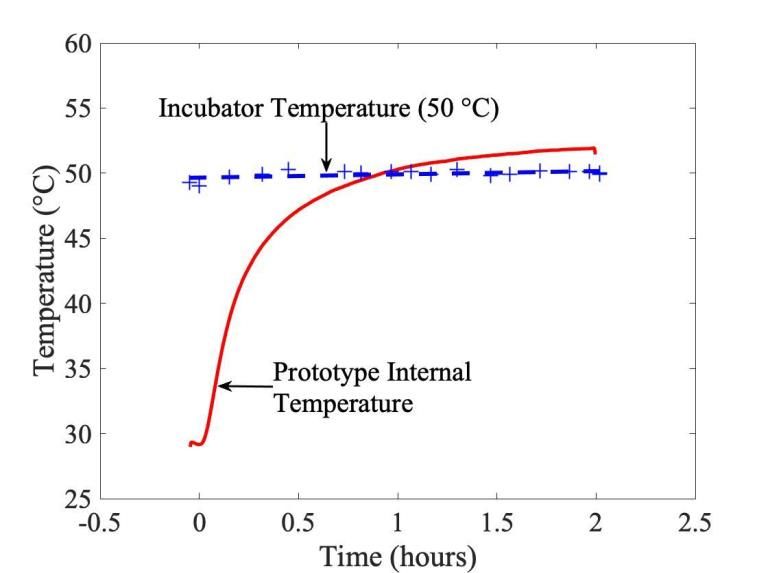
Preliminary Thermal Validation Tests for Education-Class CubeSats and Weather-Balloon Payloads

−46°C. The antifreeze contains 30% propylene glycol,                   get temperature was set to 50°C, the actual tempera-
with the remaining 70% being water and additives.                      ture reported by the machine ranged from 49.0°C to
    We used equal parts of ethanol and RV antifreeze,                  50.3°C. The slight variance is indicated by the “+”
and found that the resulting cooling-bath temperature                  marker interspersed along the blue dashed line. The
was approximately −50°C. To conduct the cooling-                       blue dashed line is the fitted data of those measure-
bath experiment, we filled a container with a mixture                  ments, and the best estimate of the measured incubator
of ethanol and RV antifreeze, whose temperature was                    temperature is 49.9°C.
depressed by adding pellets of dry ice (Figure 4). The
CubeSat prototype was placed in a sealed bag and sub-
merged into the bath. Although not shown in the fig-
ure, a weight was placed on the top of the sealed bag
to ensure that the bag submerged completely into the
bath. Spacers were placed between the prototype body
and the sealed plastic bag so the bag retained its shape
and so contact was prevented between the prototype
body and the bath. The air, which surrounds the proto-
type body, is what cooled to the target temperature.

                                                                       Figure 5. Results from the high-temperature testing using an incubator.

                                                                            The red solid line shows the temperature of air in-
                                                                       side the CubeSat prototype, as measured by the Ar-
                                                                       duino’s BME280 sensor. In the beginning of the ex-
                                                                       periment, the prototype’s internal temperature was
                                                                       29°C—the temperature of the room in which the incu-
Figure 4. The CubeSat prototype was enclosed in a sealed plastic bag
                                                                       bator machine was located. Once the prototype was
and fully submerged into a cooling bath at −50°C.                      placed in the incubator, the internal temperature
                                                                       started to rise, but the rate of increase in the tempera-
    A thermocouple was used to measure the bath’s                      ture decreased over time. After the two-hour testing
temperature (Figure 4), which was manually recorded                    duration, the internal temperature was 51.9°C. The
every 5–10 minutes. Dry ice pellets were added peri-                   fact that the final temperature was 2°C higher than the
odically to maintain the target temperature. During the                incubator temperature could be (we believe it is likely)
testing duration of two hours, Arduino recorded the                    attributed to the electronic power consumption within
CubeSat’s internal air temperature every 15 seconds.                   the enclosed prototype structural casing.

   Results                                                             5.2. Cooling Bath

5.1. Incubator                                                            The result from our cooling-bath experiment is
                                                                       shown in Figure 6. The measured temperature of the
    Figure 5 shows the results from the high-tempera-                  cooling bath ranged from −56°C to −41°C (shown as
ture test, which lasted for two hours. Although the tar-

Copyright © A. Deepak Publishing. All rights reserved.                                                         JoSS, Vol. 10, No. 1, p. 989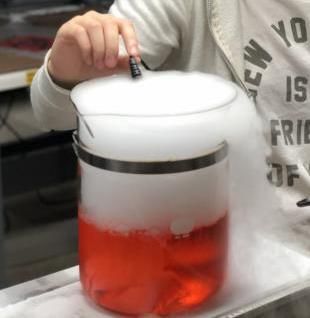
Okutsu. et al.

“+” marker). The blue dashed line is a fitted line plot-                flight as an add-on demonstration. The CubeSat instru-
ted on those data points, where the best estimate of the                ments (which were tested in the non-vacuum lab tests)
bath temperature is −50.1°C.                                            are now subject to a range of thermal and reduced-
                                                                        pressure conditions corresponding to varying alti-
                                                                        tudes.
                                                                            Figure 7 shows a photo image of our prototype
                                                                        near the maximum altitude. We see antennas for the
                                                                        APRS transmitter extending beyond the 1-U dimen-
                                                                        sions of the 3D-printed structure. Although not seen in
                                                                        the photo, the DHT22 sensor (placed inside of the
                                                                        body) and the BME280 sensor (placed outside) were
                                                                        used to measure the temperatures of the air inside the
                                                                        enclosed cubic structure and the outside ambient air,
                                                                        respectively.

Figure 6. Temperature change of prototype internal temperature versus
cooling bath temperature.

     The red solid line shows the prototype’s internal
temperature recorded by the BME280 thermal sensor.
The internal temperature was initially 23.7°C, which
was the room temperature at the time of experiment.
As soon as the prototype was submerged into the cool-
ing bath, the temperature of the air inside the prototype
started to decrease sharply, although the rate of de-                   Figure 7. This image of the CubeSat prototype was captured at an alti-
                                                                        tude of 16 km. We note that the apparent curvature of the horizon is
crease lessens over time. Figure 6 shows the exponen-                   caused by the wide-angle lens of the camera.
tial decay of the internal temperature with respect to
time. At the end of the two-hour experiment, the inter-                     The flight demonstration enables us to validate the
nal temperature reached its lowest value −47.9°C, ap-                   functionality and accuracy of thermal sensors, as the
proaching the liquid’s average temperature (i.e.,                       measured temperature could be compared against the
−50.1°C). As in the case of the high-temperature incu-                  expectations, e.g., the values from the standard atmos-
bator test, the final internal temperature was ~2°C                     pheric model. A balloon demonstration is also im-
higher than the temperature of the environment, likely                  portant because GPS tracking and any features con-
due to the heat generated by power consumption. The                     nected to the radio communications cannot be fully
experiment showed that the instruments placed in the                    tested in lab testing.
flight configuration would be fully functional in an en-                    If the CubeSat stayed on the ground, the internal
vironment at −50°C for two hours.                                       temperature of the enclosed cubic body could rise due
                                                                        to the radiation from the sunlight, and, to a lesser ex-
   Flight Demonstration via Weather Balloon                             tent, the heat generated by the power consumption of
                                                                        the instruments. The ambient air temperature during
    In addition to the two lab tests that simulate the                  the flight, on the other hand, decreases as the balloon
thermal cycling test, we conducted a weather-balloon                    ascends to higher altitudes, resulting in an escape of

Copyright © A. Deepak Publishing. All rights reserved.                                                         JoSS, Vol. 10, No. 1, p. 990
Preliminary Thermal Validation Tests for Education-Class CubeSats and Weather-Balloon Payloads
heat to the outside air through conduction and convec- Standard Atmosphere model (International Standard
tion. The net heat transfer was difficult to quantify, as Organization, 1975). The lowest recorded external
the density of the air reduces dramatically as the alti- temperature was −55°C, which was also close to
tude increases. We also did not know the effectiveness −57°C, as expected in the Standard Atmosphere
of the thermal insulation provided by the structural model. After the balloon burst, the CubeSat prototype
skin. descended via parachute. As the altitude decreased, the
If our instruments failed due to the temperature, we air temperature increased. At the moment of landing,
conjectured (based on previous experience) that the the measured ambient air temperature was 30°C,
more likely reason would be a cooling of the body’s which was consistent with the temperature reported by
internal temperature, rather than in a rise in tempera- the local airport.
ture. To ensure all instruments worked properly during
the flights, we placed hand warmers in the prototype
15–20 minutes before the flight. The hand warmers,
which served the purpose of preheating the structure,
were likely ineffective soon after being placed in the
enclosed body, as the hand warmers’ heat generation
requires oxygen to react. (After completing all experi-
ments, we now think that the hand warmers were prob-
ably unnecessary.)
On June 27, 2019, at 9:45 AM, our balloon pay-
load was released in central Pennsylvania. One hour
and five minutes after launch, the balloon payload
reached its maximum altitude of 16.3 km (~54 thou-
sand feet). The balloon burst, and the payload de-
scended via parachute. The payload eventually landed
68 km east of the launch site. Because APRS was set Figure 8. Recorded internal and external temperature during the
to transmit its coordinates in real-time, we could chase weather-balloon flight. The time axis indicates the flight duration from
the balloon and locate it after landing. The total time launch to landing.
of flight was 1 hour 35 minutes. The near-ground tem-
perature reported by University Park Airport (FAA The red solid line shows the internal temperature
LID: SCE) at the time of the launch and landing were recorded by the DHT22 sensor. We can see in Figure
28°C and 30°C, respectively. 8 that the internal air temperature (42°C) was initially
Figure 8 shows the thermal-measurement results higher than the ambient temperature (30°C) due to the
from the flight test. The blue dashed line and the red use of the aforementioned hand warmers. As the pay-
solid line show the external temperature measured by load ascended into the sky, the heat was escaping into
the BME280 sensor and the internal temperature the ambient air, which continued to cool. Even so, the
measured by the DHT22 sensor, respectively. The hor- air inside the prototype never went below −5°C, pre-
izontal axis shows the time since launch (so time zero sumably due to the hand warmers, the partial thermal
is at 9:45 AM) to the moment of landing (11:20 AM). insulation provided by the walls of the prototype body,
The temperature of the air at the launch site was and the warming effects from the sunlight. A similar
recorded as 30°C, initially. During the first half of the lag between the external and internal temperatures was
flight, when the balloon was ascending, the ambient observed during the parachute-descent phase. The in-
air temperature decreased with respect to rising alti- ternal temperature at the time of landing was 6°C, sig-
tudes. Although a temperature-altitude plot was not in- nificantly lower than the ground air temperature of
cluded in this paper, the two variables exhibited an ap- 30°C.
proximately linear relationship, as expected from the
Copyright © A. Deepak Publishing. All rights reserved. JoSS, Vol. 10, No. 1, p. 991Okutsu. et al.
Conclusion References
High-altitude testing using a weather balloon has Bruninga, B. (2020): “Automatic Packet Reporting
been considered an effective demonstration of some System.” Available at: www.aprs.org (accessed
features of CubeSats. Whether for high-altitude bal- Aug. 6, 2020).
loon flights or actual missions in outer space, the hard- Bruninga, B. et al. (2017): PSAT: University Amateur
ware must be prepared for harsh thermal environ- Radio Satellite Success Story—Mission Review
ments. Unfortunately, thermal-vacuum chambers— and Lessons Learned from 18 Months on Orbit,
standard testing equipment for spacecraft—are not ac- presented at the 31st Ann. AIAA/USU Conf. on
cessible to many university teams. To those working Small Satellites, Logan, UT, Aug. 5–10. Paper
on education-class CubeSats, there is a need for easy SSC17-WK-42.
preliminary testing methods. For many teams, con- Busch, S. et al. (2013): Robust Satellite Engineering in
ducting high-temperature testing may not be a serious Educational Cubesat Missions at the Example of
obstacle, since there are choices of heating devices. In the UWE-3 Project. IFAC Proc. Vols., Vol. 46
our experiment, an incubator in a biology lab was used (19), pp. 236–241. doi: 10.3182/20130902-5-DE-
to produce a testing environment at 50°C. Conducting 2040.00127.
a similar test at the low-temperature bound is more Capello, C., Fisher, U., and Hungerbühler, K. (2007):
challenging, due to the lack of readily available and What Is a Green Solvent? A Comprehensive
adjustable devices (e.g., a freezer that is too warm or Framework for the Environmental Assessment of
too cold). We propose a cooling bath as a testing Solvents. Green Chemistry, Vol. 9, No. 9, pp. 927–
method for preliminary thermal testing at low temper- 934. doi: 10.1039/b617536h.
atures. In our experiment, the target temperature of Davis, J. et al. (2019): Development of a High-Alti-
−50°C was produced by adjusting the volume ratio tude Balloon CubeSat Platform for Small Satellite
(50:50) of ethanol and RV antifreeze (containing 30% Education and Research, presented at the 33rd
propylene glycol), which were selected for their non- Ann. AIAA/USU Conf. on Small Satellites, Lo-
toxicity, low cost, and availability. Finally, a high-al- gan, UT, Aug. 5–8. Paper SSC19-WP1-03.
titude demonstration was conducted by flying our Cu- Energizer. (2020): “Energizer Ultimate Lithium 9V
beSat prototype on a weather balloon. The activities Batteries.” Available at: https://www.energizer.
described in this paper serve as easy, safe, and inex- com/batteries/energizer-ultimate-lithium-batteries
pensive preliminary thermal tests, as well as a compel- (accessed Aug. 5, 2020).
ling flight demonstration for teams working on educa- Escobar, E., Diaz, M., and Zagal, J. C. (2016): Evolu-
tion-class CubeSats and weather-balloon payloads. tionary Design of a Satellite Thermal Control Sys-
tem: Real Experiments from a CubeSat Mission.
Acknowledgements Appl. Thermal Eng., Vol. 105, pp. 490–500. doi:
10.1016/j.applthermaleng.2016.03.024.
This work was supported by Penn State Univer- George C. Marshall Space Flight Center (2020): Ther-
sity’s Multi-Campus Research Experience for Under- mal Vacuum Bakeout Specification for Contami-
graduates (MC-REU) and Abington College Under- nation Sensitive Hardware. Available at:
graduate Research Activities (ACURA). We are grate- https://standards.nasa.gov/standard/msfc/msfc-
ful to Margaret S. Morris for her feedback on the man- spec-1238 (accessed Aug. 11, 2020).
uscript and to Zafer Hatahet, Ola El-Rashiedy, and Pa- Gibbel, M. (1990): Thermal/Vacuum vs. Thermal At-
ras Teller for their advice and assistance on the lab ex- mospheric Testing of Space Flight Electronic As-
periments. semblies, presented at the NASA Goddard Space
Flight Center 16th Space Simulation Conf. Con-
Copyright © A. Deepak Publishing. All rights reserved. JoSS, Vol. 10, No. 1, p. 992Preliminary Thermal Validation Tests for Education-Class CubeSats and Weather-Balloon Payloads
firming Spaceworthiness into the Next Millen- Skrobot, G. L. and Coelho, R. (2012): ELaNa-Educa-
nium, Albuquerque, NM, Nov. 5–8. Paper SEE tional Launch of Nanosatellite Providing Routine
N91-19126 11-18. RideShare Opportunities, presented at the 26th
Guzik, T. G et al. (2008): Development of the High Ann. AIAA/USU Conf. on Small Satellites, Lo-
Altitude Student Platform. Advances in Space Re- gan, UT, Aug. 13–16. Paper SSC12-V-5.
search, Vol. 42, No. 10, pp. 1704–1714. Space Dynamics Laboratory. (2019): Small Satellite
Horan, S., Hull, R., and Alvarez, L. (2012): Using a Testing Capabilities. Available at:
Balloon Flight for End-to-End Testing of a https://www.sdl.usu.edu/downloads/nova-price-
Nanosatellite Mission. J. Small Satellites, Vol. 1, list.pdf (accessed Nov. 27, 2020).
No. 1, pp. 9–18. Swartwout, M. (2018): Reliving 24 Years in the Next
International Organization for Standardization (1975): 12 Minutes: A Statistical and Personal History of
Standard Atmosphere. Geneva, Switzerland: Inter- University-Class Satellites, presented at the 32nd
national Organization for Standardization. Ref. Ann. AIAA/USU Conf. on Small Satellites, Lo-
No. ISO 2533-1975 (E). gan, UT, Aug. 4–9. Paper SSC18-WKVIII-03.
Kimm, H. et al. (2015): Real Time Data Communica- Thomas, D. B. (2008): Nontoxic Antifreeze for Insect
tion Using High Altitude Balloon Based on Cu- Traps. Entomological News, Vol. 119 (4), pp. 361–
besat Payload. J. of Advances Comput. Networks, 365. doi: 10.3157/0013-872X-119.4.361.
Vol. 3, No. 3, pp. 186–190. doi: Tømmer, M. et al. (2015): Testing of Radio Commu-
10.7763/JACN.2015.V3.164. nication Subsystems for the NUTS CubeSat on a
LaSPACE HASP Team and NASA Balloon Program Meteorological Balloon Flight from Andøya in
Office (2020): High Altitude Student Platform: 2014, in Proc. 22nd ESA Symp. on European
Call for Payloads 2021. Available at: Rocket and Balloon Programs and Related Re-
https://laspace.lsu.edu/hasp/Participantinfo.php search, Tromson, Norway, pp. 479–484.
(accessed Dec. 21, 2020) Voss, H. D. et al. (2015): Nano-satellites and HARP
Lee, D. W. and Jensen, C. M. (2000): Dry-Ice Bath for Student Learning and Research, presented at
Based on Ethylene Glycol Mixtures. J. Chemical the 122nd ASEE Ann. Conf. & Exposition, Seattle,
Educ., Vol. 77, No. 5, pp. 629. WA, June 14–17. Paper ID #13398. doi:
NASA CubeSat Launch Initiative (2017): CubeSat 10.18260/p.24518.
101: Basic Concepts and Processes for First-Time Zea, L. et al. (2016): A Methodology for CubeSat Mis-
CubeSat Developers. Available at: sion Selection. J. Small Satellites, Vol. 5, No. 3,
https://www.nasa.gov/content/cubesat-launch-ini- pp. 483–511.
tiative-resources (accessed Aug. 4, 2020).
Peters, B. (2016): Ardusat Space Program: Training
the Next Generation of Satellite Scientists and En-
gineers, presented at the 30th Ann. AIAA/USU
Conf. on Small Satellites, Logan, UT, Aug. 6–11.
Paper SSC16-XIII-5.
Puig-Suari, J., Turner, C., and Ahlgren, W. (2001):
Development of the Standard CubeSat Deployer
and a CubeSat Class PicoSatellite, in IEEE Aerosp.
Conf. Proc., Vol. 1, pp. 347–353. doi:
10.1109/AERO.2001.931726.
Seitzer, P. et al. (2018): Optical Tracking and Attitude
Determination of LEO CubeSats with LEDs: A
Balloon Demonstration, in Proc. 2018 AMOS
Conf., Maui, HI, pp. 1386–1394.
Copyright © A. Deepak Publishing. All rights reserved. JoSS, Vol. 10, No. 1, p. 993You can also read