Design of an experiment for the biomechanical and thermal analysis of athletes during prolonged running exercise
←
→
Page content transcription
If your browser does not render page correctly, please read the page content below
Original Article

Design of an experiment for the biomechanical
and thermal analysis of athletes during prolonged
running exercise
FRANCESCO CRENNA, GIOVANNI TANDA 1
Department of Mechanical, Energy, Management and Transportation Engineering (DIME), University of
Genova, Genova, Italy

 ABSTRACT

Biomechanics and thermoregulation of human running are key aspects playing an important role in the
training of professional athletes. In the case of a prolonged exercise, as occurs during the marathon race,
the intensity and duration of the exercise (in concert with environmental conditions) can affect the
thermoregulatory response and the running mechanics. The aim of this study is the design of a novel
experiment able to simultaneously capture information concerning the biomechanics of lower limbs and the
surface temperature map of the whole body during a prolonged running exercise on treadmill. Kinematics
quantities, such as linear and angular displacement, velocity and acceleration of relevant body markers are
recorded by a video system, while surface temperature evolution on time is detected by an infrared thermal
camera. A group of five amateur athletes, with long experience in long-distance running competitions, was
involved in this study. Results for the sample group, in terms of kinematic (displacements and angles) and
thermal (local and total-body skin temperatures) quantities, revealed features related to individual response
to the effort. Even though the relatively little number of athletes does not permit to infer general conclusions,
the combined mechanical and thermal experiment is deemed to be a useful tool for the investigation of
endurance running characteristics.
Keywords: Biomechanics; Thermoregulation; Treadmill exercise; Distance running.

 Cite this article as:
 Crenna, F., & Tanda, G. (2021). Design of an experiment for the biomechanical and thermal analysis of athletes during prolonged
 running exercise. Journal of Human Sport and Exercise, 16(4), 773-794. https://doi.org/10.14198/jhse.2021.164.04

1
 Corresponding author. Department of Mechanical, Energy, Management and Transportation Engineering (DIME), University of
Genova, via Montallegro 1, I-16145 Genova, Italy.
 E-mail: giovanni.tanda@unige.it
 Submitted for publication February 27, 2020.
 Accepted for publication May 04, 2020.
 Published October 01, 2021 (in press May 15, 2020)
 JOURNAL OF HUMAN SPORT & EXERCISE ISSN 1988-5202
 © Faculty of Education. University of Alicante.
 doi:10.14198/jhse.2021.164.04
 VOLUME 16 | ISSUE 4 | 2021 | 773

Crenna, et al. / Design of an experiment for the biomechanical and thermal analysis JOURNAL OF HUMAN SPORT & EXERCISE

INTRODUCTION

The increasing popularity of running has led to a larger and larger number of recreational runners participating
in long-distance running events like marathons and ultra-marathons. This has motivated a comparable
explosion of research to improve the understanding of the biomechanics of running and to make technical
advances in measurement systems (Novacheck, 1998, Souza, 2016). A basic understanding of the
kinematics of running is helpful to prevent injuries related to overuse phenomena and/or improper training
techniques (Thordarson, 1997). Since biomechanics is fatigue sensitive (Williams et al., 1991, Vercruyssen
et al, 2016), biomechanics degradation during endurance running might lead to an improper kinematics that
increases the occurrence of injuries. For this reason, the investigation of the biomechanical gesture is useful
to understand when its degradation attains a safe limit to properly arrange training session and effort levels.

Running biomechanics has been studied in past years for both sprinters (e.g., Mero et al, 1992) and long
distance running (e.g., Cavanagh, 1987, Millet et al, 2010). Generally speaking, studies on biomechanics can
be classified in three categories on the basis of the respective objectives: (i) training optimization, including
improvements in running biomechanics (e.g., Brown et al., 2014, Tawa et al., 2018), (ii) efficiency and
energetic aspects also related to muscle activities (e.g., Scholz et al., 2008, Tartaruga et al., 2012), (iii)
injuries prevention and/or injuries identification according to specific biomechanical patterns (e.g., Fields et
al.,2010, Murphy et al., 2010). Results are commonly obtained using treadmill running in experimental even
though the differences between treadmill and over ground running may cast doubt on their equivalence as
running surfaces (García-Pérez et al., 2013).

Biomechanical measurement techniques usually require the use of a video system with a set of markers on
the subject (Winter, 2009). More recently, wearable inertial measurements units (IMU) have been used to
measure movement kinematics during normal sport activities, including running (e.g., Howard et al., 2016,
Reenalda et al., 2016). In the present experiment, the continuous measurement of subject motion is a
mandatory issue. Even though wearable IMU sensors fulfil this requirement, their use is discouraged due to
their invasiveness, since they introduce masses strictly tied to segments under investigation. On the other
hand, optical markers are smaller and lighter and require a less invasive application on the subject, so they
could be a more convenient option to gain reliable and not invasive measurement throughout the exercise
(Crenna et al., 2015).

A second important issue to be addressed when the running exercise is prolonged (as occurs during
marathon races) is the severe heat stress induced by high skin and core temperature levels that may result
in collapse related to physical exhaustion, heat exhaustion and dehydration (Kenefick et al., 2007). Core
temperature has a direct relationship with exercise intensity and duration (and it is largely independent of a
wide range of environmental conditions); it is well known that the increased internal temperature during
prolonged exercise limits the ability to continue exercise (González-Alonso et al., 2008). On the contrary, skin
temperature is rather influenced by skin blood flow and environmental conditions, as reported by Lim et al,
(2008). Whereas internal (core) temperature measurements, typically performed by rectal or ingestible
sensors, are invasive and can cause discomfort to runners, modern thermal imaging devices like infrared
thermography (IRT) are particularly suitable to precisely map the cutaneous temperature distribution and its
evolution during exercise. The use of IRT to measure skin temperature in biomedical sciences is documented
in some review papers (e.g., Ring and Ammer, 2012, Lahiri et al., 2012, Fernández-Cuevas et al, 2015).
Application of IRT to the study of skin temperature during running exercise dates back to the pioneering
investigation performed by Clark et al. (1977). They recorded skin temperature distributions and changes in
two athletes standing and running outdoor and on a treadmill. During running, skin temperature distributions

 774 | 2021 | ISSUE 4 | VOLUME 16 © 2021 University of Alicante
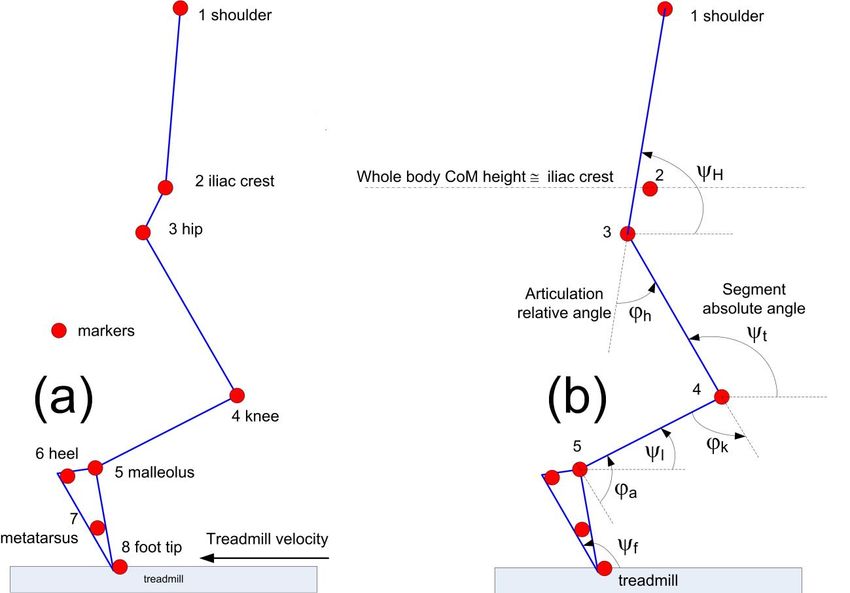
Crenna, et al. / Design of an experiment for the biomechanical and thermal analysis JOURNAL OF HUMAN SPORT & EXERCISE differed markedly from that observed before exercise. More recent thermographic analyses during running exercise reported the skin temperature response to running exercise with graded (incremental) or constant load, with some authors (Roberts et al., 2007) focusing their attention to the upper part of the body (back and front torso), and others investigating the anterior part of the body (Merla et al., 2010) or both anterior and posterior part of the body (de Andrade Fernandes et al., 2016, Tanda, 2016 and 2018). These studies report a general and continuous decrease in skin temperature over the monitored spots during running with graded load or a decrease followed by a quasi-steady or a slight increase during running with constant load. The above mentioned literature studies demonstrated that thermographic imaging is particularly indicated to record the temperature distribution on the skin surface during running exercise. METHODS The aim of this study was to devise an experiment able to capture, during a prolonged running exercise on treadmill, variables related to the kinematics and to the thermoregulation of the subject, without interrupting the exercise. This in order to evaluate the changes in posture, running style, and thermal state during the running effort. The experiment takes advantage of markers of small dimension, fixed to the skin at given locations, whose positions are detected by processing a video file recorded during the exercise, while the rest of the body skin is framed by an infrared thermal camera. From the kinematic point of view, attention is focused on the sagittal plane where markers are properly positioned. On the other hand, thermoregulation inspection is focused on frontal plane from the anterior and posterior directions, so there is no interference between light emitted by the markers (high intensity leds) and the IR emission by the subject. Experiment design The experiment is designed in order to simultaneously gather kinematic and thermal quantities. The kinematic quantities, such as linear and angular displacement, velocity and acceleration of relevant body points and segments are acquired by a video system operating with markers. The positions of points of interest in the sagittal plane can be obtained directly from video, based on a black and white camera and a set of eight markers placed along the right side of the subject in specific anatomical landmarks. Figure 1 shows the position of the markers and the absolute and relative angles deduced from the biomechanical model. Number and position of markers, listed in Table 1, are deemed to be suitable to infer the kinematical quantities of interest and the biomechanical variability of subjects during a prolonged running exercise, as stated by Winter (2009) and Crenna et al. (2018). A black and white camera – DALSA Falcon, 1.4 Mpix, frame rate 100Hz – records the movement of the light emitting markers (diameter 3 mm, intensity 5 mcd) on the subject (at a distance of about 3.5 m) and stores it in an uncompressed video file for processing purposes. Before each test, the video system is properly aligned to obtain an image plane as parallel as possible with the sagittal plane of subject. Calibration is performed before and at the end of the test by using both a chessboard with known dimensions and a 1.2 m linear reference with 100 mm marks, consistent with the procedure provided by Zhang (2000). Before processing the video file, calibration data are processed to verify camera alignment and to obtain the sensitivity factor between the image plane (pixels) and the real sagittal plane (mm). The typical sensitivity is about 1.7 −1.8 mm/pixel. Calibration uncertainty is negligible as compared with other uncertainty sources such as subject movements out of the sagittal plane, as found by Crenna et al. (2015). It is worth noting that a ± 50 mm movement out of the plane implies a deviation in sensitivity, due to perspective effects, of about ± 2%, deemed to be absolutely acceptable in this study; moreover, if such movement is rigid (i.e., the sagittal plane has moved forward or backward with respect to the camera), absolute segment angles and relative articular angles are expected not to vary at all. This scenario is reasonable for this experiment since subject orientation VOLUME 16 | ISSUE 4 | 2021 | 775
Crenna, et al. / Design of an experiment for the biomechanical and thermal analysis JOURNAL OF HUMAN SPORT & EXERCISE

is constrained by equipment position and by treadmill movement, while the subject can afford slight
movements out of the plane by moving nearer to treadmill borders.

Figure 1. (a) Biomechanical model and location of markers; markers are placed on the right side of the
subject, with camera at about 3.5 m distance. (b) Kinematical quantities under investigation; angles are
measured on the basis of marker positions.

Table 1. Marker positions and landmark points.
 Marker Landmark
 1 Shoulder (acromion)
 2 Iliac crest (upper lateral)
 3 Femur (great trochanter)
 4 Knee
 5 Ankle (malleolus)
 6 Heel
 7 Metatarsus (fifth)
 8 Foot tip

Infrared thermography is used as diagnostic tool to obtain detailed maps of temperature in large parts of the
body surface; average skin temperatures of specific regions of interest (arms, trunk, legs) can be easily
derived by an image processing system. Thermal images of subjects during running exercise are taken by
using a digital infrared camera (FLIR T335, Flir Systems Inc., 320×240 pixels, thermal sensitivity/NETD <
0.05°C). The accuracy of infrared temperature measurements is assessed by a calibration test described by
 776 | 2021 | ISSUE 4 | VOLUME 16 © 2021 University of Alicante

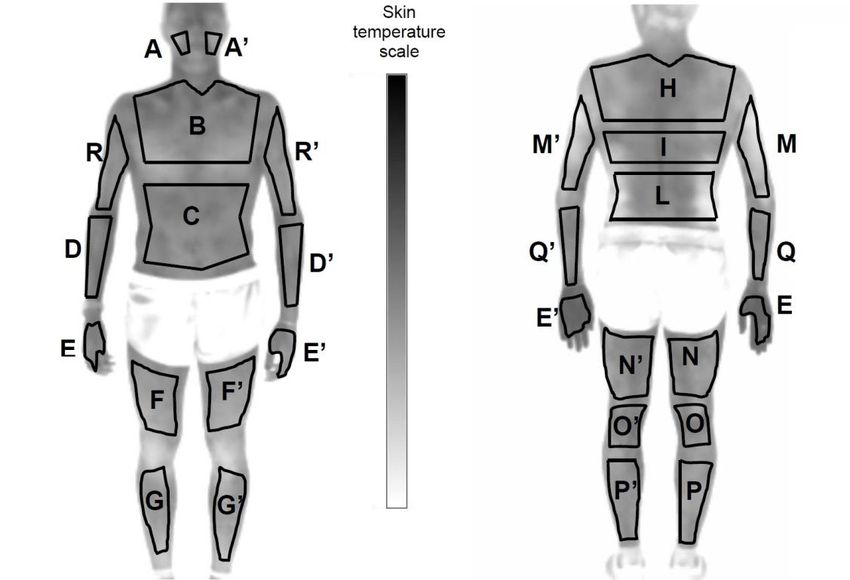
Crenna, et al. / Design of an experiment for the biomechanical and thermal analysis JOURNAL OF HUMAN SPORT & EXERCISE Tanda (2016). Sequences of thermal images of anterior and posterior body are taken at given time intervals without interrupting the physical activity and at a distance of about 3 m from the subject in order to gather a full image of the body. Data processing Kinematic quantities At regular intervals during the test (typically 5 minutes), as synchronized as possible with thermal measurements, a 5 s long video recording is acquired. The file is then processed offline, frame by frame, to obtain marker positions in time. Non-integer values (below pixel resolution) can be obtained considering the grey level of the white dots representing the markers on the image. Marker positions are properly tracked to obtain their movement overtime and video system sensitivity is used to obtain their positions on the sagittal plane. From marker positions, segments absolute angles and relative articular angles are obtained as shown in Figure 1(b). Moreover, the iliac crest marker (Number 2 in Figure 1), can be assumed as the approximated position of the Centre of Mass (COM) of the subject, as indicated by Winter (2009). Once 5- seconds of kinematic data had been recorded, the representative gait cycle of the subject was extracted. The gait cycle was defined by the time interval from touchdown of the right foot to the successive touchdown of the same foot. Comparison of kinematics among different subjects running at different speeds or for the same subject at different time instants of the exercise were performed on the basis of the representative gait cycle. Figure 2 shows some representative examples of data collected for a single gait cycle. In particular, the typical trajectories of markers, together with the rigid segment model representing the subject body till the height of shoulders, is illustrated in Figure 2(a), while Figure 2(b) shows the metatarsus trajectory (most distal and fastest moving segment in the model) of the same subject, averaged among a set of cycles during the treadmill exercise, together with the standard of the mean. Information provided by Figure 2(b) is important since it points out the repeatability of each gait cycle at a specific exercise time, and/or the gait differences between subjects or at different exercise times. Since a large amount of biomechanical measurement data are gathered for each subject (eight anatomical landmark positions, four absolute segment angles , for foot, leg, thigh, and torso, plus three articular angles , for ankle, knee, and hip, measured for about 7−10 gait cycles, about every 5 minutes of exercise, leading to about 200 cycles to analyse for a 100 min exercise) a synthetic approach is required to illustrate the most important features of kinematics during exercise. A key variable adopted to characterize the subject kinematics is the Range of Motion (ROM), defined as the difference between the maximum and minimum values reached, during a single cycle, by a specific parameter. Thermal quantities In principle, the true skin temperature of total body can be obtained by recording the skin temperature over an infinite number of measuring site. For practical reasons, the mean skin temperature of the total body is typically estimated on the basis of a finite number of local (or regionally averaged) skin temperatures and the corresponding weighting factors. According to previous works (Tanda, 2016 and 2018), with reference to the sketch of the athlete body shown in Figure 3, the total-body surface temperature has been estimated as the arithmetic mean of the following fourteen regionally-averaged surface temperatures: cheek (A−A’), chest (B), abdomen (C), anterior forearm (D−D’), hand (E−E’), anterior thigh (F−F’), anterior calf (G−G’), scapula (H), subscapula (I), lumbar (L), posterior upper arm (M−M’), posteromedial thigh (N−N’), posterolower thigh (O−O’), posterior calf (P−P’). The double symbol (for instance A−A’) indicates that the mean between right and left side of the same anatomical region has been considered. Each region of interest (ROI) associated with a specific site of body surface was selected by drawing its anatomical contour with a dedicated software VOLUME 16 | ISSUE 4 | 2021 | 777
Crenna, et al. / Design of an experiment for the biomechanical and thermal analysis JOURNAL OF HUMAN SPORT & EXERCISE

program (Flir Reporter Professional©, Flir Systems); details about the ROI selection and its locally-averaged
skin temperature are reported by Tanda (2018). In addition to the total-body skin temperature, additional
regional skin temperatures (i.e., over upper limbs, lower limbs, chest, back) can be deduced from values
recorded over the regions highlighted in Figure 3.

Figure 2. (a) Marker trajectories during a standard cycle. (b) Metatarsus trajectory averaged among a set of
8 cycles. Solid line: mean value, dashed lines: ± σ of the mean.

 Figure 3. Sketch of regions of interest (ROI) where regional skin temperatures have been estimated.

 778 | 2021 | ISSUE 4 | VOLUME 16 © 2021 University of Alicante
Crenna, et al. / Design of an experiment for the biomechanical and thermal analysis JOURNAL OF HUMAN SPORT & EXERCISE

Case study
A group composed of five amateur athletes (n = 5), including one of the authors, was involved in this study.
Anthropometric characteristics of the subjects are listed in Table 2; all of them, having long experience in
long-distance (half-marathon, marathon) running competitions, were informed about the procedures of the
investigation and gave their consent to participate in this research. The subjects were asked to run on
treadmill, at a velocity typically close to that maintained in the most recent competitive half-marathon, for a
duration as long as possible, depending on the subject willing. Experiments were conducted in a relatively
warm and humid indoor environment (air temperature 23−27°C, air relative humidity 60−70%), without forced
ventilation of indoor air and with the treadmill set at zero inclination. According to the scale of apparent
temperature reported by Steadman (1979), the perceived temperature Tapp obtained by the combination of
indoor air temperature and relative humidity was 23−24°C for two athletes, 25°C for one athlete and 27−28°C
for two athletes (who ran in a rather uncomfortable environment). During tests, the subjects wore only shorts
and running shoes. Each experiment was conducted at the same time of day (late morning) to avoid variation
due to circadian rhythm of body temperature.

Table 2. Anthropometric characteristics of subjects and main exercise parameters.
 Age Height Weight BMI Colour in Speed Intensity of Tapp
 Subject Test
 (years) (m) (kg) (kg/m2) the plots (km/h) exercise (%) (°C)
 1a white 10.2 75 23
 1 58 1.73 59 19.7 1b grey 12.0 90 24
 1c black 12.9 95 23
 2 52 1.77 64 20.4 2 blue 14.0 95 25
 3 47 1.83 75 22.4 3 orange 12.0 95 23
 4 46 1.74 61 20.1 4 magenta 14.0 90 28
 5 35 1.75 71 23.2 5 green 14.0 95 28

The treadmill running exercise was preceded by a 10 minute acclimatization period, where the participants
stood motionless. At the end of acclimatization, thermal images of the front and the back of the body were
taken. The running exercise started with a first 5 minute warm-up period at the reduced treadmill velocity of
6 km/h. Immediately after the warm-up, the treadmill velocity was incremented up to the value scheduled for
each subject and maintained for the whole duration of exercise. Table 2 reports also the main test
characteristics: velocity, intensity of exercise and the apparent temperature of indoor air. The running velocity
set for each subject varied from 10.2 to 14 km/h. The intensity of the exercise was assumed as the ratio
between the velocity imposed during the exercise and the race velocity maintained in the most recent half-
marathon competition. This value typically corresponded to 90-95% for all the subjects, with the exception of
one subject (Number 1) who repeated the exercise at three different velocities, corresponding to 75%, 90%
and 95% of his competitive race velocity (test 1a, 1b, and 1c, respectively). Subjects were asked to run at
the prescribed velocity as much as possible; typical duration of exercise was in the 1h – 1h,45 min range. A
sequence of 3−4 thermal images (within few seconds) of anterior and posterior body was typically acquired
every 5 minutes throughout each exercise without interrupting the physical activity. The first image of each
series has been typically employed to identify each region of interest. The remaining images of the series
were used only in case of lack of information or image defects (i.e., blurred image) on a specific body region
due to the subject movement and in order to randomly assess the repeatability of skin temperature
measurement over the same surface region (typically 0.1°C and always confined within 0.3°C). During the
exercise, synchronized with thermal images, the vision measurement system recorded a five seconds video
for further offline processing. After the completion of each exercise, subjects stood motionless for a further

 VOLUME 16 | ISSUE 4 | 2021 | 779
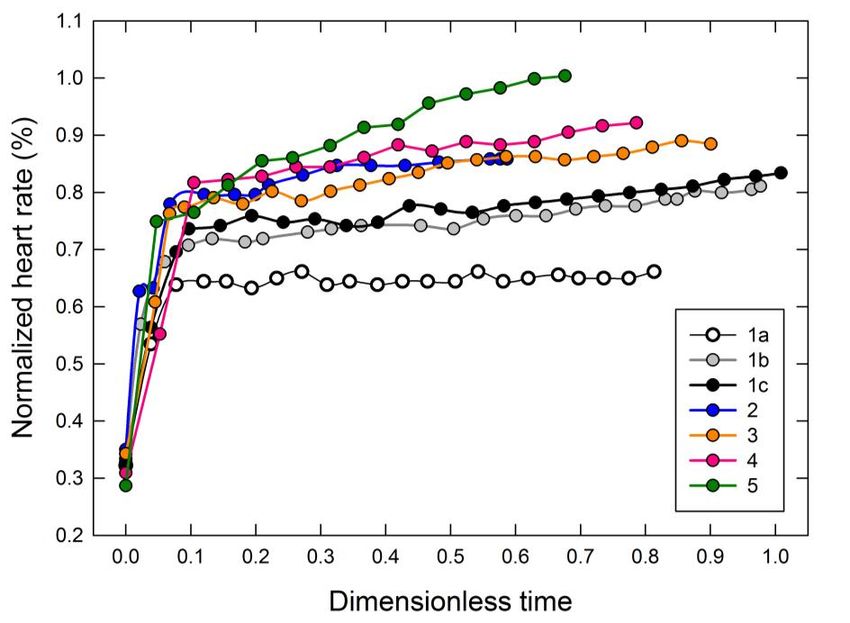
Crenna, et al. / Design of an experiment for the biomechanical and thermal analysis JOURNAL OF HUMAN SPORT & EXERCISE

5−10 minute rest period, during this period other thermal images of the body were taken. During the
experiments, the heart rate of subjects was continuously monitored by means of a standard ECG device.

RESULTS

In order to provide a full non-dimensional representation of results, a dimensionless time τ was further
introduced and defined as follows:

 τ = t / trace
where t is the actual time and trace is the time required to complete a half-marathon race (21.097 km) at the
velocity sustained during the exercise. The 5-min warm-up period was included in the estimation of trace.
Since the exercise velocity was different from one subject to the others, the time resulted to be scaled
according to a conventional duration related to the intensity of the exercise.

 Figure 4. Normalized heart rate during the exercise.

Figure 4 shows the heart rate recorded for each subject during the running exercise, normalized by the
maximal age-predicted value (estimated according to the formula reported by Nes et al., 2013). Even though
no measurements of maximal oxygen uptake were performed, variation of heat rate during the running
exercise is believed to be correlated with exercise intensity and to be considered as a rough measure of the
physical effort sustained by the subjects during exercise (Karvonen and Vuorimaa, 1988).

Biomechanical measurements
As previously discussed, biomechanical analysis is based on a standardized gait cycle, in which time histories
and/or synthetic parameters of several biomechanical quantities are considered and analysed. First, attention
is focused onto the trajectories of markers in the sagittal plane during a cycle. Among the anatomical regions
monitored by markers, the foot movement is described by four markers (malleolus, heel, metatarsus and foot
 780 | 2021 | ISSUE 4 | VOLUME 16 © 2021 University of Alicante

Crenna, et al. / Design of an experiment for the biomechanical and thermal analysis JOURNAL OF HUMAN SPORT & EXERCISE

tip). The iliac crest marker is deemed to provide useful information about subject vertical oscillation in a gait
cycle, due to the fact that the whole body centre of mass (COM) position for a standing subject can be
assumed at the height of the iliac crest. Second, attention is turned to articular or relative angles in the sagittal
plane. The biomechanical model here considered includes three main articulations (hip, knee and ankle),
their angles are computed considering the absolute angles of the articulated segments. For example, with
reference to the knee, = − . Since zero value corresponds to the standing anatomical position
(i.e., thigh aligned to the leg), positive knee angle values indicate a knee flexion; knee extension is strictly
limited and only a few negative degrees are possible. With reference to the ankle, the relative angle definition
requires an offset to obtain zero at standing, so = − − 90°. In this case, a foot dorsal flexion is
a positive angle while a plantar flexion is negative. Trajectories and angles described by markers are typically
considered during an overall gait cycle or at a specific time instant such as when the foot is landing.

Muscular actions of legs produce the movement of foot, which is the body final actuator on the ground and
the most distal body segment. The trajectories of the metatarsus marker in the sagittal plane for two subjects
(Number 1, test 1c and Number 4) and two different values of the dimensionless time are shown in Figure 5.

Since foot trajectory is associated with legs kinematics, it is also of interest to investigate the angles
generating the movement. Figures 6(a), 6(b) and 6(c) show the knee angle for subject Number 1, test c,
Number 3 and Number 4, respectively, taken at different dimensionless time values.

Figure 5. Mean metatarsus trajectory for subjects Number 1, test 1c (black colour) and Number 4 (magenta
colour), at dimensionless time τ = 0.2 (dotted line) and 0.8 (bold line). Dashed lines represent ± σ of the
mean for τ = 0.8.

 VOLUME 16 | ISSUE 4 | 2021 | 781

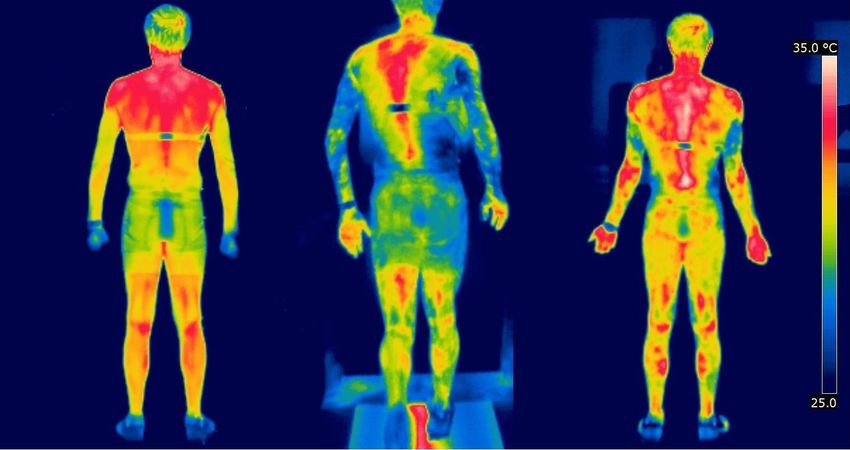
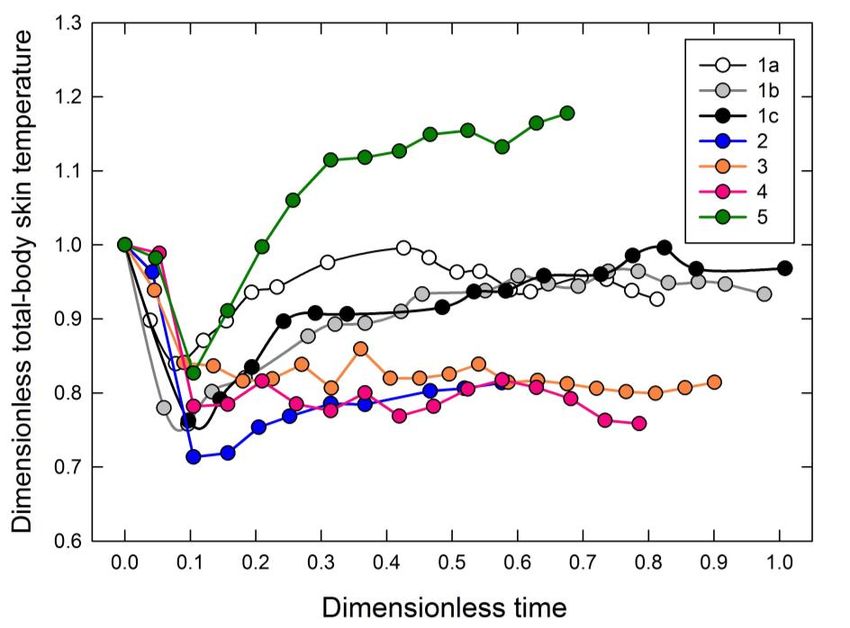
Crenna, et al. / Design of an experiment for the biomechanical and thermal analysis JOURNAL OF HUMAN SPORT & EXERCISE Figure 6. Mean knee angle , during a standard cycle. (a) Subject Number 1, test 1c. (b) Subject Number 3. (c) Subject Number 4. Bars indicate ± of the mean. Figure 7. ROM during exercise time for the five subjects. (a) Mean ankle angle, . (b) Mean knee angle, . Bars indicate ± of the mean. Colours indicate different subjects according to colour code reported in Table 2. Figure 7 shows the mean ROM for the ankle angle, and for the knee angle , during the exercise, for all the five subjects, each of them identified by a different colour. As an intuitive indication of fatigue, Figure 8 reports the vertical motion of the COM of the body, deduced from the iliac crest marker, for the same subjects and dimensionless time values considered in previous Figure 5 (subjects Number 1, test 1c and Number 4, τ = 0.2 and 0.8). The vertical displacement of COM during a cycle can also be efficiently described by its ROM as presented in Figure 9. A further interesting feature of kinematics is represented by the ankle and knee angles taken at the initial foot contact with the ground; mean angles for all the subjects, at different dimensionless time values, are shown in Figure 10. Thermal measurements Typical thermal images taken for one of the athletes are reported in Figure 11. They refer to the posterior part of the body before, during and immediately after the running exercise. The figure clearly shows the effect of running exercise on skin temperature distribution, resulting in large disuniformities depending on the specific body compartment. Blood perfusion associated with blood redistribution under skin is visible in the image taken at the end of exercise. In order to provide a compact representation of thermal results, the total- body skin temperature Tsk, evaluated according to the procedure previously described, has been normalized by using the initial skin temperature Tsk,0 and the indoor air temperature Tair as follows: 782 | 2021 | ISSUE 4 | VOLUME 16 © 2021 University of Alicante
Crenna, et al. / Design of an experiment for the biomechanical and thermal analysis JOURNAL OF HUMAN SPORT & EXERCISE ϑ = (Tsk – Tair) / (Tsk,0 – Tair) Figure 8. Mean COM vertical movements for subject Number 1, test 1c (black colour) and Number 4 (magenta colour) at τ = 0.2 (dotted) and 0.8 (bold). Figure 9. ROM of mean COM vertical displacement during the exercise. Bars indicate ± of the mean. Colours indicate different subjects according to colour code reported in Table 2. VOLUME 16 | ISSUE 4 | 2021 | 783
Crenna, et al. / Design of an experiment for the biomechanical and thermal analysis JOURNAL OF HUMAN SPORT & EXERCISE Figure 10. (a) Mean ankle angle, , (b) mean knee angle, , at the initial foot contact with the ground during the exercise, for the five subjects considered. Bars indicate ± of the mean. Colours indicate different subjects according to colour code reported in Table 2. Figure 12 shows the time-evolution of dimensionless skin temperature for all subjects, while local thermal response to exercise is reported in Figures 13−15. Three distinct regional skin compartments were chosen: lower limbs, upper limbs, and lower back. The lower-limb skin temperature, evaluated as the average among values measured on anterior and posterior calves and thighs (indicated as F−F’, N−N’, G−G’ and P−P’ in Figure 3), corresponds to the anatomical region closer to active muscles during exercise, where blood is directed especially at the beginning of the effort. The skin temperature over the upper limbs (average between values detected on anterior and posterior arms and forearms, indicated as R−R’, M−M’, D−D’ and Q−Q’ in Figure 3) indicates the response to exercise of the peripheral body compartment. Finally, the lower back (lumbar) region (indicated as L in Figure 3) was chosen since one of the most involved in the sweating process to facilitate heat losses to the environment, as found by Smith and Havenith (2011). Due to the adopted normalization of time and temperature, dimensionless local skin temperatures of the subjects generally start from values different from one (an initial value lower than one denotes an initial local skin temperature lower than the initial total-body skin temperature and vice versa). DISCUSSION As shown in Figure 4, normalized heat rate typically has a quick rise during the first part of exercise (including warm-up). The lower normalized heart rate was maintained by subject Number1 during his most comfortable exercise (test 1a); subjects running at a velocity close (90−95%) to their competitive race velocity attain, at the end of exercise, a normalized heart rate between 80 and 100%. The highest normalized heart rates were recorded for subjects (Number 4 and Number 5) running in a relatively uncomfortable environment (with the highest indoor apparent temperature). The range of variation of heart rate among the subjects seems to be related to the exercise intensity and in part also to the perceived temperature of indoor air. For one subject (Number 5) the high apparent temperature of indoor air (28°C) combined with the high intensity (95%) of exercise led to a significant rise of heart rate that reached the maximal age-predicted value, thus determining the prompt stoppage of exercise. The main feature of the present experiment is the data gathering throughout the exercise, without any interruption of the effort and thus of the monitoring of biomechanical and thermal parameters during their evolution in time, whereas most of similar literature papers refer to parameters collected before and after the 784 | 2021 | ISSUE 4 | VOLUME 16 © 2021 University of Alicante
Crenna, et al. / Design of an experiment for the biomechanical and thermal analysis JOURNAL OF HUMAN SPORT & EXERCISE

exercise. Results show some examples of biomechanical measurements performed in the present
experiment. Figure 5 shows metatarsus trajectory, during a gait cycle, for two subjects with evident
differences in running style and consequently in movement strategies. It is worth noting that, in treadmill
running, when the metatarsus is on the ‘ground’, it stands on the treadmill, and it moves with respect to the
point of view of the camera toward left at the speed imposed on the treadmill. Inspection of the figure shows
that, during a cycle, subject Number 4 moves his metatarsus upward of about 400 mm while subject Number
1 makes a vertical movement of about a quarter. This effect is deemed to be correlated with subjective
running style and, at a larger extent, with subject running speed, the wider movement being recorded for
faster subject. Of course, different trajectories correspond to different kinematic strategies. Comparison of
trajectories measured at different τ values shows very little differences for both subjects, particularly related
to trajectory length more than to vertical movement. Such small variations seems to be compatible with
subject’s repeatability indicated with dashed lines. It is worth noting that, at the authors’ knowledge, no studies
focused onto the foot trajectory during running exercise are available in literature, where angle analysis is
typically performed (e.g., Koblbauer et al., 2014, Tian et al., 2020).

Figure 11. Skin temperature over the posterior part of the body measured before, during and immediately
after the completion of exercise, subject Number 2.

Attention is now turned to angular strategies. Figure 6 shows the knee angle ( in Figure 1(b) ) for three
subjects at different τ values during the session. Subject Number 1 (test 1c) and Number 4 present very
similar traces of the knee angle, with only little deviations from τ ranging from 0.1 to 1.0, denoting a very
repeatable knee biomechanics constant during the entire exercise. This result is consistent with those
available in the literature for fatigue-inducing running exercises (e.g., Koblbauer et al., 2014, Tian et al.,
2020), irrespective of the different exercise protocol. A detailed analysis performed for subject Number 3 and
limited to the early stage of exercise (τ ≤ 0.30) shows that as the subject increases his speed from the warm-
up (τ ≈ 0.05) to the prescribed treadmill velocity (τ > 0.10) the biomechanics changes, even if the behaviour
within the cycle is similar. The swing /suspension phases in the cycle present a wider knee flexion due to a

 VOLUME 16 | ISSUE 4 | 2021 | 785
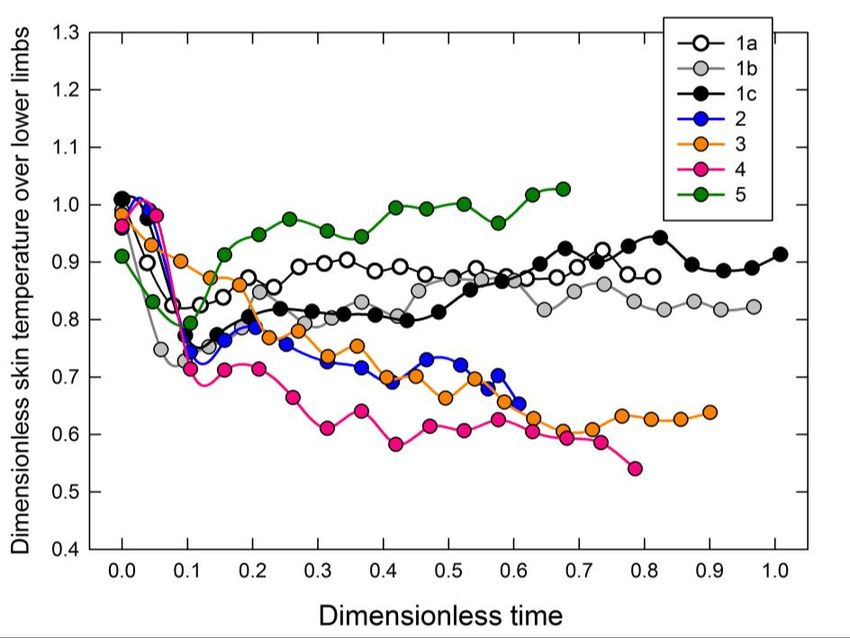
Crenna, et al. / Design of an experiment for the biomechanical and thermal analysis JOURNAL OF HUMAN SPORT & EXERCISE

longer duration of these phases since speed is higher than in the warm-up. A similar behaviour was noticed
for the other subjects.

 Figure 12. Dimensionless total-body skin temperature during exercise.

 Figure 13. Dimensionless skin temperature over lower limbs during exercise.

 786 | 2021 | ISSUE 4 | VOLUME 16 © 2021 University of Alicante
Crenna, et al. / Design of an experiment for the biomechanical and thermal analysis JOURNAL OF HUMAN SPORT & EXERCISE

 Figure 14. Dimensionless skin temperature over upper limbs during exercise.

 Figure 15. Dimensionless skin temperature over lower back during exercise.

Figure 7 shows the ROM of the ankle and knee angles versus the dimensionless time for all the five subjects.
Neglecting data collected at the starting of exercise (warm-up), the ROM of ankle and knee angle are affected
by intra-subject variability, with a random behaviour during the test, except for subjects Number 1 and
Number 2, which present a slight increase in ankle ROM and a corresponding slight decrease in knee ROM.

 VOLUME 16 | ISSUE 4 | 2021 | 787
Crenna, et al. / Design of an experiment for the biomechanical and thermal analysis JOURNAL OF HUMAN SPORT & EXERCISE

It can be argued that the effect of fatigue is not clearly related to the ROM of the ankle and knee angles, with
some authors stating that there is no substantial fatigue effect (e.g., Brown et al, 2014), and others claiming
that either an increase (e.g., Chan-Roper et al., 2012) or a decrease (e.g., Mizrahi et al., 2010, Tian et al.,
2020) in knee angle ROM occurs over time. The fatigue protocol and the measurement method adopted (with
measurements taken during or after the fatigue test) deeply affect the results in the opinion of the authors of
the present research. In the present case, measurements gathered during the test, without any interruption,
permit to closely investigate what happens during a long distance run.

Efficient running requires a rather stable behaviour of body COM height during the gait cycle, since vertical
movements are energy dispersive. Thus, the observation of vertical movement of the subject during the
exercise is of great importance (Möhler et al., 2019). Figure 8 shows the COM vertical movements for two
subjects at τ = 0.2 and 0.8 during a cycle. Apart from the offset deviation it is difficult to appreciate different
behaviours during the exercise; therefore, an analysis based on the ROM of COM height for all the subjects,
as shown in Figure 9, is more effective. The graph is noisy due to the differences in motion strategies of
subjects; nevertheless, it seems to be featured by a decreasing trend as the exercise time increases as a
consequence of changes in running pattern over time throughout the prolonged exercise. This is confirmed
by Morin et al. (2011), who examined the stance phase alone and with investigation before and a few hours
after an endurance performance.

Figure 10 presents knee and ankle angles measured at the initial contact with the treadmill within a
representative gait cycle. Even if in presence of inter and intra subject variability, a systematic behaviour with
exercise time is observed for subjects Number 1 and Number 2. The former presents a knee angle slightly
increasing over time and an ankle angle slightly decreasing while the opposite happens for the latter, denoting
a compensation strategy between ankle and knee throughout the exercise. Results similar to those for subject
Number 1, but obtained with a faster and much shorter exercise, are reported by Derrick et al. (2002). The
above mentioned effect suggests a possible subjective biomechanical response to fatigue according to
different adaptation strategies.

The total-body skin temperature, plotted in Figure 12, exhibits a marked decrease even during the short
warm-up period (typically τ from 0 to 0.05) preceding the exercise. For some subjects (Number 1, Number 2,
and Number 3) the skin temperature decrease continues up to a dimensionless time equal to 0.1−0.2, after
that a progressive increase up to the exercise completion is observed. When subject Number 1 ran at the
lowest intensity (test 1a), the skin temperature decrease, with respect to the exercise starting, is lower than
that recorded when running at a higher intensity (tests 1b and 1c). Moreover, the pre-running value for the
75% intensity exercise (test 1a) is approached earlier than 90 and 95% intensity exercise (tests 1b and 1c),
probably due to a not excessive demand for blood from active muscles during the relatively mild exercise
(even though a successive skin temperature decrease in the second half of the exercise is noticed). The
temperature distributions for subjects Number 4 and Number 5 reveal completely different features as
compared each with the other and both with the common trend exhibited by subjects Number 1, Number 2,
and Number 3. Subjects Number 4 and Number 5 run at a very uncomfortable apparent temperature (28°C),
markedly higher than those occurring for the rest of the sample group, and at similar intensity (90−95% of
competitive race velocity) but while the skin temperature of subject Number 4 is characterized by a continuous
decrease throughout the exercise, subject Number 5 experimented a first decrease of skin temperature
followed by a prompt rise up to values well in excess of that recorded prior the exercise. This completely
different response of thermal regulation of these two subjects running under the same environmental
conditions is probably to be ascribed to individual physiological characteristics. Obviously, the limited number

 788 | 2021 | ISSUE 4 | VOLUME 16 © 2021 University of Alicante
Crenna, et al. / Design of an experiment for the biomechanical and thermal analysis JOURNAL OF HUMAN SPORT & EXERCISE

of athletes involved in the study and performed tests does not permit a generalization or a deeper
interpretation of results.

For the purpose of comparison with literature, the time evolution of total-body skin temperature, averaged
among all the subjects (5 subjects, 7 tests) within the first 30 minutes of exercise has been plotted in Figure16,
together with total-body skin temperature distributions for different sample groups (12 subjects: de Andrade
Fernandes et al., 2016, and 4 subjects: Tanda, 2018), performing the same type of running exercise (treadmill
at constant load). Skin temperatures were obtained by infrared thermography measurements, with total-body
values calculated by means of slightly different formulas. Despite the non-homogeneity of the three groups,
running at medium-high intensity in the present research, at low intensity (de Andrade Fernandes et al., 2016)
and at constant velocity (Tanda, 2018), when data are averaged among a significant number of subjects they
denote a common trend, characterized by a marked reduction of skin temperature immediately after the onset
of exercise, followed by a little increase after 10-15 mins of exercise. The three temperature distributions
plotted in the figure are shifted along the temperature axis mainly due to the different environmental
conditions imposed during the experiments (apparent temperature of 25°C in de Andrade Fernandes et al.
(2016) , 22°C in Tanda (2018) and 23−28°C in the present study). Individual data for four subjects (out of
five) of the present sample group (not reported for the sake of brevity) showed exactly the same trend as the
subject-averaged temperature distribution, with initial skin temperature starting from different values
depending on the ambient temperature. The only exception was subject Number 5, who run at relatively high
intensity and high perceived ambient temperature and thus in uncomfortable conditions, as previously
discussed. Therefore, for the majority of subjects, individual distributions of total-body skin temperature have
a common shape in the first part of exercise but tend to diverge as the exercise progresses over time,
probably reflecting an individual response to the exercise as it becomes longer and more demanding.

Skin temperatures averaged over the active muscles involved in the running exercise (lower limbs), shown
in Figure 13 in dimensionless form, are characterized by a common reduction (as the total-body values) at
the beginning of exercise. As the exercise progresses, subject Number 1 exhibits, for all the three exercise
intensities, a skin temperature increase over legs, probably due to thermal conduction from muscles under
skin or to partial redirection of cutaneous blood flow, while for subjects Number 2, Number 3, and Number 4
the vasoconstrictor stimulus seems to be maintained for a longer time since the local skin temperature
continues to decrease with time. For subject Number 5, the marked skin temperature increase is associated
with thermoregulatory vasodilation.

Upper limbs and lower back are regional compartments that are inactive form the running point of view and
over skin temperature is expected to be markedly reduced at the beginning of exercise, as inspections of
Figures 14 and 15 confirm. For the majority of subjects (Numbers 1−4), the skin temperature over upper
limbs, after the initial descending trend, is maintained stable (or slightly increased) and well below the starting
value, probably indicating a poor redistribution of blood flow towards this region throughout the exercise. The
time-distributions of skin temperature over the lumbar region, where the sweating rate is expected to be
significant (as reported by Smith and Havenith, 2011), reflect the thermoregulatory response of each subject:
the redirection of blood flow toward this skin region to facilitate heat loss to the environment seems to be
evident for subject Number 1 (regardless of the intensity of the exercise), while for subjects Numbers 2−4 the
ascending trend of local skin temperature, after the initial decrease, appear to be more gradual, with values
always lower than the initial value. Inspection of skin temperature distributions over upper limbs and lower
back for subject Number 5 reveals that the excess heat accumulated during the exercise is delivered to the
environment through both upper limbs and lower back, thus signalling an urgent requirement of body
thermoregulation.

 VOLUME 16 | ISSUE 4 | 2021 | 789
Crenna, et al. / Design of an experiment for the biomechanical and thermal analysis JOURNAL OF HUMAN SPORT & EXERCISE

Figure 16. Total-body skin temperature, averaged among groups of subjects, in the early stage of exercise.
Comparison with the literature.

A feature brought by the present study is the possible correlation between thermal data and biomechanical
parameters. Even if a correlation between biomechanical and thermal parameters has to be investigated on
the basis of a larger number of tests and athletes, a clear association between them is noticed by comparing
the evolution in time of skin temperature over legs (Figure 13) and knee angle at landing plotted in
Figure10(a); ascending or descending trends of skin temperature over legs during exercise show a similarity
to the time-evolution of knee angle at landing, with some subjects showing a reduction of both quantities
(e.g., Number 4), others showing an initial decrease followed by an increase of both quantities (e.g., Number
5); and others showing quasi-constant distributions over time (e.g., Number 1). This outcome suggests that
the thermoregulatory response of lower limbs could be reflected in the dynamics of the gesture at landing.
Conversely, no evidence of a clear association between distributions over time of total-body skin temperature
and the other biomechanics variables detected in this study was found. Nonetheless the effect of fatigue
seems to be more promptly identified by the thermal analysis rather than the biomechanics variables here
considered, within the limitation of the small sample group investigated.

CONCLUSIONS

This study is aimed at presenting an experiment able to simultaneously gather data concerning the
biomechanics and thermoregulation of athletes during a prolonged running exercise on treadmill. Despite the
limitation due to the reduced sample group considered in the case study, experimental data show that thermal
analysis is likely more sensitive to subject fatigue and effort during the prolonged exercise here considered,
while, from the biomechanical point of view, it is more difficult to obtain a clear indication with the data
available, except for the vertical motion of COM.

 790 | 2021 | ISSUE 4 | VOLUME 16 © 2021 University of Alicante
Crenna, et al. / Design of an experiment for the biomechanical and thermal analysis JOURNAL OF HUMAN SPORT & EXERCISE

An interesting correlation between biomechanics and thermal measurement was found as the time evolution
over time of skin temperature over legs and knee angles at landing are compared: an increase of skin
temperature over legs seems to be reflected in a corresponding increase in knee angle at landing and vice
versa.

Finally, a more detailed characterization could be achieved by reducing the measurement time interval (now
around 5 minutes) or even by obtaining a continuous measurement through a long video recording to be
processed offline. The large amount of data available could be further analysed, introducing for example a
subject normalization in order to compare only variations due to the exercise, and not the values typical of
each subject’s running style.

AUTHOR CONTRIBUTIONS

The contribution of authors to this research was equal. Both authors conducted the experiments on subjects;
Prof. Crenna was mainly involved in the processing of biomechanical data, while Prof. Tanda was mainly
involved in the processing of thermal data.

SUPPORTING AGENCIES

No funding agencies were reported by the authors.

DISCLOSURE STATEMENT

Authors confirm that they do not have any conflict of interest in connection to this study.

ACKNOWLEDGEMENTS

Authors are grateful to Gabriele Bonuomo, Antonio Cimino, Alessandro Iannone and Roberto Parodi for their
availability to be subjects for this investigation.

REFERENCES

 Brown, A. M., Zifchock, R. A., & Hillstrom, H. J. (2014). The effects of limb dominance and fatigue on
 running biomechanics. Gait Posture. 39, 915-9. https://doi.org/10.1016/j.gaitpost.2013.12.007
 Cavanagh, P. R. (1987). The biomechanics of lower extremity action in distance running. Foot Ankle Int.
 7, 197-217. https://doi.org/10.1177/107110078700700402
 Chan-Roper, M., Hunter, I., Myrer, J. W., Eggett, D. L., & Seeley, M. K. (2012). Kinematic changes during
 a marathon for fast and slow runners. J. Sports Sci. Med. 11, 77–82.
 Clark, R. P., Mullan, B. J., & Pugh, L. G. C. E. (1977). Skin temperature during running - A study using
 infra-red colour thermography. J. Physiol. 267, 53-62.
 https://doi.org/10.1113/jphysiol.1977.sp011800
 Crenna, F., Rossi, G. B., & Palazzo, A. (2015). Measurement of human movement under metrological
 controlled conditions. Acta IMEKO. 4, 48-56. https://dx.doi.org/10.21014/acta_imeko.v4i4.281
 Crenna, F., Rossi, G. B., & Palazzo, A. (2018). Ankle moment measurement in biomechanics. J. Phys.:
 Conf. Ser. 1065, 182005.

 VOLUME 16 | ISSUE 4 | 2021 | 791
Crenna, et al. / Design of an experiment for the biomechanical and thermal analysis JOURNAL OF HUMAN SPORT & EXERCISE

 de Andrade Fernandes, A., dos Santos Amorim, P. R., Brito, C. J., Sillero-Quintana, M., & Marins, J. C.
 B. (2016). Regional skin temperature response to moderate aerobic exercise measured by infrared
 thermography. Asian J. Sports Med. 7, e29243.
 Derrick, T. R, Dereu, D. & McLean, S. P. (2002). Impacts and kinematic adjustments during an exhaustive
 run. Med. Sci. Sport Exerc. 34, 998-1002. https://doi.org/10.1097/00005768-200206000-00015
 Fernández-Cuevas, I., Marins, J. C. B., Lastras, J. A., Carmona, P. M. G., Cano, S. P., García-
 Concepción, M. A., & Sillero-Quintana, M. (2015). Classification of factors influencing the use of
 infrared thermography in humans: A review. Infrared Phys. Technol. 71, 28−55.
 https://doi.org/10.1016/j.infrared.2015.02.007
 Fields, K. B., Sykes, J. C., Walker, K. M., & Jackson, J. C. (2010). Prevention of running injuries. Current
 Sports Medicine Reports. 9, 176-82. https://doi: 10.1249/JSR.0b013e3181de7ec5
 García-Pérez, J. A., Pérez-Soriano, P., Llana, S., Martínez-Nova, A. & Sánchez-Zuriaga, D. (2013).
 Effect of overground vs treadmill running on plantar pressure: Influence of fatigue. Gait Posture. 38,
 923-33. https://doi.org/10.1016/j.gaitpost.2013.04.026
 González-Alonso, J., Crandall, C. G., & Johnson, J. M. (2008). The cardiovascular challenge of
 exercising in the heat. J Physiol. 586, 45–53. https://doi.org/10.1113/jphysiol.2007.142158
 Howard, R. M., Conway, R., & Harrison, A. J. (2016). A survey of sensor devices: use in sports
 biomechanics. Sports Biomech. 15, 450-61. https://doi.org/10.1080/14763141.2016.1174289
 Karvonen, J. & Vuorimaa, T. (1988). Heart rate and exercise intensity during sports activities. Sports
 Med. 5, 303–11. https://doi.org/10.2165/00007256-198805050-00002
 Kenefick, R. W., Cheuvront, S. N., & Sawka, M. N. (2007). Thermoregulatory function during the
 marathon. Sports Med. 37, 312-15. https://doi.org/10.2165/00007256-200737040-00010
 Koblbauer, I. F., van Schooten, K. S., Verhagen, E. A., & van Dieën, J. H. (2014). Kinematic changes
 during running-induced fatigue and relations with core endurance in novice runners. J. Sci. Med.
 Sport. 17, 419–24. https://doi.org/10.1016/j.jsams.2013.05.013
 Lahiri, B. B., Bagavathiappan, S., Jayakumar, T. & Philip, J. (2012). Medical applications of infrared
 thermography: A review. Infrared Phys.Technol. 55, 221–35.
 https://doi.org/10.1016/j.infrared.2012.03.007
 Lim, C. L., Byrne, C., & Lee, J. K. W. (2008). Human thermoregulation and measurement of body
 temperature in exercise and clinical settings. Ann. Acad. Med. Singapore. 37, 347-53.
 Merla, A., Mattei, P. A., Di Donato, L., & Romani, G. L. (2010). Thermal imaging of cutaneous temperature
 modifications in runners during graded exercise. Ann. Biomed. Eng. 38, 158–63.
 https://doi.org/10.1007/s10439-009-9809-8
 Mero, A., Komi, P. V., & Gregor, R. J. (1992). Biomechanics of sprint running. A review. Sports Med. 13,
 376-92. https://doi.org/10.2165/00007256-199213060-00002
 Millet, G. Y., Divert, C., & Banizette, M. (2010). Changes in running pattern due to fatigue and cognitive
 load in orienteering. J. Sports Sci. 28, 153-60. https://doi.org/10.1080/02640410903406190
 Mizrahi, J., Verbitsky, O., Isakov, E. & Daily, D. (2000). Effect of fatigue on leg kinematics and impact
 acceleration in long distance running. Hum. Mov. Sci. 19, 139-51. https://doi.org/10.1016/s0167-
 9457(00)00013-0
 Möhler, F., Ringhof, S., Debertin, D., & Stein, T. (2019). Influence of fatigue on running coordination: A
 UCM analysis with a geometric 2D model and a subject-specific anthropometric 3D model. Hum.
 Mov. Sci. 66, 133–41. https://doi.org/10.1016/j.humov.2019.03.016
 Morin, J. B., Tomazin, K., Edouard, P., & Millet, G. Y. (2011). Changes in running mechanics and spring–
 mass behavior induced by a mountain ultra-marathon race. J. Biomech. 44, 1104–1107.
 https://doi.org/10.1016/j.jbiomech.2011.01.028

 792 | 2021 | ISSUE 4 | VOLUME 16 © 2021 University of Alicante
Crenna, et al. / Design of an experiment for the biomechanical and thermal analysis JOURNAL OF HUMAN SPORT & EXERCISE

 Murphy, K., Curry, E. J., & Matzkin, E. G. (2013). Barefoot running: Does it prevent injuries? Sports Med.
 43, 1131-8. https://doi.org/10.1007/s40279-013-0093-2
 Nes, B. M., Janszky, I., Wisløff, U., Støylen, A. & Karlsen, T. (2013). Age-predicted maximal heart rate
 in healthy subjects: The HUNT fitness study. Scand. J. Med. Sci. Sports. 23, 697–704.
 https://doi.org/10.1111/j.1600-0838.2012.01445.x
 Novacheck, T. F. (1998). The biomechanics of running. Review Paper. Gait Posture. 7, 77−95.
 https://doi.org/10.1016/S0966-6362(97)00038-6
 Reenalda, J., Maartens, E., Homan, L., & Buurke, J. H. (2016). Continuous three dimensional analysis
 of running mechanics during a marathon by means of inertial magnetic measurement units to
 objectify changes in running mechanics. J. Biomech. 49, 3362-7.
 https://doi.org/10.1016/j.jbiomech.2016.08.032
 Ring, E.F.J., & Ammer, K.. (2012). Infrared thermal imaging in medicine. Physiol. Meas. 33, R33−6.
 https://doi.org/10.1088/0967-3334/33/3/R33
 Roberts, B. C., Waller, T. M., & Caine, M. P. (2007). Thermoregulatory response to base-layer garments
 during treadmill exercise. Int. J. Sports Sci. Eng. 1, 29-38.
 Scholz, M. N., Bobbert, M. F., van Soest, A. J., Clark, J. R., & van Heerden, J. (2008). Running
 biomechanics: Shorter heels, better economy. J. Exp. Biol. 211, 3266−71.
 https://doi.org/10.1242/jeb.018812
 Smith, C. J. & Havenith, G. (2011). Body mapping of sweating patterns in male athletes in mild exercise-
 induced hyperthermia. Eur. J. Appl. Physiol. 111, 1391–404. https://doi.org/10.1007/s00421-010-
 1744-8
 Souza, R. B. (2016). An evidence-based videotaped running biomechanics analysis. Phys. Med. Rehabil.
 Clin. 27 217−36. https://doi.org/10.1016/j.pmr.2015.08.006
 Steadman, R. G. (1979). The assessment of sultriness. Part I: A temperature-humidity index based on
 human physiology and clothing science. J. Appl. Meteorol. 18, 861-73.
 Tanda, G. (2016). Skin temperature measurements by infrared thermography during running exercise.
 Exp. Therm. Fluid Sci. 71, 103-13. https://doi.org/10.1016/j.expthermflusci.2015.10.006
 Tanda, G. (2018). Total body skin temperature of runners during treadmill exercise. A pilot study. J.
 Therm. Anal. Calorim. 131, 1967-77. https://doi.org/10.1007/s10973-017-6634-4
 Tartaruga, M. P., Brisswalter, J., Peyré-Tartaruga, L. A., Ávila, A. O. V., Alberton, C. L., Coertjens, M.,
 Cadore, E. L., Tiggemann, C. L., Silva, E. M., & Kruel, L. F. M. (2012). The relationship between
 running economy and biomechanical variables in distance runners. Res. Q. for Exerc. Sport. 83
 367−75. https://doi.org/10.1080/02701367.2012.10599870
 Tawa, N., & Louw, Q. (2018). Biomechanical factors associated with running economy and performance
 of elite Kenyan distance runners: A systematic review. J. Bodyw. Mov. Ther. 22, 1−10.
 https://doi.org/10.1016/j.jbmt.2017.11.004
 Thordarson, D. B. (1997). Running biomechanics. Clin. Sports Med. 16, 239-47.
 https://doi.org/10.1016/S0278-5919(05)70019-3
 Tian, F., Li, N., Zheng, Z., Huang, Q., Zhu, T., Li, Q., Wang, W., Tsai, T.-Y., & Wang, S. (2020). The
 effects of marathon running on three-dimensional knee kinematics during walking and running in
 recreational runners. Gait Posture. 75, 72–7. https://doi.org/10.1016/j.gaitpost.2019.08.009
 Vercruyssen, F., Tartaruga, M., Horvais, N., & Brisswalter, J. (2016). Effects of footwear and fatigue on
 running economy and biomechanics in trail runners. Med. Sci. Sports Exerc. 48, 1976-84.
 https://doi.org/10.1249/MSS.0000000000000981
 Williams, K. R., Snow, R., & Agruss, C. (1991). Changes in distance running kinematics with fatigue. Int.
 J. Sport Biomech. 7, 138−62. https://doi.org/10.1123/ijsb.7.2.138
 Winter, D. A., Biomechanics and Motor Control of Human Movement. Wiley 2009.

 VOLUME 16 | ISSUE 4 | 2021 | 793
You can also read