Predicting Modifiers of Genotype-Phenotype Correlations in Craniofacial Development
←
→
Page content transcription
If your browser does not render page correctly, please read the page content below
International Journal of
             Molecular Sciences

Article
Predicting Modifiers of Genotype-Phenotype Correlations in
Craniofacial Development
Ranjeet D. Kar and Johann K. Eberhart *

                                         Department of Molecular Biosciences, College of Natural Sciences, University of Texas at Austin,
                                         Austin, TX 78712, USA
                                         * Correspondence: eberhart@austin.utexas.edu

                                         Abstract: Most human birth defects are phenotypically variable even when they share a common
                                         genetic basis. Our understanding of the mechanisms of this variation is limited, but they are thought
                                         to be due to complex gene-environment interactions. Loss of the transcription factor Gata3 associates
                                         with the highly variable human birth defects HDR syndrome and microsomia, and can lead to
                                         disruption of the neural crest-derived facial skeleton. We have demonstrated that zebrafish gata3
                                         mutants model the variability seen in humans, with genetic background and candidate pathways
                                         modifying the resulting phenotype. In this study, we sought to use an unbiased bioinformatic
                                         approach to identify environmental modifiers of gata3 mutant craniofacial phenotypes. The LINCs
                                         L1000 dataset identifies chemicals that generate differential gene expression that either positively or
                                         negatively correlates with an input gene list. These chemicals are predicted to worsen or lessen the
                                         mutant phenotype, respectively. We performed RNA-seq on neural crest cells isolated from zebrafish
                                         across control, Gata3 loss-of-function, and Gata3 rescue groups. Differential expression analyses
                                         revealed 551 potential targets of gata3. We queried the LINCs database with the 100 most upregulated
                                         and 100 most downregulated genes. We tested the top eight available chemicals predicted to worsen
                                         the mutant phenotype and the top eight predicted to lessen the phenotype. Of these, we found that
                                         vinblastine, a microtubule inhibitor, and clofibric acid, a PPAR-alpha agonist, did indeed worsen
                                         the gata3 phenotype. The Topoisomerase II and RNA-pol II inhibitors daunorubicin and triptolide,
                                         respectively, lessened the phenotype. GO analysis identified Wnt signaling and RNA polymerase
                                         function as being enriched in our RNA-seq data, consistent with the mechanism of action of some of
Citation: Kar, R.D.; Eberhart, J.K.
                                         the chemicals. Our study illustrates multiple potential pathways for Gata3 function, and demonstrates
Predicting Modifiers of
                                         a systematic, unbiased process to identify modifiers of genotype-phenotype correlations.
Genotype-Phenotype Correlations in
Craniofacial Development. Int. J. Mol.
                                         Keywords: phenotypic variation; zebrafish; craniofacial development; neural crest; Gata3; transcrip-
Sci. 2023, 24, 1222. https://doi.org/
                                         tomics
10.3390/ijms24021222

Academic Editors: Seong-kyu Choe
and Cheol-Hee Kim
                                         1. Introduction
Received: 22 November 2022
Revised: 26 December 2022                     Congenital birth defects are among the leading causes of infant mortality in the
Accepted: 30 December 2022               United States, according to the Centers for Disease Control. Defects of the craniofacial
Published: 8 January 2023                skeleton are among the most common birth defects. For example, the prevalence of cleft lip
                                         with or without cleft palate is 10.2 per 10,000 births in the United States [1]. In addition,
                                         phenotypic variation is common within birth defects. The causes of these defects and their
                                         variability is not well understood, but is thought to result from a combination of genetic
Copyright: © 2023 by the authors.        and environmental factors.
Licensee MDPI, Basel, Switzerland.            One major neural crest subpopulation, cranial neural crest cells (CNCCs), is the pri-
This article is an open access article
                                         mary source of progenitors of skeletal and connective tissues in the face [2]. In both humans
distributed under the terms and
                                         and zebrafish, CNCCs that generate the palatal skeleton populate the maxillary prominence
conditions of the Creative Commons
                                         of the first pharyngeal arch, as well as the frontonasal prominences [3–5]. In zebrafish
Attribution (CC BY) license (https://
                                         embryos, the cartilaginous palate (anterior neurocranium) consists of an ethmoid plate
creativecommons.org/licenses/by/
                                         connected posteriorly to bilateral trabeculae, and forms the roof of the oropharynx [4,5].
4.0/).

Int. J. Mol. Sci. 2023, 24, 1222. https://doi.org/10.3390/ijms24021222                                           https://www.mdpi.com/journal/ijms
Int. J. Mol. Sci. 2023, 24, 1222                                                                                            2 of 15

                                   The trabeculae serve as the connection to the posterior neurocranium, which is mostly de-
                                   rived from mesoderm [6]. Functional analysis has shown that early zebrafish development,
                                   including palatal growth, can be used to model craniofacial development in mammals [7–9].
                                   Due to their external development and genetic tractability, this makes zebrafish an excellent
                                   model in which to identify and characterize gene-environment interactions.
                                        The zinc finger transcription factor Gata3 is one in a family of factors that regulate cell
                                   behaviors related to development, including differentiation, migration, and motility [10–12].
                                   GATA3 haploinsufficiency causes hypoparathyroidism, sensorineural deafness and renal
                                   dysplasia (HDR) syndrome in humans, which can include palate defects [13,14]. Most
                                   notably, GATA3 has been associated with microsomia in humans [15]. Loss of function
                                   experiments in mice show that Gata3 is necessary for the proper development of structures
                                   derived from cranial neural crest cells, including the tongue, mandible and teeth [16,17]. As
                                   a transcription factor, Gata3 mediates the interactions of multiple cofactors and chromatin
                                   to control gene expression. Despite the link between Gata3 and palate formation, the
                                   genetic mechanisms by which it regulates craniofacial development are largely unknown.
                                        Previous work by our lab shows that a point mutation in zebrafish gata3 results in
                                   palate defects and recapitulates the phenotypes observed in human HDR patients [18].
                                   Phenotypes associated with GATA3 in humans are highly variable. While HDR is quite
                                   rare, microsomia is more common, with an incidence rate of at least 1 in every 5600 em-
                                   bryos [19]. We have shown that the craniofacial phenotypes in gata3 mutant zebrafish
                                   are also highly variable and depend upon genetic background [18,20]. The variability in
                                   both human and zebrafish GATA3 mutants are likely due to variable disruption of the
                                   GATA3 transcriptional network, possibly due to environmental perturbation. Here, we use
                                   bioinformatic approaches to predict chemical modifiers of the gata3 mutant phenotype. Our
                                   results demonstrate that the utility of the approach and suggest that similar approaches
                                   could be used to identify modifiers of other mutations.

                                   2. Results
                                   2.1. Targets of Gata3 in Cranial Neural Crest Cells
                                         Previous work in zebrafish demonstrated that an intersectional approach, collecting
                                   cells positive for both fli1:EGFP and sox10:mRFP transgenes via FACS, could be used to
                                   collect a pure population of cranial neural crest cells (CNCC) [21]. We used this approach
                                   to collect CNCC from 28 hpf zebrafish embryos, a time point when Gata3 function is critical
                                   for proper craniofacial development [18].
                                         To determine the effect of gata3 on craniofacial development, we collected CNCCs
                                   from control, knockdown and rescue groups from three biological replicates and conducted
                                   RNA-seq (Figure 1). The control group comprised embryos that were not injected with
                                   a gata3 morpholino, the knockdown group was injected with the morpholino, and the
                                   rescue group was injected with the morpholino and subsequently experienced ectopic gata3
                                   expression due to a heat-shock-driven transgene. The resulting RNA-seq dataset yielded
                                   701 differentially expressed genes, comparing each treatment to control. Legitimate targets
                                   of gata3 are predicted to be those whose expression moved in opposite directions when
                                   comparing the knockdown and rescue datasets (Figure 2A). This final group comprises
                                   551 genes (Figure 2B, false-discovery rate < 0.05). Gene Ontology (GO) term enrichment [22]
                                   indicated that at 5 of the top 6 most-enriched terms were those related to either the Wnt
                                   pathway or RNA polymerase II activity (Figure 3). More specifically, we found enrichment
                                   of terms tied to RNA polymerase II activity, driven by DNA binding. The top three
                                   upregulated and downregulated genes are shown in Figure 3B. Our GO analysis also
                                   revealed links to Wnt protein binding, with the top three upregulated and downregulated
                                   genes shown in Figure 3C. To ensure that the sample was not contaminated by non-CNCCs,
                                   we looked at the expression values of flk1 (vasculature) and otx2 (otic placodes). Neither of
                                   these genes had high read counts in our dataset, allowing us to conclude that our data are
                                   highly enriched in legitimate targets of gata3 in CNCC.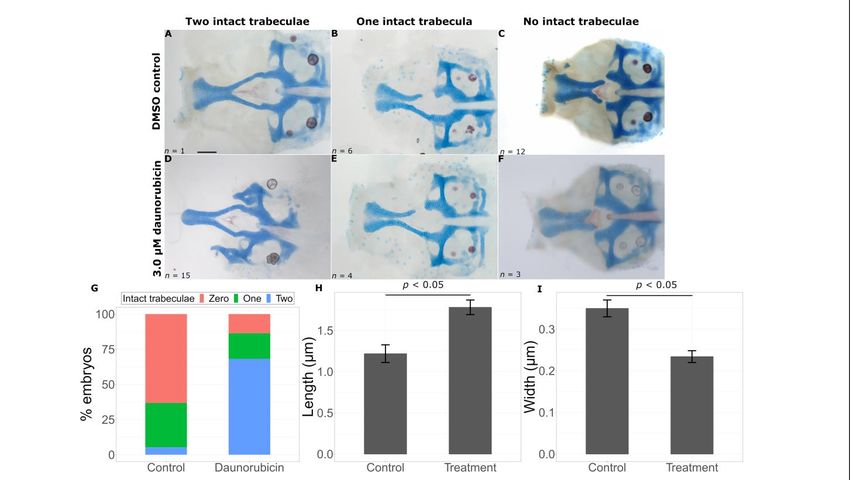
Int. J. Mol. Sci. 2023, 24, x FOR PEER REVIEW                                                                                  3 of 16
           Int. J. Mol. Sci. 2023, 24, x FOR PEER REVIEW                                                                          3 of 16

Int. J. Mol. Sci. 2023, 24, 1222                                                                                                      3 of 15

                                       FigureFigure 1. Experimental
                                              1. Experimental       protocol
                                                               protocol  for for RNA-seq.
                                                                              RNA-seq.    Createdwith
                                                                                        Created  with BioRender.com
                                                                                                      BioRender.com (accessed
                                                                                                                     (accessedonon
                                                                                                                                 21 21
                                                                                                                                    No-Novem-
                                        Figure 1. Experimental
                                             vember  2022).    protocol for RNA-seq. Created with BioRender.com (accessed on 21 No-
                                       ber 2022).
                                        vember 2022).

                                       Figure 2. Changes in gata3 expression drive differential regulation. (A) A subset of differentially
                                       expressed genes which had directionally discordant changes between the knockdown and rescue
                                       groups (relative to the control) were selected for further bioinformatic analysis. (B) There were
                                       551 differentially regulated genes selected for analysis. (C) The five most upregulated genes in the
                                       knockdown group. (D) The five most down regulated genes in the knockdown group.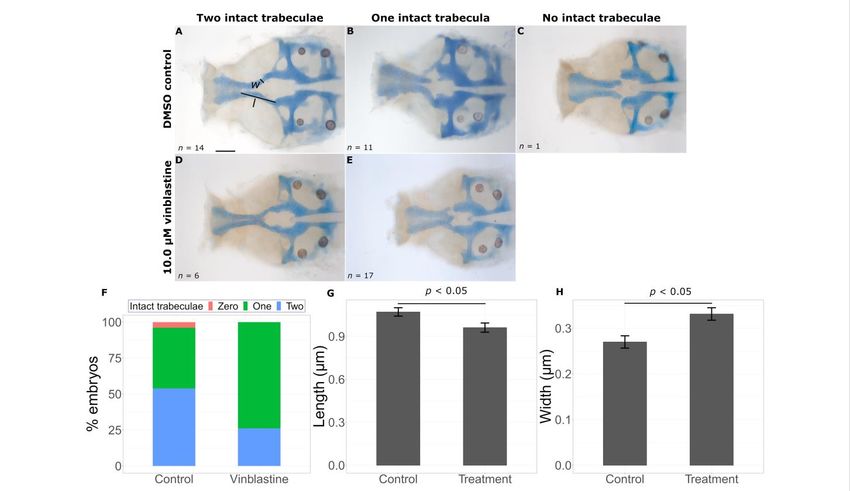
Figure 2. Changes in gata3 expression drive differential regulation. (A) A subset of differentially
expressed genes which had directionally discordant changes between the knockdown and rescue
groups (relative to the control) were selected for further bioinformatic analysis. (B) There were 551
differentially regulated genes selected for analysis. (C) The five most upregulated genes in the
Int. J. Mol. Sci. 2023, 24, 1222 knockdown group. (D) The five most down regulated genes in the knockdown group. 4 of 15
Figure GO
3. 3.
Figure GOanalysis
analysisofofRNA-seq
RNA-seqdataset. (A) Wnt
dataset. (A) Wntprotein
proteinbinding
bindingandandRNA
RNA polymerase
polymerase II
II tran-
transcription-factor bindingprocesses
scription-factor binding processeswere
werehighly
highlyoverrepresented.
overrepresented.(B)(B)Representative
Representativegenes
genesfrom
fromthe
the“RNA
“RNA polymerase
polymerase II sequence-specific
sequence-specific DNA
DNAbinding”
binding”term.
term.(C)
(C)Representative genes
Representative from
genes thethe
from
“Wnt
“Wnt protein
protein binding”
binding” term.term.
To To
validate our our
validate RNA-seq
RNA-seqdata, data,
we selected the tenthe
we selected genes ten(five upregulated,
genes five down-
(five upregulated, five
regulated) with the with
downregulated) highest
themagnitude of expression
highest magnitude change (Figure
of expression change2C,D) and2C,D)
(Figure performed
and per-
RT-qPCR. Nine of these
formed RT-qPCR. Nineten genesten
of these demonstrated significant
genes demonstrated differential
significant expression
differential mir-
expression
roring that of our RNA-seq data (Figure S1). We conclude that our RNA-seq
mirroring that of our RNA-seq data (Figure S1). We conclude that our RNA-seq dataset dataset is is
highly enriched in Gata3 target genes within the neural crest. Principal component
highly enriched in Gata3 target genes within the neural crest. Principal component anal- analysis
(Figure S2) demonstrated
ysis (Figure no major
S2) demonstrated batchbatch
no major effects. It also
effects. showed
It also thatthat
showed the the
neural CNCC
neural CNCC
transcriptome
transcriptome in in
uninjected
uninjected controls resembled
controls resembled that of of
that thethe
rescue group
rescue group(with ectopic
(with ectopic
Gata3 expression),
Gata3 expression),whereas
whereasthethe
knockdown
knockdown group
groupwas transcriptomically
was transcriptomically distinct, as we
distinct, as we
would expect.
would expect.
2.2. Transcriptomic Data Can Predict Chemical Modifiers of Genotype-Phenotype Correlations
2.2. Transcriptomic Data Can Predict Chemical Modifiers of Genotype-Phenotype Correlations
We sought to determine the extent to which our transcriptomic data could predict
We sought to determine the extent to which our transcriptomic data could predict
chemical modifiers of the mutant phenotype. From our gata3 transcriptomic dataset, we
chemical modifiers of the mutant phenotype. From our gata3 transcriptomic dataset, we
queried the LINCS L1000 platform (https://clue.io/, accessed on 21 November 2022) [23]
queried the LINCS L1000 platform (https://clue.io/, accessed on 21 November 2022) [23]
with the 100 top positively and negatively regulated genes (200 total genes). Our data
with the 100 top positively and negatively regulated genes (200 total genes). Our data
comprise both loss- and gain-of-function approaches. For clarity, we relate these chemicals
compriseof
to direction both loss- and
expression gain-of-function
change approaches. For
in gata3 loss-of-function clarity,
neural crest we relate
cells. these
Thus, chemi-
positive
cals to direction of expression change in gata3 loss-of-function neural crest cells.
correlation predicts worsening of the phenotype and inverse correlation predicts lessening. Thus,
positive correlation predicts worsening of the phenotype and inverse correlation
Of the chemicals predicted by LINCs, we chose the 8 most positively and 8 most negatively predicts
lessening.
correlated Of the chemicals
chemicals (Figure 4)predicted by LINCs,
to test their wemodify
ability to chose the 8 most
gata3 positively
mutant and 8 most
phenotypes.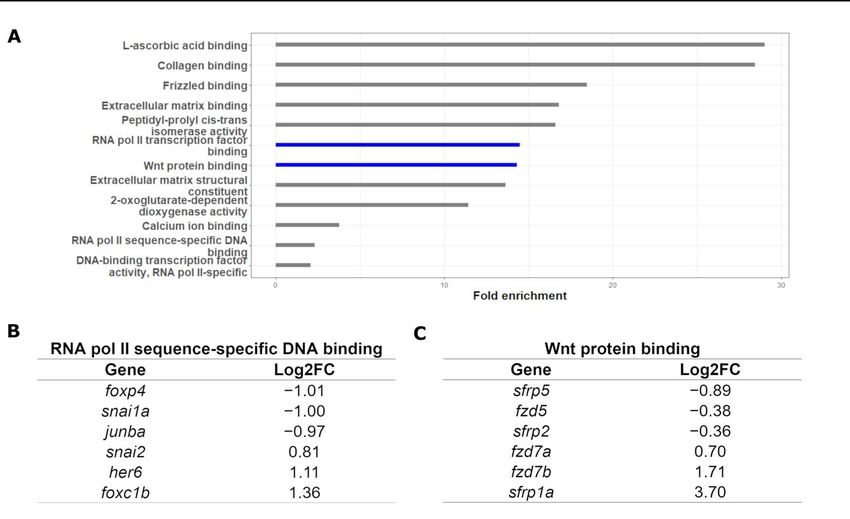
negatively correlated chemicals (Figure 4) to test their ability to modify gata3 mutant phe-
notypes.
Int. J. Mol. Sci. 2023, 24, 1222 5 of 15
Figure 4. Gata3 dataset yields chemical modifiers via LINCS. The top 100 up- and down-regulated
genes affected by gata3 knockdown and rescue were queried against the LINCS L1000 dataset. The
Figure 4. Gata3 dataset yields chemical modifiers via LINCS. The top 100 up- and down-regulated
chemical
genes modifiers
affected whose
by gata3 profile most
knockdown resembled
and rescue were the transcriptomic
queried against thesignature weredataset.
LINCS L1000 selected for
The
testing. Modifiers that significantly reduced the intact trabeculae count in mild mutant
chemical modifiers whose profile most resembled the transcriptomic signature were selected for phenotype are
listed under
testing. “enhances
Modifiers phenotype”,reduced
that significantly while those that significantly
the intact increased
trabeculae count themutant
in mild trabeculae count in
phenotype
are
thelisted
severeunder “enhances
mutant phenotypephenotype”, while those
are listed under that significantly
“suppresses phenotype”.increased
Createdthe trabeculae
with count
BioRender.com.
in the severe mutant phenotype are listed under “suppresses phenotype”. Created with BioRen-
der.com.We first performed a dose response analysis for each of the chemicals to identify the
lowest dose with which we observe facial defects. We tested doses at the concentrations
We
of 0.1 µM,first1 performed
µM, 10 µM,aand dose100 response
µM. Weanalysis
selected for
theeach of theconcentration
highest chemicals to identify the
that yielded
an embryo
lowest dose withdeathwhich
rate orweinduced
observegrossfacialmorphological
defects. We tested defects
dosesin at
less
thethan 10% of fish
concentrations
of(Figure
0.1 μM, S3).
1 μM, 10 μM, and 100 μM. We selected the highest concentration that yielded
Previous
an embryo death work
rateinorour lab has
induced shown
gross that gata3b1075
morphological mutant
defects phenotypes
in less than 10% of in fish
zebrafish
(Fig-
areS3).
ure variable and established two inbred lines that consistently gave phenotypes at each end
of this spectrum
Previous work [18].
inIn one
our labline,
hasthe trabeculae
shown are intact
that gata3 but chondrocyte
b1075 mutant phenotypes arrangement
in zebrafishis
altered resulting in a defect in extension of the trabeculae (referred
are variable and established two inbred lines that consistently gave phenotypes to as the mild phenotype).
at each
In the other, the trabeculae are broken resulting in a failure in connection
end of this spectrum [18]. In one line, the trabeculae are intact but chondrocyte arrange- of the anterior and
posterior
ment regions
is altered of the neurocranium
resulting in a defect in (the severeof
extension phenotype).
the trabeculae We leveraged
(referred to this
asvariability
the mild
to test for specific
phenotype). In the interactions with our are
other, the trabeculae candidate
brokensmall molecule
resulting drugs. in connection of
in a failure
Chemicals
the anterior and with positive
posterior correlations
regions to the gata3 loss-of-function
of the neurocranium data are anticipated
(the severe phenotype). We lever-
to worsen the mutant phenotype. Therefore, we tested these chemicals
aged this variability to test for specific interactions with our candidate small molecule on the mild phe-
notype
drugs. background. We scored fish by counting the number of uninterrupted trabeculae
in each embryo.
Chemicals with Topositive
assay the effect of the
correlations to thechemicals predicted to data
gata3 loss-of-function worsenare phenotypes,
anticipated
we determined appropriate dosing concentrations for
to worsen the mutant phenotype. Therefore, we tested these chemicals on the each drug through graded
mildassays
phe-
in wild-type fish. We then used these concentrations to treat gata3 b1075 “mild” embryos
notype background. We scored fish by counting the number of uninterrupted trabeculae
infrom
each24embryo.
to 48 hpf, Toassessing
assay thephenotype
effect of the in chemicals
embryos fixed and stained
predicted to worsenwithphenotypes,
Alcian blue we and
Alizarin red.
determined appropriate dosing concentrations for each drug through graded assays in
Of the
wild-type eight
fish. Wechemicals
then used tested, two exacerbated
these concentrations the craniofacial
to treat phenotypes
gata3b1075 “mild” embryosinfrom mild
gata3 mutants. Treatment with vinblastine, a microtubule inhibitor,
24 to 48 hpf, assessing phenotype in embryos fixed and stained with Alcian blue and Aliz- leads to a significant
decrease in number of intact trabeculae (Figure 5F, Fisher’s exact test, p-value < 0.05). While
arin red.
the majority of untreated mutants had two intact trabeculae (14 out of a total 26), the
Of the eight chemicals tested, two exacerbated the craniofacial phenotypes in mild
opposite is true for exposed mutants (6/23). We took linear measures of the length and
gata3 mutants. Treatment with vinblastine, a microtubule inhibitor, leads to a significant
width of the trabeculae to quantify the effects on extension. Consistent with observations
decrease b1075in number of intact trabeculae (Figure 5F, Fisher’s exact test, p-value < 0.05).
in gata3 mutant fish, we saw shorter (control = 1.0709 ± 0.02093 µm, treatment =
While the majority of untreated mutants had two intact trabeculae (14 out of a total 26),
0.9615 ± 0.0320 µm, p = 0.0135) and wider (control = 0.2701 ± 0.0135 µm, treatment =
the opposite is true for exposed mutants (6/23). We took linear measures of the length and
0.3313 ± 0.0137 µm, p = 0.00197) trabeculae in vinblastine-treated fish (Figure 5G,H).
width of the trabeculae to quantify the effects on extension. Consistent with observations
                                   in gata3b1075 mutant fish, we saw shorter (control = 1.0709 ± 0.02093 μm, treatment = 0.9615
Int. J. Mol. Sci. 2023, 24, 1222   ± 0.0320 μm, p = 0.0135) and wider (control = 0.2701 ± 0.0135 μm, treatment = 0.3313         ±
                                                                                                                          6 of 15
                                   0.0137 μm, p = 0.00197) trabeculae in vinblastine-treated fish (Figure 5G,H).

                                   Figure 5. Vinblastine
                                              Vinblastine exacerbates the gata3 mutant phenotype. Representative flat mounts show the
                                   range  of defects inDMSO
                                   range of defects in  DMSOtreated
                                                                 treated(A–C)
                                                                           (A–C)  and
                                                                                and    vinblastine
                                                                                     vinblastine       treated
                                                                                                   treated     (D,E)
                                                                                                            (D,E)    embryos.
                                                                                                                  embryos.        Vinblastine
                                                                                                                              Vinblastine      treat-
                                                                                                                                           treatment
                                   ment  leads to a statistically significant  decrease  in intact   trabeculae  count  ((F), p < 0.05), a
                                   leads to a statistically significant decrease in intact trabeculae count ((F), p < 0.05), a reduction inreduction
                                   in trabeculae
                                   trabeculae     length
                                               length     ((G),
                                                       ((G),  p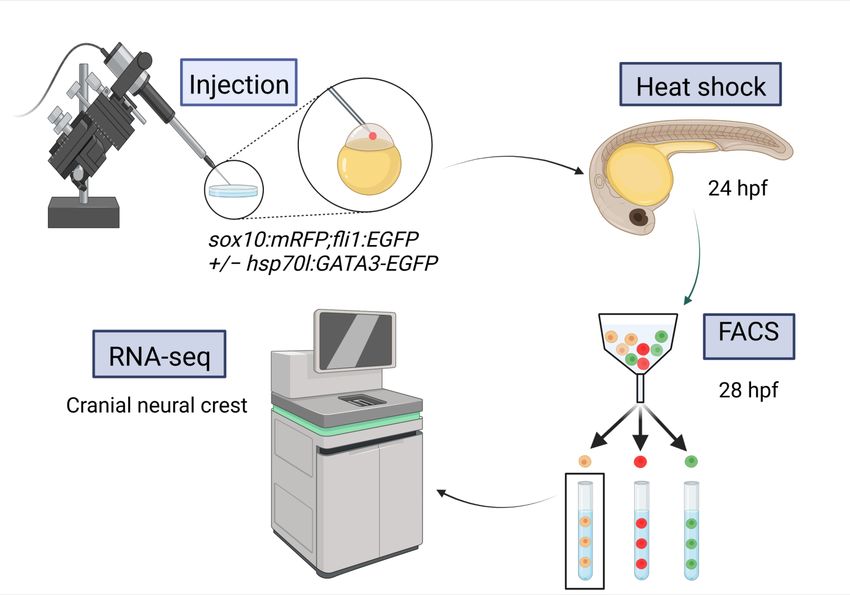
Int. J. Mol. Sci. 2023,
                   Int. J.24, 1222
                           Mol. Sci. 2023, 24, x FOR PEER REVIEW                                                                                       7 of 15     7 of 1

                                          Figure 6. Clofibric acid worsens the gata3 mutant phenotype. Representative flat mounts show
                                                           Figure 6. Clofibric acid worsens the gata3 mutant phenotype. Representative flat mounts show de
                                          defects in thefects
                                                            trabeculae    with DMSO
                                                                 in the trabeculae     treatment
                                                                                      with DMSO (A–C)     and(A–C)
                                                                                                   treatment   chemicalandtreatment
                                                                                                                            chemical (D–F).
                                                                                                                                      treatmentClofibric
                                                                                                                                                   (D–F).acid
                                                                                                                                                            Clofibric acid
                                          treatment leads      to a statistically
                                                           treatment               significant significant
                                                                      leads to a statistically  decrease in   intact trabeculae
                                                                                                            decrease               count ((G),
                                                                                                                       in intact trabeculae      p
Int. J. Mol. Sci. 2023, 24, 1222 8 of 15
The second chemical that improved phenotypes is Daunorubicin, a chemotherapy drug
used for certain leukemias. This chemical also produced a significantly higher proportion
of embryos with two intact trabeculae in treated embryos (15/22) versus untreated embryos
(1/18) (Figure 8D–F, Fisher’s exact test, p < 0.05). As expected, these embryos had longer
REVIEW = 1.2186 ± 0.1074 µm, treatment = 1.7814 ± 0.0887 µm, p = 0.000166) and wider
Int. J. Mol. Sci. 2023, 24, x FOR PEER(control 9 of 16
(control = 0.3498 ± 0.0202 µm, treatment = 0.2340 ± 0.0143 µm, p = 0.0000225) trabeculae
compared to untreated gata3b1075 severe mutant fish (Figure 8H,I).
Figure8.8.Daunorubicin
Figure Daunorubicin suppresses
suppresses thethe gata3
gata3 mutant
mutant phenotype.
phenotype. Representative
Representative flat flat mounts
mounts show show
breaks in the trabeculae with DMSO treatment (A–C) and chemical treatment (D–F).
breaks in the trabeculae with DMSO treatment (A–C) and chemical treatment (D–F). Daunorubicin Daunorubicin
treatmentleads
treatment leadstotoa astatistically
statistically significant
significant increase
increase in intact
in intact trabeculae
trabeculae count
count ((G),((G),
p < p0.05),
< 0.05),
an an
increase in trabeculae length ((H), p < 0.05) and a decrease in trabeculae width ((I), p
increase in trabeculae length ((H), p < 0.05) and a decrease in trabeculae width ((I), p < 0.05). Error< 0.05). Error
bars represent SEM. Scale bar =
bars represent SEM. Scale bar = 0.5 µm. 0.5 μm.
ToToensure
ensurethat
that our
our results
results were
were truly
truly a reflection
a reflection of LINCS
of LINCS prediction,
prediction, we we randomly
randomly
selected1010chemicals
selected chemicalsfrom
fromthethe full
full LINCS
LINCS list,
list, that
that were
were notnot correlated
correlated with
with thethe input
input data.
data.
We
Wetreated
treatedgata3 mutants
gata3 mutantswith them
with as described
them as described above (Table(Table
above S1). We found
S1). no significant
We found no signifi-
difference in intact
cant difference in trabeculae between
intact trabeculae treated treated
between and untreated groups in
and untreated this sample.
groups This
in this sample.
outcome demonstrates that the LINCS dataset can effectively predict chemicals
This outcome demonstrates that the LINCS dataset can effectively predict chemicals that willthat
modify mutant phenotypes.
will modify mutant phenotypes.
3. Discussion
3. Discussion
Most birth defects are thought to be caused by complex gene-environment interactions.
Most birth defects are thought to be caused by complex gene-environment interac-
However, identifying environmental exposures that modify phenotypic outcomes of a
tions. However, identifying environmental exposures that modify phenotypic outcomes
genetic mutation is extremely difficult. We have demonstrated that transcriptomic profiling
of abegenetic
can mutation
successfully used is
to extremely difficult.
identify chemicals We
that have
will demonstrated
modify that transcriptomic
this genotype-phenotype re-
profiling can be successfully used to identify chemicals that will modify
lationship in predictable ways. Our findings have translational implications as many this genotype-
of the
phenotype
drugs relationship
and chemicals in theinLINCS
predictable
datasetways. Our findings
have clinical have
use or are translational
found implications
in the environment.
as many of the drugs and chemicals in the LINCS dataset have clinical use or are found in
the environment.
3.1. Prediction of Chemicals That Worsen Mutant Phenotypes
Our approach holds excellent promise for identifying therapies that should be con-
traindicated in specific populations of individuals. Vinblastine is an anticancer drug that
exacerbated defects in gata3 mutant embryos. This has notable clinical implications as vin-Int. J. Mol. Sci. 2023, 24, 1222 9 of 15
3.1. Prediction of Chemicals That Worsen Mutant Phenotypes
Our approach holds excellent promise for identifying therapies that should be con-
traindicated in specific populations of individuals. Vinblastine is an anticancer drug that
exacerbated defects in gata3 mutant embryos. This has notable clinical implications as
vinblastine is recommended for treatment (in combination with other therapies) of preg-
nant patients with non-epithelial ovarian cancer [24]. Human studies have not identified
rates of birth defects above what would be expected in women undergoing treatment.
However, these studies are too small to detect sensitization to specific genotypes, but our
findings raise the question of whether vinblastine may have deleterious effects for devel-
oping progeny of cancer patients—or whether specific drug combinations may mitigate
those complications.
The PPAR agonist clofibric acid (clofibrate is its anionic form) plays a major role in
fatty acid metabolism, and most notably has been demonstrated to lower triacylglycerol in
rat fetuses through clofibrate administration in the maternal diet while increasing mRNA
concentrations of proto-oncogenes c-myc and c-jun in the liver of pigs [25,26]. Although the
hepatic effects of clofibrate in both mammalian fetuses and adults have been studied, and
gata3 knockout in embryonic mice elicits a significant phenotype in the liver the genetic
interaction between the drug and the gene in the zebrafish palate is novel, and suggests that
clofibrate may have more wide-ranging developmental downstream effects than previously
suspected [27].
Beyond the four chemicals we independently validated to interact with gata3 in
the embryonic zebrafish palate, the LINCS dataset revealed more avenues of study to
investigate possible mechanisms of action for craniofacial development. Half of the top 10
chemicals predicted to enhance the gata3 mutant phenotype have tubulin inhibitor function.
Previous chemical and genetic studies have shown that tubulin stability is regulated in
part through a Wnt-activating pathway, tying together the findings from our differential
expression and gene ontology analyses [28,29]. Interestingly, vinblastine and its sister
derivative chemical vincristine were both identified as potential chemical modifiers with
microtubule inhibitory activity via the LINCs analysis, but only vinblastine was observed
to have a significant effect on the gata3 phenotype. Comparative studies have shown that
the two chemicals have similar potency but differential inhibition of net addition of tubulin
in vitro [30]. That such a narrow difference in function could have a quantifiable effect
on interaction with the gata3 phenotype illustrates the potential specificity of microtubule
function within this craniofacial signaling pathway.
3.2. Identification of Chemicals That Are Protective against Deleterious Phenotypes
While avoiding deleterious exposures may be of primary concern, understanding
chemicals that protect against deleterious phenotypes could be quite useful in preventing
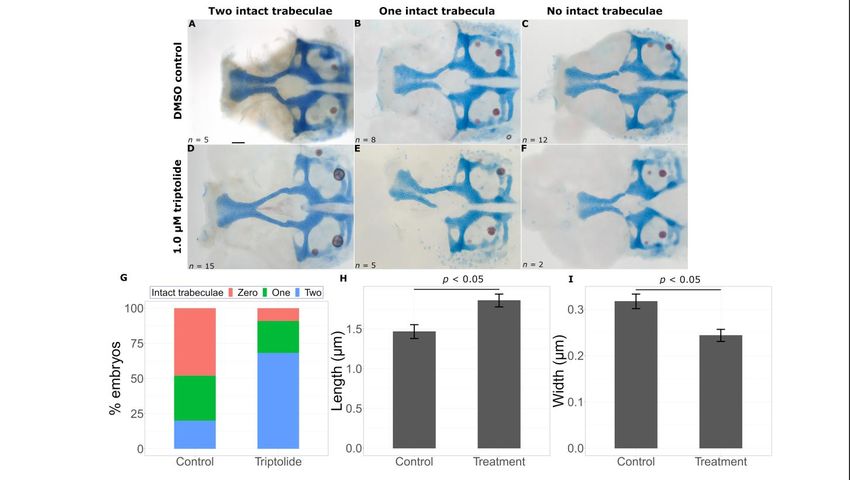
birth defects. One of the small molecules that lessened the gata3 phenotype was triptolide,
an RNA polymerase inhibitor. Used in traditional Chinese medicine for many years for its
anti-inflammatory properties, it has been more recently shown to have potential anti-cancer
applications [31–33]. To date, its therapeutic properties have been studied with respect to
transcriptional regulation of oncogenes and cell cycle regulators [34], but our work suggests
that further study of triptolide’s potential protective effects in craniofacial development is
warranted. Interestingly, we observed a near-complete rescue of the mutant phenotype in
some instances. This raises the that triptolide’s activity in the neural crest closely resembles
that of gata3.
Another drug that our studies showed to mitigate gata3-related palatal defects, daunoru-
bicin, has also been used in anticancer combination therapies for several decades, includ-
ing one case in which it contributed to complete remission of leukemia in a pregnant
woman [35]. However, daunorubicin also elicits cytotoxicity by potentially inhibiting
DNA repair pathways [36]. In zebrafish embryos, anthracyclines such as daunorubicin
cause minor heart defects [37]. These differential outcomes invite further study of howInt. J. Mol. Sci. 2023, 24, 1222 10 of 15
daunorubicin interacts with different genetic pathways to produce positive effects in some
cell systems and adverse effects in others.
3.3. Identification of Functional Modules through RNA-seq
Our RNA-seq data and subsequent GO analysis indicated two groups of genes that
aligned well with the chemical interactions predicted by LINCS: Wnt signaling and RNA
polymerase II activity (Figure 3). As with triptolide, daunorubicin has been shown to have
RNA polymerase II and III inhibitory activity [38–40]. It is of interest that daunorubicin
has been shown to induce Jun expression in drug resistant acute myeloid leukemia cells.
Loss of gata3 caused a reduction in junba expression in zebrafish. Thus, the effect of these
drugs may be based on restoring the normal expression of a subset of these enriched genes.
The Wnt family of ligands play an important role in the morphogenetic movements
that drive formation of the pharyngeal skeleton and neurocranium. In particular, the
WNT/planar cell polarity (PCP) pathway controls cell polarization and movement in these
tissues [41–43]. The significant misregulation of several Wnt/PCP pathway members,
including frizzled and frizzled-related genes, suggest that Gata3 may control effectors of
the cellular movements involved in trabecular formation. In particular, fzd7a is required
for extension of the palate in zebrafish [44]. Additionally, the sfrp gene family plays an
important role in facilitating signal inputs in the non-canonical Wnt pathways involved
in convergent extension in Xenopus [45]. Thus, genes enriched within these GO terms are
excellent candidates for genes that may modify the gata3 phenotype.
4. Materials and Methods
4.1. Animal Care and Use
Zebrafish were raised according to IACUC-approved protocols at the University
of Texas at Austin and were staged as previously described [46]. All zebrafish trans-
genic lines were maintained from stocks derived from the AB wild-type strain. The fol-
lowing transgenic lines were used: Tg(fli1:EGFP)v1 [47], Tg(sox10:mRFP)vu2 [48], and
Tg(hsp70l;GATA3:EGFP) [20]. These are referred to as fli1:EGFP, sox10:mRFP, and hs:GATA3-
GFP for clarity, respectively. The gata3b1075 mild and severe mutant strains were used for
chemical analyses; the “mild” background was generated through an outcross to WIK and
the “severe” background was generated through a cross to fli1:EGFP, originally in the EK
background [18]. Genotyping primers for the gata3 mutants are in Table S2.
4.2. Injections and Heat Shock
The control and knockdown groups were generated by crossing fli1:EGFP;sox10:mRFP
double transgenic fish to wild-type fish. The rescue group was generated by crossing
fli1:EGFP;sox10:mRFP to homozygous hs:GATA3-GFP fish, carrying a cmcl2:GFP transgenesis
marker. In the knockdown and rescue treatment groups, injections of a well characterized
translation-blocking gata3 morpholino 50 -CCGGACTTACTTCCATCGTTTATTT-30 (Gene
Tools, Philomath, OR, USA) were performed at the one-cell stage [49]. A 3 nL bolus of
a 5 ng/µL morpholino solution was injected, a concentration that phenocopies the gata3
mutant. Embryos were raised at 28.5 ◦ C until 24 hpf, at which point they were placed
into 15 mL conical tubes containing 1 mL of pre-heated embryo media. The tubes were
submerged in 39.5 ◦ C water for one hour to heat-shock the embryos. The embryos were then
returned to fresh embryo media and incubated at 28.5 ◦ C. This heat shock treatment has
been demonstrated to rescue the facial defects in gata3 morpholino injected embryos [20].
4.3. Sample Preparation and FACS
For each treatment group, 150–200 28 hpf embryos were dechorionated in a 2 mg/mL
pronase solution (Sigma-Aldrich, St. Louis, MO, USA) and washed in fresh embryo medium
after the chorions were removed. The embryos were briefly washed in cold calcium-free
Ringer’s solution and deyolked through up and down pipetting. The deyolked embryos
were collected by 300× g centrifugation, washed in embryo media, and placed on ice.Int. J. Mol. Sci. 2023, 24, 1222 11 of 15
They were then pelleted through centrifugation as before. The embryos were washed with
FACSmax cell dissociation solution (Genlantis, San Diego, CA, USA) and filtered through
a 40-micron cell strainer into a 35 mm Petri dish. Dissociated cells were collected in a
fresh Eppendorf tube and placed on ice. Just before sorting, the cells were filtered in a
polystyrene Falcon tube with a cell-strainer cap (Fisher Scientific, Hampton, NH, USA). Cell
sorting was performed with a BD FACSAria Fusion SORP Cell Sorter with DIVA 8 software
(BD Biosciences, San Jose, CA, USA), using a 100-micron nozzle. A 488 nm laser was used
to identify GFP-expressing cells and a 561 nm laser for RFP-expressing cells. Cells were first
analyzed for forward scatter and side scatter to be selected for live singlets; these cells were
then sorted for fluorescence. An additional gate was added to separate fli1:EGFP-expressing
cells from hs:GATA3-GFP-expressing cells (Figure S4). For each sample, approximately
100,000 cells were sorted for fluorescence. Cells from wild-type (AB) embryos of the same
embryonic stage were used as a negative control. For two-color sorts, cells from embryos
expressing only green or only red fluorescent markers were used as compensation controls.
Double-positive cells are cranial neural crest cells and were collected into 1 mL of TRIzol
(Invitrogen, Waltham, MA, USA) at 4 ◦ C.
4.4. cDNA Library Preparation and RNA Sequencing
Total RNA was extracted according to the TRIzol RNA isolation protocol. Samples
were purified with the RNA Clean & Concentrate kit (Zymo, Irvine, CA, USA). A Nanodrop
spectrophotomer was used to determine the concentration of each sample, followed by
RNA quality analysis with the Agilent BioAnalyzer (Agilent Technologies, Santa Clara, CA,
USA). Total RNA from each sample ranged from 5 to 12 ng/µL. Samples were processed
by the University of Texas at Austin Genomic Sequencing and Analysis Facility (GSAF).
Sequencing was performed on the Illumina NextSeq 500 platform, with 75-bp paired end
reads. Reads were trimmed for quality and adapters with Cutadapt v1.18 and aligned to the
Genome Reference Consortium Zebrafish Build 11 (GRCz11), downloaded from Ensembl,
using TopHat 2.1.1 [50–52]. Three biological replicates were used for RNA-sequencing.
4.5. Differential Expression Analysis
The dataset was checked for high read counts of flk1, sox2, and elavl3 to ensure that
there was no contamination of single-marker populations (vasculature and neurons). Nor-
malization and gene expression analysis were performed with the R package DESeq2 [53].
An FDR-corrected p-value of 0.05 was used as the cut-off to identify differentially expressed
transcripts. The directionally discordant subset of differentially regulated genes in the
control versus knockdown and control versus rescue comparison groups comprised the
final output of differentially expressed genes. The R package clusterProfiler was used
to identify enriched Gene Ontology (GO) terms in gene lists using a cut-off of 0.05 FDR
corrected p-value [54].
4.6. Identification and Testing of Chemical Modifiers
The Library of Integrated Network-based Cellular Signatures (LINCS) uses chemically
induced transcriptomic changes in a variety of cell types to predict chemical interactions.
Transcriptional changes due to a treatment (e.g., gata3 loss of function) are compared
across those within the database. Chemicals that elicit transcriptional changes that are
highly positively and inversely correlated with the treatment are predicted to worsen and
lessen the phenotype, respectively. The top 100 up- and down-regulated genes from the
aforementioned subset of differentially regulated genes were queried against the LINCS
L1000 dataset using the clue.io platform (https://clue.io/, accessed on 21 November
2022). Of the resultant nineteen chemical modifiers whose profile most resembled the
transcriptomic signature, 16 (8 each with positive and negative correlation with the query)
were commercially available for testing (Table 1). A dose response curve (0.1 µM, 1 µM,
10 µM, 100 µM) in wild-type embryos was used to determine the lowest observed adverse
effect level (LOAEL) that elicited a craniofacial defect, including disrupted trabeculaeInt. J. Mol. Sci. 2023, 24, 1222 12 of 15
(Figure S3, Table S3). Once the LOAEL was established, a narrower range of concentrations
centered on the LOAEL was used to dose gata3b1075 mutant embryos. To examine gene-
environment interactions, severe gata3 mutants were treated with chemicals predicted to
lessen phenotypes while mild mutants were treated with chemicals predicted to worsen the
phenotypes. Embryos were treated from 24 hpf to 48 hpf to ensure potential interactions
during the entire window of gata3 expression in neurocranial progenitor cells. The embryos
were then grown to 4 dpf, fixed, and stained with Alcian Blue and Alizarin Red [55].
Embryos were scored for anterior neurocranial phenotype based on the number of intact
trabeculae (0, 1, or 2). Flat-mounts of stained embryos were captured using a Zeiss Axio
Imager A1 microscope (Carl Zeiss AG, Jena, Germany).
Table 1. Predicted chemical modifiers identified by L1000 database.
Predicted CAS Registry
Chemical Function
Modification Number
Microtubule inhibitor,
Flubendazole acetylcholinesterase 31430-15-6
inhibitor
Cell cycle inhibitor,
Rigosertib 1225497-78-8
PLK inhibitor
Etacrynic acid Na/K/Cl transporter 58-54-8
PPAR receptor
Clofibric acid 882-09-7
agonist
Phenotype enhancer Tubulin inhibitor,
tubulin
Nocodazole 31430-18-9
polymerization
inhibitor
Tubulin inhibitor,
Vinorelbine 71486-22-1
apoptosis stimulant
Microtubule inhibitor,
Vinblastine 865-21-4
tubulin inhibitor
Microtubule inhibitor,
Vincristine 57-22-7
tubulin inhibitor
MEK inhibitor, MAP
PD-184352 212631-79-3
kinase
RNA polymerase
Triptolide 38748-32-2
inhibitor
HDAC inhibitor, cell
Belinostat 866323-14-0
cycle inhibitor
Calcium activated
potassium channel
BMS-191011 202821-81-6
Phenotype opener, potassium
suppressor channel activator
HDAC inhibitor, cell
ISOX 1045792-66-2
cycle inhibitor
RNA synthesis
Daunorubicin 20830-81-3
inhibitor
Potassium channel
Chromanol 1481-93-2
blocker
CDK inhibitor,
Alvocidib 146426-40-6
apoptosis stimulantInt. J. Mol. Sci. 2023, 24, 1222 13 of 15
4.7. Quantitative Reverse Transcription PCR (RT-qPCR)
We validated our RNA-seq data by testing five genes each that were up- and down-
regulated from the dataset. We used Invitrogen’s SuperScript First-Strand Synthesis System
for RT-PCR with oligo-d(T) primers. We performed RT-qPCR with Power Sybr Green
PCR master mix (Thermo Fisher Scientific, Waltham, MA, USA, 4367659) on the Applied
Biosystems QuantStudio 3 Real-Time PCR System (Thermo Fisher, A28567). QuantStudio
Real-Time PCR Software was used for data analysis using the 2–∆∆Ct method of relative
gene expression analysis. We used the gene csnk2b (casein kinase 2, beta polypeptide) as an
endogenous control based on its relatively unchanging expression across all experimental
groups. All primers used for qPCR can be found in Supplementary Table S1. Experiments
were performed in triplicate.
4.8. Trabecular Measurements
Linear measurements were conducted in ImageJ 1.53k. Trabecular length was mea-
sured from the boundary with the ethmoid plate to the anterior edge of the prechordal
plate. Gaps between nonintact trabeculae were not included in the measurement. The
midpoint of each trabecula was calculated from the length, and the width was measured at
each point. Mean length and widths were calculated across control and treatment groups.
Supplementary Materials: The following supporting information can be downloaded at: https://
www.mdpi.com/article/10.3390/ijms24021222/s1.
Author Contributions: Conceptualization, R.D.K. and J.K.E.; Formal analysis, R.D.K.; Funding ac-
quisition, J.K.E.; Investigation, R.D.K.; Methodology, R.D.K. and J.K.E.; Project administration, J.K.E.;
Resources, J.K.E.; Supervision, J.K.E.; Validation, R.D.K.; Visualization, R.D.K.; Writing—original
draft, R.D.K.; Writing—review and editing, R.D.K. and J.K.E. All authors have read and agreed to the
published version of the manuscript.
Funding: This work was supported by the NIH/NIDCR under Award Number R35DE029086.
Institutional Review Board Statement: Not applicable.
Informed Consent Statement: Not applicable.
Data Availability Statement: The data presented in this study are available in the article and the
Supplementary Materials. The raw RNA-seq data of this study will be deposited in the NCBI
Sequence Read Archive prior to publication.
Acknowledgments: The authors thank Vishy Iyer for his valuable input on bioinformatic analysis
of the transcriptomic data. We thank all members of the Eberhart lab for their manuscript and
visualization suggestions. We also thank Richard Salinas for his instruction in flow cytometry. We
would also like to thank Mary Swartz (lab manager) and Kathryn Thompson and Nika Sarraf (fish
facility technicians) for support of this research.
Conflicts of Interest: The authors declare no conflict of interest.
References
1. Watkins, S.E.; Meyer, R.E.; Strauss, R.P.; Aylsworth, A.S. Classification, epidemiology, and genetics of orofacial clefts. Clin. Plast.
Surg. 2014, 41, 149–163. [CrossRef] [PubMed]
2. Cordero, D.R.; Brugmann, S.; Chu, Y.; Bajpai, R.; Jame, M.; Helms, J.A. Cranial neural crest cells on the move: Their roles in
craniofacial development. Am. J. Med. Genet. A 2011, 155A, 270–279. [CrossRef]
3. Dixon, M.J.; Marazita, M.L.; Beaty, T.H.; Murray, J.C. Cleft lip and palate: Understanding genetic and environmental influences.
Nat. Rev. Genet. 2011, 12, 167–178. [CrossRef] [PubMed]
4. Eberhart, J.K.; Swartz, M.E.; Crump, J.G.; Kimmel, C.B. Early Hedgehog signaling from neural to oral epithelium organizes
anterior craniofacial development. Development 2006, 133, 1069–1077. [CrossRef]
5. Wada, N.; Javidan, Y.; Nelson, S.; Carney, T.J.; Kelsh, R.N.; Schilling, T.F. Hedgehog signaling is required for cranial neural crest
morphogenesis and chondrogenesis at the midline in the zebrafish skull. Development 2005, 132, 3977–3988. [CrossRef] [PubMed]
6. McCarthy, N.; Wetherill, L.; Lovely, C.B.; Swartz, M.E.; Foroud, T.M.; Eberhart, J.K. Pdgfra protects against ethanol-induced
craniofacial defects in a zebrafish model of FASD. Development 2013, 140, 3254–3265. [CrossRef] [PubMed]Int. J. Mol. Sci. 2023, 24, 1222 14 of 15
7. Dougherty, M.; Kamel, G.; Grimaldi, M.; Gfrerer, L.; Shubinets, V.; Ethier, R.; Hickey, G.; Cornell, R.A.; Liao, E.C. Distinct
requirements for wnt9a and irf6 in extension and integration mechanisms during zebrafish palate morphogenesis. Development
2013, 140, 76–81. [CrossRef]
8. Duncan, K.M.; Mukherjee, K.; Cornell, R.A.; Liao, E.C. Zebrafish models of orofacial clefts. Dev. Dyn. 2017, 246, 897–914.
[CrossRef]
9. Swartz, M.E.; Sheehan-Rooney, K.; Dixon, M.J.; Eberhart, J.K. Examination of a palatogenic gene program in zebrafish. Dev. Dyn.
2011, 240, 2204–2220. [CrossRef]
10. Fletcher, G.; Jones, G.E.; Patient, R.; Snape, A. A role for GATA factors in Xenopus gastrulation movements. Mech. Dev. 2006, 123,
730–745. [CrossRef]
11. Frelin, C.; Herrington, R.; Janmohamed, S.; Barbara, M.; Tran, G.; Paige, C.J.; Benveniste, P.; Zuniga-Pflucker, J.C.; Souabni, A.;
Busslinger, M.; et al. GATA-3 regulates the self-renewal of long-term hematopoietic stem cells. Nat. Immunol. 2013, 14, 1037–1044.
[CrossRef] [PubMed]
12. Kuo, C.T.; Morrisey, E.E.; Anandappa, R.; Sigrist, K.; Lu, M.M.; Parmacek, M.S.; Soudais, C.; Leiden, J.M. GATA4 transcription
factor is required for ventral morphogenesis and heart tube formation. Genes Dev. 1997, 11, 1048–1060. [CrossRef]
13. Bernardini, L.; Sinibaldi, L.; Capalbo, A.; Bottillo, I.; Mancuso, B.; Torres, B.; Novelli, A.; Digilio, M.C.; Dallapiccola, B. HDR
(Hypoparathyroidism, Deafness, Renal dysplasia) syndrome associated to GATA3 gene duplication. Clin. Genet. 2009, 76, 117–119.
[CrossRef]
14. Van Esch, H.; Groenen, P.; Nesbit, M.A.; Schuffenhauer, S.; Lichtner, P.; Vanderlinden, G.; Harding, B.; Beetz, R.; Bilous, R.W.;
Holdaway, I.; et al. GATA3 haplo-insufficiency causes human HDR syndrome. Nature 2000, 406, 419–422. [CrossRef]
15. Zhang, Y.B.; Hu, J.; Zhang, J.; Zhou, X.; Li, X.; Gu, C.; Liu, T.; Xie, Y.; Liu, J.; Gu, M.; et al. Genome-wide association study
identifies multiple susceptibility loci for craniofacial microsomia. Nat. Commun. 2016, 7, 10605. [CrossRef] [PubMed]
16. Lim, K.C.; Lakshmanan, G.; Crawford, S.E.; Gu, Y.; Grosveld, F.; Engel, J.D. Gata3 loss leads to embryonic lethality due to
noradrenaline deficiency of the sympathetic nervous system. Nat. Genet. 2000, 25, 209–212. [CrossRef] [PubMed]
17. Abe, M.; Cox, T.C.; Firulli, A.B.; Kanai, S.M.; Dahlka, J.; Lim, K.C.; Engel, J.D.; Clouthier, D.E. GATA3 is essential for separating
patterning domains during facial morphogenesis. Development 2021, 148. [CrossRef]
18. Sheehan-Rooney, K.; Swartz, M.E.; Zhao, F.; Liu, D.; Eberhart, J.K. Ahsa1 and Hsp90 activity confers more severe craniofacial
phenotypes in a zebrafish model of hypoparathyroidism, sensorineural deafness and renal dysplasia (HDR). Dis. Model. Mech.
2013, 6, 1285–1291. [CrossRef]
19. Hartsfield, J.K. Review of the etiologic heterogeneity of the oculo-auriculo-vertebral spectrum (Hemifacial Microsomia). Orthod.
Craniofac. Res. 2007, 10, 121–128. [CrossRef]
20. Swartz, M.E.; Lovely, C.B.; Eberhart, J.K. Variation in phenotypes from a Bmp-Gata3 genetic pathway is modulated by Shh
signaling. PLoS Genet. 2021, 17, e1009579. [CrossRef]
21. Barske, L.; Askary, A.; Zuniga, E.; Balczerski, B.; Bump, P.; Nichols, J.T.; Crump, J.G. Competition between Jagged-Notch and
Endothelin1 Signaling Selectively Restricts Cartilage Formation in the Zebrafish Upper Face. PLoS Genet. 2016, 12, e1005967.
[CrossRef] [PubMed]
22. Ashburner, M.; Ball, C.A.; Blake, J.A.; Botstein, D.; Butler, H.; Cherry, J.M.; Davis, A.P.; Dolinski, K.; Dwight, S.S.; Eppig, J.T.;
et al. Gene ontology: Tool for the unification of biology. The Gene Ontology Consortium. Nat. Genet. 2000, 25, 25–29. [CrossRef]
[PubMed]
23. Subramanian, A.; Narayan, R.; Corsello, S.M.; Peck, D.D.; Natoli, T.E.; Lu, X.; Gould, J.; Davis, J.F.; Tubelli, A.A.; Asiedu, J.K.; et al.
A Next Generation Connectivity Map: L1000 Platform and the First 1,000,000 Profiles. Cell 2017, 171, 1437–1452.e1417. [CrossRef]
[PubMed]
24. Fruscio, R.; de Haan, J.; Van Calsteren, K.; Verheecke, M.; Mhallem, M.; Amant, F. Ovarian cancer in pregnancy. Best Pract. Res.
Clin. Obstet. Gynaecol. 2017, 41, 108–117. [CrossRef] [PubMed]
25. Luci, S.; Giemsa, B.; Hause, G.; Kluge, H.; Eder, K. Clofibrate treatment in pigs: Effects on parameters critical with respect to
peroxisome proliferator-induced hepatocarcinogenesis in rodents. BMC Pharmacol. 2007, 7, 6. [CrossRef] [PubMed]
26. Ringseis, R.; Gutgesell, A.; Dathe, C.; Brandsch, C.; Eder, K. Feeding oxidized fat during pregnancy up-regulates expression of
PPARalpha-responsive genes in the liver of rat fetuses. Lipids Health Dis. 2007, 6, 6. [CrossRef] [PubMed]
27. Pandolfi, P.P.; Roth, M.E.; Karis, A.; Leonard, M.W.; Dzierzak, E.; Grosveld, F.G.; Engel, J.D.; Lindenbaum, M.H. Targeted
disruption of the GATA3 gene causes severe abnormalities in the nervous system and in fetal liver haematopoiesis. Nat. Genet.
1995, 11, 40–44. [CrossRef]
28. Ciani, L.; Krylova, O.; Smalley, M.J.; Dale, T.C.; Salinas, P.C. A divergent canonical WNT-signaling pathway regulates microtubule
dynamics: Dishevelled signals locally to stabilize microtubules. J. Cell Biol. 2004, 164, 243–253. [CrossRef]
29. Fukuda, Y.; Sano, O.; Kazetani, K.; Yamamoto, K.; Iwata, H.; Matsui, J. Tubulin is a molecular target of the Wnt-activating chemical
probe. BMC Biochem. 2016, 17, 9. [CrossRef]
30. Jordan, M.A.; Himes, R.H.; Wilson, L. Comparison of the effects of vinblastine, vincristine, vindesine, and vinepidine on
microtubule dynamics and cell proliferation in vitro. Cancer Res. 1985, 45, 2741–2747.
31. Hou, Z.Y.; Tong, X.P.; Peng, Y.B.; Zhang, B.K.; Yan, M. Broad targeting of triptolide to resistance and sensitization for cancer
therapy. Biomed. Pharmacother. 2018, 104, 771–780. [CrossRef] [PubMed]Int. J. Mol. Sci. 2023, 24, 1222 15 of 15
32. Reno, T.A.; Kim, J.Y.; Raz, D.J. Triptolide Inhibits Lung Cancer Cell Migration, Invasion, and Metastasis. Ann. Thorac. Surg. 2015,
100, 1817–1824; discussion 1815–1824. [CrossRef]
33. Ziaei, S.; Halaby, R. Immunosuppressive, anti-inflammatory and anti-cancer properties of triptolide: A mini review. Avicenna J.
Phytomed. 2016, 6, 149–164.
34. Vispe, S.; DeVries, L.; Creancier, L.; Besse, J.; Breand, S.; Hobson, D.J.; Svejstrup, J.Q.; Annereau, J.P.; Cussac, D.; Dumontet, C.;
et al. Triptolide is an inhibitor of RNA polymerase I and II-dependent transcription leading predominantly to down-regulation of
short-lived mRNA. Mol. Cancer Ther. 2009, 8, 2780–2790. [CrossRef] [PubMed]
35. Okun, D.B.; Groncy, P.K.; Sieger, L.; Tanaka, K.R. Acute leukemia in pregnancy: Transient neonatal myelosuppression after
combination chemotherapy in the mother. Med. Pediatr. Oncol. 1979, 7, 315–319. [CrossRef] [PubMed]
36. Al-Aamri, H.M.; Ku, H.; Irving, H.R.; Tucci, J.; Meehan-Andrews, T.; Bradley, C. Time dependent response of daunorubicin on
cytotoxicity, cell cycle and DNA repair in acute lymphoblastic leukaemia. BMC Cancer 2019, 19, 179. [CrossRef] [PubMed]
37. Han, Y.; Zhang, J.P.; Qian, J.Q.; Hu, C.Q. Cardiotoxicity evaluation of anthracyclines in zebrafish (Danio rerio). J. Appl. Toxicol.
2015, 35, 241–252. [CrossRef] [PubMed]
38. Logan, K.; Ackerman, S. Effects of antibiotics on RNA polymerase III transcription. DNA 1988, 7, 483–491. [CrossRef]
39. Pallis, M.; Burrows, F.; Whittall, A.; Boddy, N.; Seedhouse, C.; Russell, N. Efficacy of RNA polymerase II inhibitors in targeting
dormant leukaemia cells. BMC Pharmacol. Toxicol. 2013, 14, 32. [CrossRef]
40. Liang, X.; Xie, R.; Su, J.; Ye, B.; Wei, S.; Liang, Z.; Bai, R.; Chen, Z.; Li, Z.; Gao, X. Inhibition of RNA polymerase III transcription by
Triptolide attenuates colorectal tumorigenesis. J. Exp. Clin. Cancer Res. 2019, 38, 217. [CrossRef]
41. Dale, R.M.; Sisson, B.E.; Topczewski, J. The emerging role of Wnt/PCP signaling in organ formation. Zebrafish 2009, 6, 9–14.
[CrossRef] [PubMed]
42. Park, M.; Moon, R.T. The planar cell-polarity gene stbm regulates cell behaviour and cell fate in vertebrate embryos. Nat. Cell Biol.
2002, 4, 20–25. [CrossRef]
43. Topczewski, J.; Dale, R.M.; Sisson, B.E. Planar cell polarity signaling in craniofacial development. Organogenesis 2011, 7, 255–259.
[CrossRef] [PubMed]
44. Kamel, G.; Hoyos, T.; Rochard, L.; Dougherty, M.; Kong, Y.; Tse, W.; Shubinets, V.; Grimaldi, M.; Liao, E.C. Requirement for frzb
and fzd7a in cranial neural crest convergence and extension mechanisms during zebrafish palate and jaw morphogenesis. Dev.
Biol. 2013, 381, 423–433. [CrossRef] [PubMed]
45. Brinkmann, E.M.; Mattes, B.; Kumar, R.; Hagemann, A.I.; Gradl, D.; Scholpp, S.; Steinbeisser, H.; Kaufmann, L.T.; Ozbek, S.
Secreted Frizzled-related Protein 2 (sFRP2) Redirects Non-canonical Wnt Signaling from Fz7 to Ror2 during Vertebrate Gastrula-
tion. J. Biol. Chem. 2016, 291, 13730–13742. [CrossRef] [PubMed]
46. Kimmel, C.B.; Ballard, W.W.; Kimmel, S.R.; Ullmann, B.; Schilling, T.F. Stages of embryonic development of the zebrafish. Dev.
Dyn. 1995, 203, 253–310. [CrossRef]
47. Lawson, N.D.; Weinstein, B.M. In vivo imaging of embryonic vascular development using transgenic zebrafish. Dev. Biol. 2002,
248, 307–318. [CrossRef] [PubMed]
48. Kucenas, S.; Takada, N.; Park, H.C.; Woodruff, E.; Broadie, K.; Appel, B. CNS-derived glia ensheath peripheral nerves and
mediate motor root development. Nat. Neurosci. 2008, 11, 143–151. [CrossRef]
49. Yang, L.; Rastegar, S.; Strahle, U. Regulatory interactions specifying Kolmer-Agduhr interneurons. Development 2010, 137,
2713–2722. [CrossRef]
50. Kim, D.; Pertea, G.; Trapnell, C.; Pimentel, H.; Kelley, R.; Salzberg, S.L. TopHat2: Accurate alignment of transcriptomes in the
presence of insertions, deletions and gene fusions. Genome Biol. 2013, 14, R36. [CrossRef]
51. Martin, M. Cutadapt removes adapter sequences from high-throughput sequencing reads. EMBnet J. 2011, 17, 3. [CrossRef]
52. Zerbino, D.R.; Achuthan, P.; Akanni, W.; Amode, M.R.; Barrell, D.; Bhai, J.; Billis, K.; Cummins, C.; Gall, A.; Giron, C.G.; et al.
Ensembl 2018. Nucleic Acids Res. 2018, 46, D754–D761. [CrossRef] [PubMed]
53. Love, M.I.; Huber, W.; Anders, S. Moderated estimation of fold change and dispersion for RNA-seq data with DESeq2. Genome
Biol. 2014, 15, 550. [CrossRef] [PubMed]
54. Yu, G.; Wang, L.G.; Han, Y.; He, Q.Y. clusterProfiler: An R package for comparing biological themes among gene clusters. OMICS
2012, 16, 284–287. [CrossRef] [PubMed]
55. Walker, M.B.; Kimmel, C.B. A two-color acid-free cartilage and bone stain for zebrafish larvae. Biotech. Histochem. 2007, 82, 23–28.
[CrossRef] [PubMed]
Disclaimer/Publisher’s Note: The statements, opinions and data contained in all publications are solely those of the individual
author(s) and contributor(s) and not of MDPI and/or the editor(s). MDPI and/or the editor(s) disclaim responsibility for any injury to
people or property resulting from any ideas, methods, instructions or products referred to in the content.You can also read